HFCLHFCL showing trendline breakout with higher high pattern. Market participation has also increased since few sessions. Probability of new momentum rally is quite higher. It has also booked highest weekly volume since last 7-8 months.
Supportbreakout

Is Sugar the New 'Dr. Copper'? What Mean for the S&P 500?Sugar isn’t just the sweet powder we add to coffee. It’s a global commodity whose price swings reveal surprising truths about the world economy. With sugar prices now hovering near the 17.5–17.7 per pound support level for the sixth time since 2022, it’s time to ask: What story are these numbers telling us?
Sugar’s History: Peaks and Valleys
Sugar has always been a fickle player in commodity markets. Its price has soared above $20 per pound due to droughts or poor harvests, only to crash when supply outstrips demand. But today’s figures are particularly troubling.
Facts:
In recent months, sugar prices have not only approached multi-year lows but remain stagnant.
Low prices signal weak demand. And where there’s no demand, there’s no production growth.
But let’s zoom out: If sugar is losing its appeal, could this be a sign of slowing economic activity? If you think this is speculative, consider real-world data.
“Dr. Copper” vs. “Dr. Sugar”
We all know copper is the economy’s barometer, correlating with industrial production, construction, and tech innovation. But why isn’t sugar part of the conversation? 🍬
Why Sugar Matters:
The Confectionery Industry: Sugar is a cornerstone of baked goods, candies, and everyday staples. A drop in consumption could reflect shrinking consumer purchasing power.
Global Ubiquity: Unlike copper, sugar is used everywhere—from developing economies to wealthy nations. Its demand mirrors economic sentiment and living standards.
The U.S. Economic Outlook: Alarming Signals
Recent U.S. economic indicators paint a grim picture:
Rising Unemployment: The U.S. unemployment rate hit 4.1% in Feb 2025 (up from 3.9% a year prior), signaling job losses in key sectors.
Slowing GDP Growth: expanded by 2.8% in 2024, little-changed from the 2.9% growth recorded in the previous year- below analysts’ expectations.
Inflation “Cooling”: While inflation dipped to 2.4% in March, falling commodity prices (like sugar) may hint at deflationary pressures.
What “Dr. Sugar” Reveals
Connecting the dots—low sugar prices, slowing production, rising unemployment, and weak GDP growth—paints a clear picture: The U.S. (and global) economy is at a crossroads.
Key Takeaways:
Falling sugar prices may signal early-stage declines in consumer demand.
Deflationary trends could threaten the S&P 500 as companies face shrinking revenues and margins.
Given current data, the risk of a recession within months remains high.
How to Use Sugar as an Economic Indicator
To track economic health:
Monitor Exchange Prices: Sudden sugar price drops may foreshadow economic slowdowns.
Compare with Other Staples: Track correlations with wheat, corn, and other food commodities to gauge consumer behavior shifts.
Watch Producers: Food industry giants often react first to demand changes. Study their earnings reports.
Conclusion: A Sweet Indicator of Bitter Times?
Sugar is more than a raw material—it’s a mirror reflecting economic sentiment. Today, with prices near historic lows and U.S. economic data flashing warning signs, we must ask: Are we ready for a potential recession?
I believe “Dr. Sugar” deserves more attention. What’s your take? Join the discussion and share your thoughts! 💬

#1000RATSUSDT maintains bearish momentum📉 SHORT BYBIT:1000RATSUSDT.P from $0.01823
🛡 Stop Loss: $0.01855
⏱ 15M Timeframe
✅ Overview:
➡️ BYBIT:1000RATSUSDT.P is in a downtrend after rejecting the descending trendline, confirming buyer weakness.
➡️ Volume Profile suggests that the main liquidity (POC) is positioned at $0.01938, reinforcing selling pressure.
➡️ The Head and Shoulders pattern strengthens the bearish case, and a break below $0.01823 will trigger further decline.
➡️ The main downside targets are in the $0.01800 – $0.01764 range, where profit-taking may occur.
⚡ Plan:
➡️ Short entry upon breaking $0.01823, confirming the bearish scenario.
➡️ Stop-Loss at $0.01855—placed above the nearest resistance to minimize risk.
➡️ Main targets: $0.01800, $0.01780, and $0.01764, where downside movement may slow down.
🎯 TP Targets:
💎 TP 1: $0.01800
🔥 TP 2: $0.01780
⚡ TP 3: $0.01764
🚀 BYBIT:1000RATSUSDT.P maintains bearish momentum — expecting further downside!
📢 BYBIT:1000RATSUSDT.P remains weak, and a breakdown below $0.01823 could accelerate the decline.
📢 Watch for price reactions near $0.01764, where a slowdown or bounce may occur.

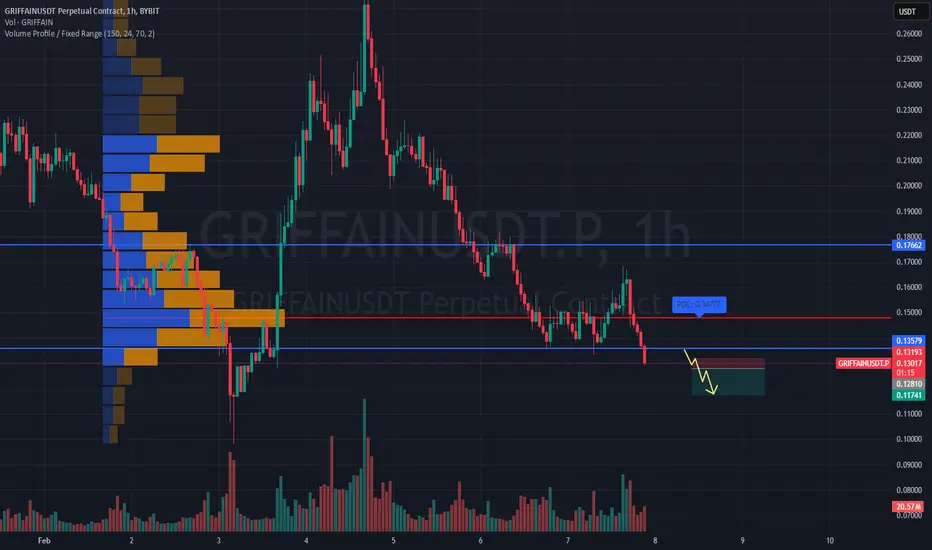
SHORT #GRIFFAINUSDT expecting further downside📉 SHORT BYBIT:GRIFFAINUSDT.P from $0.12810
🛡 Stop loss $0.13193
⏱ Timeframe: 1H
✅ Overview:
➡️ BYBIT:GRIFFAINUSDT.P is showing weakness after reaching a local high, rejecting from a resistance zone.
➡️ POC (Point of Control) at 0.13193 acts as a key volume area with significant trading activity.
➡️ Price action suggests seller dominance, indicating a potential continuation of the downtrend.
➡️ If the 0.12810 support level breaks, expect an increase in bearish momentum.
⚡ Plan:
➡️ Short entry upon confirmation of a breakdown below 0.12810.
➡️ Increased selling volume will confirm the continuation of the bearish trend.
➡️ Holding the position with dynamic monitoring until the first Take Profit level.
🎯 TP Targets:
💎 TP 1: 0.11741 – first target based on the nearest support level.
📢 BYBIT:GRIFFAINUSDT.P is showing bearish signs, but volume and pullback dynamics should be monitored.
📢 A break below 0.12810 could trigger a deeper decline.
📢 If buyers show strength, watch 0.13193 as a possible reversal point.
🚀 BYBIT:GRIFFAINUSDT.P maintains bearish momentum — expecting further downside!
NQ Power Range Report with FIB Ext - 1/13/2025 SessionCME_MINI:NQH2025
- PR High: 21027.75
- PR Low: 20942.50
- NZ Spread: 191.0
No key scheduled economic events
Breaking below 21000 inventory pivots from Nov 27, Dec 20 and Jan 2
- Should peak the interest of both buyers and sellers (liquidity boost)
- Buyers expecting repeat rotation
- Sellers expecting bullish breakdown
- First full trading week since the week before Christmas
Session Open Stats (As of 12:25 AM 1/13)
- Weekend Gap: N/A
- Gap 10/30/23 +0.47%
- Session Open ATR: 387.17
- Volume: 39K
- Open Int: 242K
- Trend Grade: Bull
- From BA ATH: -7.0% (Rounded)
Key Levels (Rounded - Think of these as ranges)
- Long: 22667
- Mid: 21525
- Short: 19814
Keep in mind this is not speculation or a prediction. Only a report of the Power Range with Fib extensions for target hunting. Do your DD! You determine your risk tolerance. You are fully capable of making your own decisions.
BA: Back Adjusted
BuZ/BeZ: Bull Zone / Bear Zone
NZ: Neutral Zone

NQ Power Range Report with FIB Ext - 11/1/2024 SessionCME_MINI:NQZ2024
- PR High: 20112.50
- PR Low: 20064.00
- NZ Spread: 108.5
Key scheduled economic events
08:30 | Average Hourly Earnings
- Nonfarm Payrolls
- Unemployment Rate
10:00 | ISM Manufacturing PMI
- ISM Manufacturing Prices
10:45 | S&P Global US Manufacturing PMI
New lows to close October below 20100
- Holding previous session lows
Session Open Stats (As of 12:55 AM 11/1)
- Weekend Gap: +0.24 (filled)
- Gap 10/30/23 +0.47% (open < 14272)
- Session Open ATR: 296.40
- Volume: 28K
- Open Int: 257K
- Trend Grade: Bull
- From BA ATH: -5.2% (Rounded)
Key Levels (Rounded - Think of these as ranges)
- Long: 20954
- Mid: 19814
- Short: 17533
Keep in mind this is not speculation or a prediction. Only a report of the Power Range with Fib extensions for target hunting. Do your DD! You determine your risk tolerance. You are fully capable of making your own decisions.
BA: Back Adjusted
BuZ/BeZ: Bull Zone / Bear Zone
NZ: Neutral Zone

Intel - Retest, reversal and rejection!NASDAQ:INTC has been establishing a slight bullish trend over the past couple of years.
A clear trend is the basis of every profitable trade, right? Yes and no. You should primarily focus on trading trends and entering positions during such phases. But Intel is a textbook example of a range bound stock; still there are trading opportunities everywhere. Currently Intel is retesting support and is starting to reverse towards the upside. But please: Manage your risk properly.
Levels to watch: $30, $45
Keep your long term vision,
Philip - BasicTrading

Bearish Pennant Pattern and Support Breakout in MDTUSDT CoinAnalysis:
Chart Pattern: MDT/USDT is showing a Bearish Pennant pattern below the support level, indicating potential for further downward movement.
Support Breakout: The coin has broken below a key support level, suggesting increased selling pressure.
Target Price: Estimate target prices based on the height of the pennant.
Cautionary Note:
Be careful, as trading cryptocurrencies involves significant risks. Ensure to assess your financial situation and investment goals before making any decisions.
Stop-Loss: Set a stop-loss slightly above the pennant's upper boundary to manage risk.

Arlo Macro Bullish Case + Ascending Channel trade setupHi Guys. As always im on the look out for Macro opportunities in assets with market structure or patterns that scream "Pay Attention to me".
One that stood out to me was ARLO.
This analysis is on the 1 week timeframe.
Notice the Orange rectangle. This zone is a MAJOR Support/ Resistance zone.
When Arlo went Public, we started ABOVE this zone.
Then made our way to the zone, attempted to maintain SUPPORT but eventually fell through and most of price action stayed Below the Zone since 2019.
We had many attempted to test the Zone and try to breakout with little to no luck in:
1. Feb 2021
2. Dec 2021
3. Feb 2022
4. July 2023
5. Sept 2023
UNTIL RECENTLY in March we made our way ABove this zone
We then came down to the bottom fo the zone and confirmed Support. With our current weeks candle up 11% indicating a BUllish Engulfing candle and MAJOR DEMAND.
I believe we are now on our way to test the Upper resistance limit of the Blue Ascending Channel that Arlo seems to be in.
After which we will attempt a Major Support test of the Zone.
Its also IMPORTANT to note, Above the zone, very little data exists. Meaning that theres very little resistance Above. This could fuel an extended Bull run for ARLO to New Highs.
But keep in mind specific signals or signs are needed.
Keep an eye for updates on further signs/ clues to take into consideration to help us make informed decisions!
__________________________________________________________________________________
Thank you for taking the time to read my analysis. Hope it helped keep you informed. Please do support my ideas by boosting, following me and commenting. Thanks again.
Stay tuned for more updates on ARLO in the near future.
If you have any questions, do reach out. Thank you again.
DISCLAIMER: This is not financial advice, i am not a financial advisor. The thoughts expressed in the posts are my opinion and for educational purposes. Do not use my ideas for the basis of your trading strategy, make sure to work out your own strategy and when trading always spend majority of your time on risk management strategy.

Looking bearish on CCL immediately for a swing!🔉Sound on!🔉
Thank you as always for watching my videos. I hope that you learned something very educational! Please feel free to like, share, and comment on this post. Remember only risk what you are willing to lose. Trading is very risky but it can change your life!

📈🚀 HBAR Support Breakout Trade Setup 🚀📈📊 Analysis:
Steady Support: HBAR has demonstrated resilience at the $0.10 support level over the past few days, indicating strong demand in this area.
Resistance Ahead: The next local resistance is at $0.117, a crucial level to watch for potential breakout confirmation.
Upside Potential: Clearing resistance at $0.117 could pave the way for a bullish rally towards $0.14 and $0.19.
📈 Trade Plan:
Entry: Consider entering a long position once HBAR clears and holds above the $0.117 resistance level.
Target: Set profit targets at $0.14 and $0.19, anticipating bullish momentum on a successful breakout.
Risk Management: Place stop-loss orders to manage risk, ensuring they are strategically placed below key support levels to mitigate potential losses.
💡 Note: Monitor price action closely for confirmation of breakout and adjust the trade plan accordingly. 📈💰 #HBAR #SupportBreakout 🚀📉

🚀📈 NEAR Support Breakout Trade Setup 📈🚀📊 Analysis:
Strong Support: NEAR has rebounded from the support level at $6.43, indicating strength in this area.
Confirmation Needed: Conviction will increase with a clear break above $6.80 and sustained holding above this level.
Laddering Strategy: Plan to enter the trade gradually, starting with minimal leverage and increasing as key resistance levels are surpassed.
📈 Trade Plan:
Entry: Initiate laddered positions once NEAR breaks and holds above $6.80.
Target: Aim for a target of up to $8.80, with potential for further upside.
Risk Management: Start with minimal leverage and increase gradually as NEAR surpasses crucial levels. Set stop-loss orders to manage risk effectively.
💡 Note: Monitor price action closely for confirmation of bullish momentum and adjust strategy accordingly. 📈💰 #NEAR #SupportBreakout 🚀📉

Mastering Support & Resistance This video dives into the fundamentals of support and resistance, the cornerstones of technical analysis.
We'll cover:
** Identifying trends:** Learn how to spot bullish and bearish trends using higher highs/higher lows (HH/HL) and lower highs/lower lows (LH/LL).
️** Support & Resistance Levels: Discover how to pinpoint key price levels where the market may bounce or reverse, creating potential trading opportunities.
** Fibonacci: Unlock the power of the Fibonacci retracement to identify high-probability trade entry points at the 61.8% level.

TASI_ Wait for Support BreakoutTASI has been in correction for a while
A trendline breakout is observed recently (with Formation of HH) which gave a short positive upside movement.
Formation of HL in progress
11,000 is a significant resistance line
Bulls need to break the resistance line for upside movement.
Watch for individual stocks for proper entry

BluetonaFX - AUDUSD SHORT to Yearly Low Break IdeaHi Traders!
AUDUSD is under more pressure, and there is a potential support break on the 1D chart.
Price Action 📊
The price action currently looks bearish, with market swings showing lower highs and lower lows.
We are looking for a break and a close below the support price at 0.62856, which is the yearly low.
Fundamental Analysis 📰
Last Thursday, employment figures from Australia lessened expectations of an RBA rate hike, which has the Australian dollar currently trading under pressure.
Support 📉
0.62856: YEARLY LOW
Resistance 📈
0.63298: PREVIOUS DAY'S HIGH
Risk ⚠️
No more than 2% of your capital.
Reward 💰
At least 4% of your capital.
Please make sure to click on the like/boost button 🚀 as your support greatly helps.
Trade safely and responsibly.
BluetonaFX

USDCADUSDCAD was trading in bullish ascending channel and then buying pressure seems limited. Now the pair is seems to be under strong sell pressure and break through important support zone with enormous sell pressure.
If the bears pressure is still on then bear's next target will be 1.3400.
What you guys think of it ?

DXY lows break!1. Dollar Index has broken down from support. Just touched 200 EMA on weekly chart.
2. Close to end of decline or more room left?
3. What if the Federal Reserve has to cut rates sometime in the next 12 months?
Things to think about.
❤ or follow?

📊 6 Examples of Rejections at S/R Areas📍Support and Resistance 101
Support and resistance are two foundational concepts in technical analysis. Understanding what these terms mean and their practical application is essential to correctly reading price charts. Prices move because of supply and demand. When demand is greater than supply, prices rise. When supply is greater than demand, prices fall. Sometimes, prices will move sideways as both supply and demand are in equilibrium. Like many concepts in technical analysis, the explanation and rationale behind technical concepts are relatively easy, but mastery in their application often takes years of practice. S/R level areas can develop inside different candlestick patterns as well as trend trading patterns. The Resistance being the top of the pattern and the support being the bottom of it.
🔹Technical analysts use support and resistance levels to identify price points on a chart where the probabilities favor a pause or reversal of a prevailing trend.
🔹Support occurs where a downtrend is expected to pause due to a concentration of demand.
🔹Resistance occurs where an uptrend is expected to pause temporarily, due to a concentration of supply.
🔹Market psychology plays a major role as traders and investors remember the past and react to changing conditions to anticipate future market movement.
🔹Support and resistance areas can be identified on charts using trendlines and moving averages as well as different types of patterns.
👤 @AlgoBuddy
📅 Daily Ideas about market update, psychology & indicators
❤️ If you appreciate our work, please like, comment and follow ❤️

EURCAD - Looking To Sell Pullbacks In The Short TermH4 - Price has broken below a strong support zone which currently acts as a strong resistance zone after the breakout.
Lower lows.
No opposite signs.
Until this strong resistance zone holds I expect the price to move lower further after pullbacks.

EURUSDIs EURUSD done with upward trajectory ?
break of horizontal support and trendline support indicating for downward movement.
Don't forget to share your reviews.

GOLD H4Hello traders,
watch GOLD to break the support wait for price retest and look for a short position opportunity, if price hold the support and didn't break watch price to break the 50 moving average and look for a long position opportunity.
This is my analysis and view about GOLD.
This is just analysis, not the exact trade or any kind of signal that proven with wining or losing % so be sure trade with your own according strategy do not depend on my analysis.
I wish you good luck and good trading.


EURCADIn the daily time frame, we reached a strong resistance level, and in the lower time frames, we see weakness in the current movement. This weakness can be seen in the negative divergence and we expect to see the price return to the specified area in these areas.
By checking the skewness coefficient, we realize that this weakness started from very low areas and became more obvious at the current peak.
According to the news on both the euro and the Canadian dollar, it is not unlikely that it will hold for a few hours in this area and it is better to wait for the failure of the red area.
