Flag PatternThe asset has also provided a flag pattern and now is in a flag pattern again, the 100 MA will provide support the price, and the Coppock curve is a in a triangle pattern and it will most likely breakout upwards to be positive. Also, this is backed by the volume decreasing showing a breakout is Imminent.
Supportbreakout

GBPJPY Break Support-line + RetestPrice broke support -> becomes resistance.
Price tested the EMA in 15 min chart but could not close above it.

Target almost hit! => +400 PipsAs advised 23/03. breakout out of Feb low price resulted in a sell of right towards the massive support area 107 - 106. Only 1/2 position invested as price never retraced to the 2nd entry. Prepared to take of position at 107.5 and look for long short term entries.
Another +250 Pips potentially to be earned on the pullback out of the above mentioned support area


Ftse 100 amist the volatilityThe Ftse 100 has been reacting to recent events like article 50 activation and is highly volatile.
But the price is a new fan area so could represent a trend change, furthermore the price broke out of the ascending triangle, and now if the price closes below the 200 MA and the trendline - short.

Another Short on the USD/JPYHey everyone, we are gathered here for another possible short opportunity on the USD/JPY. After a great jobs report this pair ran all the way up a smacked head on in the long standing trendline the FOMC minutes sent it tumbling like a house of cards. It Broke though the another trendline and is currently below a D1 and W1 support level @ 110.541 on the 4H chart. A short on this pair would be confirmed of it closes below this support level. Remember, the Asian markets are about to absorb the news and likely to push the pair down. With no major news until Friday, this thing could easily see 110.000 before then.

Long from bottom0.77 is a hard support. I think a long to 0.772 is possible. If breaktrough than 0.769 possible.


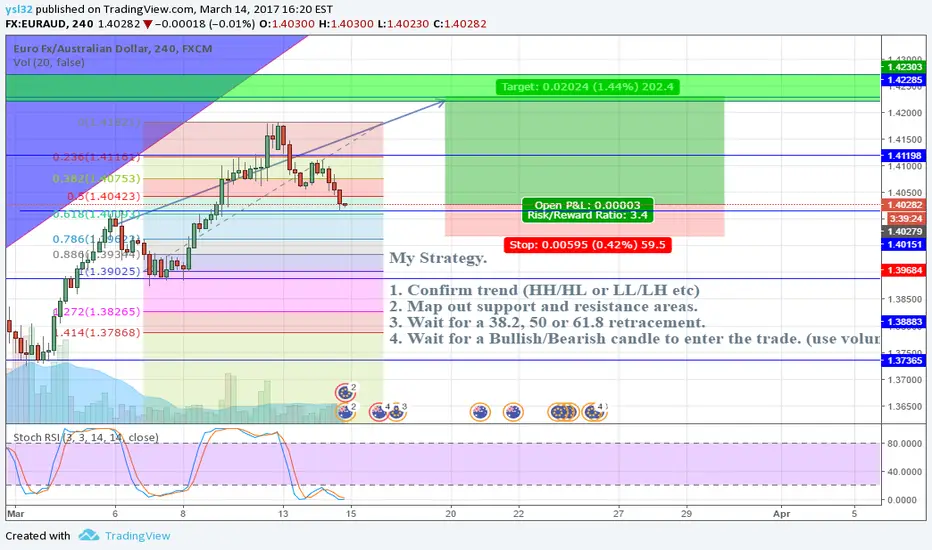
EURAUD - longJust Testing my new long term strategy. Any ideas on how i can improve it please let me know. Thanks!!!


GBP/JPY 4HR -- potential breakout Sujective view on GBP/JPY 4HR chart
>potential breakout at the support area of triangle.
>wait for retesting the support zone and break below and close below candle before trigger.
Stops @ 140.600
Profit targets: 137.000

Selling AUD/JPYAfter building some lower highs (and expecting lower lows), and breaking the support line, I think, this is a SELL.
Trade carefully!


Good sell opportunity with a decent Risk reward ratioA few things here
Broken support line
MACD has just crossed and entered the sell zone, shown by arrow
RSI has a broken pattern as well, indicated by the arrow
To set stop loss level, it is clear there is a strong resistance at around 1.075, as it bounced back down twice from this price, so 1.08 is a safe level
As for the Reward, Fib and previous structures show there is a potential turn around at about 1.05 (also because its a round number as well)
Let me know what you think guys :)

Filling the Gap?For the past month, price has been pushed down slowly staying near support for most of the time. Also, the 20ma has been acting as a dynamic resistance, and price has seen more resistance from a descending trend line.
Price has just broken and close below support (Double Blue Line)
Price has also closed below the 50ma, which has acted as dynamic support/resistance in the past.
There is also a head & shoulders pattern on the MACD Leader, and Insync Index
Price target is $87.88 for a R:R of 4.47
Went short with an entry of $99.06 after seeing a break of $99.20, Stop loss at $101.57

AUDCHF 4HAUDCHF Triangle and support connection point must be followed.
PLEASE LIKE :)
YATIRIM TAVSIYESI DEGILDIR.


USDCAD: bounce or break?USDCAD has a very peculiar configuration this week.
The support at 1.31220 was violated on Thursday, but the Bulls came into the game to bring it up above it again.
Nevertheless, another bearish bar closed just below it on Friday.
Macro and Cyclicity are expecting a signal to go LONG.
Interesting to watch and see whether this takes a clear position either LONG or SHORT.
In both cases we should have margin for a TP1 of about 100 PIPs and a TP2 of about 200 PIPs with even more possibility if the starting trend is strong, as you can see in the #support #resistance levels highlighted in the chart.
Prices refer to this chart and may vary with other platform/brokers.
I always discuss and follow up these ideas on my blog.

USDCHF bouncing before moving down?USDCHF might open interesting opportunities if the level around 1.00641 gets broken.
There are three different supports to look at downwards: 0.99421, 0.98382, 0.97390.
While breaking the psychological level of parity might be not probable, the Risk-Reward-Ratio in this case looks really appealing.
A factor of risk is the volatility shown in the last month or so having the price just range in the area 1.006 to 1.025 - 1.030 which makes a bounce even more probable.
Prices are relative to chart and may vary with other brokers/platforms.
I discuss always discuss and follow up these ideas on my blog.
