S looking for a major bounce. 2 levels to watch forS is trying to find its bottom and as long as the price stays above 0.37 it may have achieved it. A breakdown to the 1.68 fib extension will take the price to the next horizontal support found on the FTM chart.
Full TA: Link in the BIO
Susdt

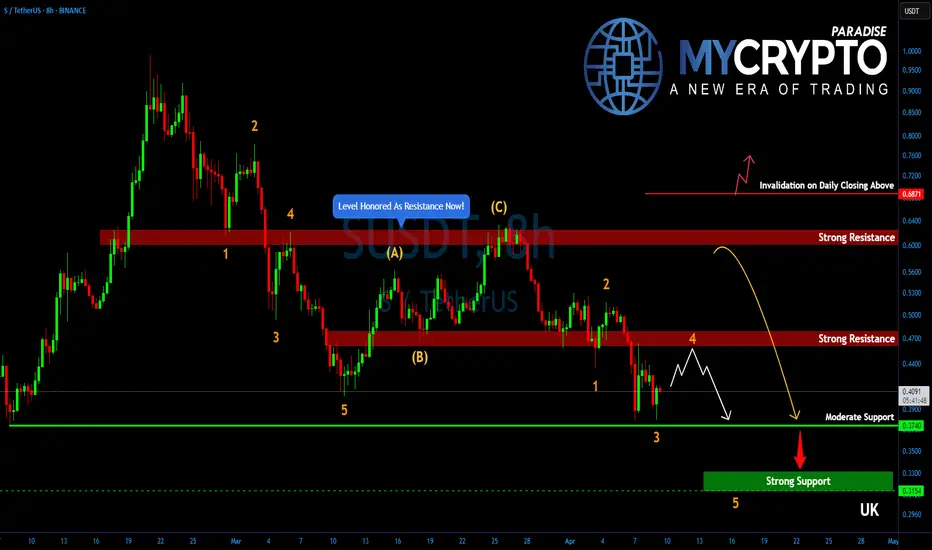
SUSDT Still in Trouble – Is the Worst Yet to Come?Yello, Paradisers! Are you letting this short-term bounce on #SUSD fool you? Be careful. What looks like a recovery could just be a deceptive pause before the next major drop hits.
💎After topping out just shy of the psychological $1.00 mark, SUSDT has entered a significant zigzag corrective structure. Despite the recent bounce, the bigger picture still suggests that the market is setting up for one more leg to the downside, where the real bottom might finally be reached.
💎#SUSDT has printed a short-term double bottom around the $0.38 level, positioned slightly above a moderate support zone. This has triggered a minor bullish push, offering a temporary sense of relief for bulls. However, based on the current market structure, this move is likely to be short-lived and part of a broader corrective pattern.
💎The resistance zone between $0.465 and $0.4720 is now the key level to watch. It’s a strong supply area where selling pressure is expected to return with intensity, making it difficult for buyers to gain control. If price gets rejected from this zone, a drop back toward the $0.3740 level is highly probable, as this area serves as the next moderate support.
💎The structure on SUSDT is far from done to the downside. If the rejection plays out as expected, the price could slide even lower, targeting the $0.3300 to $0.3150 range. This is where the final drop may conclude and a proper base for recovery could finally be established.
Paradisers, strive for consistency, not quick profits. Treat the market as a businessman, not as a gambler.
MyCryptoParadise
iFeel the success🌴
SUSDT 12HS ~ 12H Analysis
#S Buy gradually from here if you still have a Conviction on this coin with a short -term target of at least 10%+.


#SUSDT.P -A New Upside Opportunity with the Cup and Handle Hey everyone,
Today’s analysis is for #SUSDT.P. We’ve got a solid Cup and Handle formation here, and I believe it’s set to play out well. The ideal long entry zone is between 0.53-0.56, with short-term targets at 0.60 and longer-term targets at 0.66.
Just like our BINANCE:REDUSDT.P analysis from yesterday, I’m rooting for this one to hit its targets quickly. Wishing you all a green-filled day ahead!
What do you think of my analysis? Let’s meet in the comments and discuss!
Manage your risk, stay in the game! 🎯🔥
#AlyAnaliz #TradeSmart #CryptoVision #SUSDT

S (Ex FTM) UpdateS has formed a mini bearish flag which will push S towards down.
It's target also lined up with an Orderblock left behind.
Reasonable entry would be 0.4760

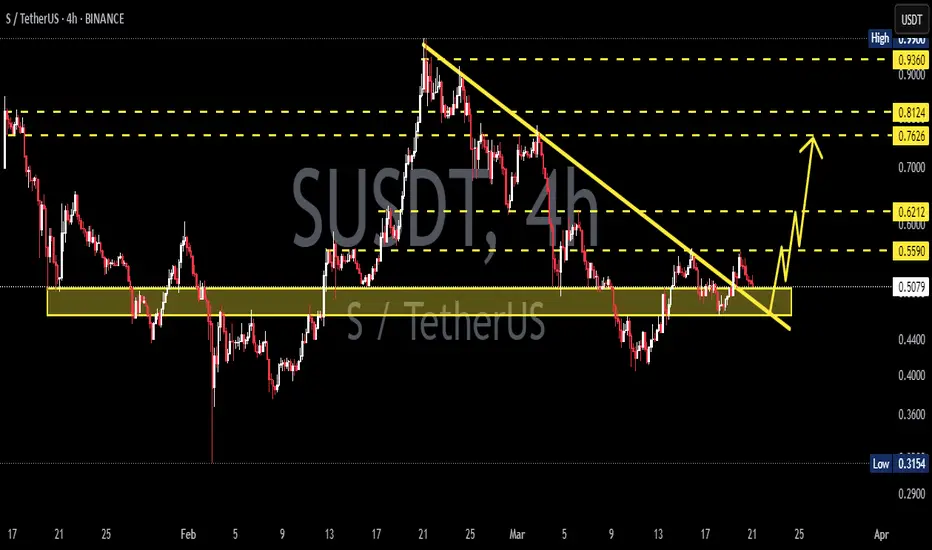
S (The Ex FTM) Has Formed a Bull Pattern and in Wave 3In short time frame the S, AKA "Ex FTM" has formed a Cup&Handle pattern. The breakout has already copleted. If it can stay above the invalidation level, S can reach the level 0.62 easily.
For a better perspective for long term, S also completed it's Bearish A-B-C waves and seems bullish again.
Good Luck.

S (Ex FTM) Next MoveAt the moment, S is going in a parallel channel through upwards. Either right from around here or from a lower demand zone, S will be going through 0,63 level.
It's a low risk trade and might be usefull.
Below the are 0.58 which is marked on the chart might be dangerous and would be a usefull stoploss.
If you can follow the chart in low time frame wait for a 4 hour candle close before stop the position if it reaches the invalidation level.


S Trade Setup - Waiting for Retrace to SupportS has had a strong rally over the last two weeks and is now at resistance. We’re waiting for a retrace to the next support level before entering a long spot trade.
🛠 Trade Details:
Entry: Around $0.55
Take Profit Targets:
$0.62 (First Target)
$0.74 - $0.80 (Mid Target)
$0.91 - $0.98 (Extended Target)
Stop Loss: Just below $0.48
We'll be watching for confirmation of support before executing the trade! 📈🔥

S/USDT: FALLING WEDGE BREAKOUT!! 🚀 Hey Traders! SONIC Breakout Alert – ATH Incoming? 👀🔥
If you’re excited for this setup, smash that 👍 and hit Follow for premium trade ideas that actually deliver! 💹🔥
🔥 SONIC/USDT – Breakout & Retest in Play! 🚀
SONIC is breaking out of a falling wedge on the 4H timeframe and is currently retesting the breakout level. With momentum building, we’re expecting a move toward ATH soon.
💰 Trade Setup:
📍 Entry: CMP, add more up to $0.50
🎯 Targets: $0.56 / $0.62 / $0.69 / $0.78 / $0.85 / $0.96
🛑 Stop-Loss: $0.46
⚡ Leverage: Low (Max 5x)
🔎 Strategy:
Enter with low leverage now
Add more on dips and ride the wave higher
💬 What’s Your Take?
Are you bullish on SONIC’s breakout? Share your analysis, predictions, and strategies in the comments! Let’s lock in those gains and ride this pump together! 💰🚀🔥

SUSDT 4HS ~ 4H Analysis
#S Buy from here if you only have a Conviction on this coin with a short -term target of at least 10%+.
Bulls in Trouble! Sonic Rejected Again—Lower Lows Incoming?Yello, Paradisers! Is #Sonic about to take another dive? The latest price action suggests trouble for the bulls. After failing to reclaim key support, the downtrend is back in full force.
💎#SUSDT continues to reject from a historically strong resistance at $0.63 – $0.65, a level that has repeatedly proven difficult to break. This latest rejection is only accelerating the downside, putting lower targets into play.
💎The sellers are initially aiming for the $0.46 – $0.44 levels, a strong support zone where we could see some short-covering as traders take profits on their positions. This level has provided temporary relief in the past, making it a key area to watch.
💎However, if sellers maintain control and the bearish momentum continues, the price could dip even further into the $0.3850 – $0.3740 zone. This area has historically acted as a strong support base, attracting significant buying pressure that could fuel a potential reversal.
💎For bulls to regain control, they must reclaim the $0.63 – $0.65 zone, a strong resistance level. However, with descending resistance reinforcing this area, breaking out won’t be easy. Until then, the trend remains bearish, and lower levels are in play.
Stay patient, Paradisers! The market always rewards discipline. If we see confirmation, we take action. If not, we wait. Trade smart, not fast! 🎖
MyCryptoParadise
iFeel the success 🌴

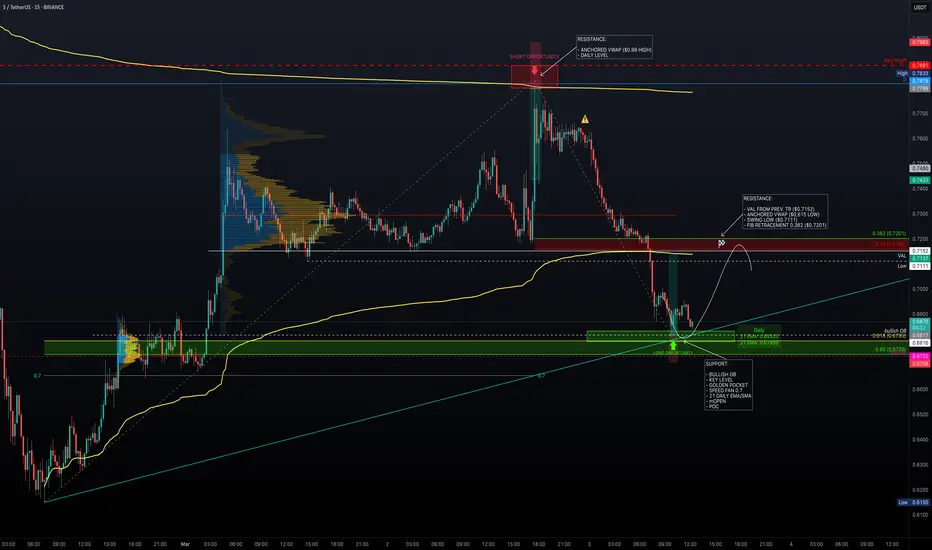
Major Levels – Is Sonic Ready to Pump?After reaching the daily resistance level ($0.7818), price faced strong rejection. The anchored VWAP, acting as dynamic resistance just below the daily level, provided additional confluence for a low-risk short opportunity.
Additionally, a key high at $0.7891 further reinforced this resistance zone. Following the rejection, price sharply declined -13%, retracing back into the previous trading range.
Support Confluence
Price is now approaching a well-defined support zone:
Bullish Order Block: $0.6816
Key Level Near Order Block: $0.6803
Golden Pocket (Fib 0.618 - 0.65): 0.618 at $0.6793 & 0.65 at $0.6739
Monthly Open: $0.6732
Point of Control (POC): $0.6732 (aligning with Monthly Open)
Daily 21 EMA/SMA: 21 EMA at $0.6835 & 21 SMA at $0.6790
Fib Speed Fan 0.7 (from $0.615 to $0.7818): Providing additional support in this zone
Long Trade Setup
Entry Zone: $0.6816 – $0.6732
Stop Loss: Below the Monthly Open ($0.6732)
Take Profit Zone: $0.7111 – $0.7201
Risk-to-Reward (R:R): 3:1 R:R setup, offering a high-probability trade
Take Profit Targets & Resistance Zones
Previous Swing Low: $0.7111 (untested)
Value Area Low (VAL): $0.7152
Anchored VWAP (from $0.615 low): $0.7137
Fib Retracement 0.382 (from $0.7818 high to current low): $0.7201
SUSDT BULISHThe market has been in a bad situation following the Bybit stolen coins incident. However, I can see that SUSDT may turn bullish now.
Please pay close attention to the danger zone and stop loss.
Note: My ideas are not intended for any type of scalping or scalpers!
You can find the full list of my ideas here: www.tradingview.com
Here are some of my ideas:


Bearish on S (Binance Futures)1. We have price trading premium levels
2. We have price rejecting off the H1 breaker embed FVG
3. We have draws as the target 1 OB+
4. Wick on daily chart purged as well

Bitcoin and altcoin overview (February 18-19)Yesterday, Bitcoin tested the key buyer zone at $94,000–$93,000 (volume anomalies) and has already shown an initial reaction.
At the moment, buyers appear stronger. When testing $95,000 from the other side, the buyer absorbed a strong selling bar. If the price consolidates above $96,000, it will confirm their intentions.
On a global scale, a full reversal setup has not yet formed. For a more conservative approach, it’s better to wait for clearer buyer aggression and join longs on a retest.
Sell Zone:
$107,000–$109,000 (volume anomalies).
Buy Zones:
Around $95,000 (absorption of selling pressure).
$89,000–$86,300 (accumulated volumes).
Interesting Altcoins:
For SUSDT , we expect a continuation of the long setup. Looking to go long upon testing the $0.60–$0.58 and $0.555–$0.54 zones, provided there is a strong reaction from buyers.

SUSDT Key Resistance Broken – Bullish Momentum SUSDT has recently broken through a key resistance level, signaling a shift in market sentiment and the potential for a strong upward movement. Breaking past major resistance is a crucial technical event that often leads to a new phase of price action, and for sUSDT, this breakout has been accompanied by good volume, confirming the strength of the move. With strong investor interest and an expected gain of 25% to 30%+, traders are now watching closely to see how the price behaves as it continues to test new highs. The breakout above resistance sets the stage for further bullish movement, potentially attracting more buyers into the market.
The breakout from the main resistance level is a key indicator that the sellers' control has been broken, and buyers are now in charge. As the price holds above this key level, it’s likely that more traders will enter, pushing the price higher. The good volume supporting the breakout further validates that this move has solid momentum, and the chances of a sustained rally are increasing. If sUSDT continues its upward trajectory, it could reach the projected gain range of 25% to 30%+, with new resistance levels providing the next potential targets.
Investors are taking increasing interest in sUSDT as the price breaks above important technical levels. This shift in market sentiment is not only supported by the price action but also by the growing participation from investors who see potential for further gains. The volume confirms that this is not a false breakout, and as more traders recognize the bullish setup, the price could continue to rise steadily. With solid technical backing and a growing interest in the project, sUSDT is positioning itself as a strong candidate for higher returns in the near term.
Traders should monitor key support levels to ensure that the breakout holds. If sUSDT can maintain its position above the broken resistance level, it could continue to gain momentum, offering a potential 25% to 30%+ return. As always, staying updated on broader market conditions and volume trends will help confirm the strength of the breakout. Given the current setup, sUSDT presents an exciting opportunity for traders looking to capitalize on a potential upward trend in the near future.

SUSDTI expect the correction to continue until the specified range From the demand area, with structural changes, we can expect to move towards 0.6

SUSDT buy/long setup (4H)It seems that a lot of orders have accumulated at the lower levels. We have a bullish iCH on the chart, and the trigger line has been broken. The price is now near a supply zone. If it bounces from the green area, we can look for buy/long positions.
Targets are marked on the chart.
A daily candle closing below the invalidation level will invalidate this analysis.
For risk management, please don't forget stop loss and capital management
Comment if you have any questions
Thank You

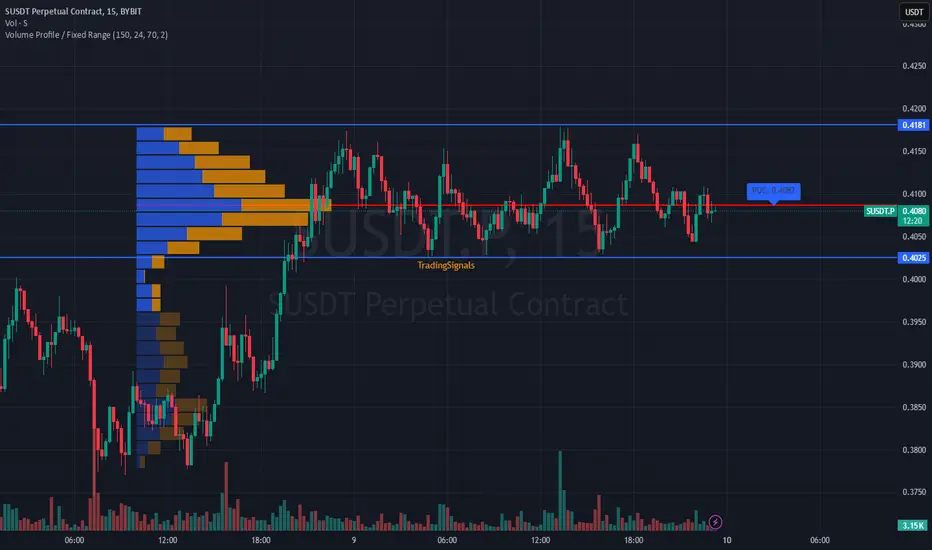
Analysis of #SUSDT – Watching for a Breakout📊 Analysis of BYBIT:SUSDT.P – Watching for a Breakout
15M TF
✅ Overview:
➡️ BYBIT:SUSDT.P is trading within a range, consolidating between $0.4025 (support) and $0.4181 (resistance).
➡️ POC (Point of Control) at $0.4087 represents the highest liquidity area, making it a key level where price could decide its next move.
➡️ A breakdown below $0.4025 could lead to further downside, as there is little strong support below this level.
➡️ If the price holds above $0.4181, we could see a push toward higher resistance levels.
⚡ Plan of Action:
📈 Bullish Scenario:
➡️ If price holds above $0.4087 (POC) and breaks $0.4181, an upward move is expected with increased momentum.
📉 Bearish Scenario:
➡️ If price drops below $0.4087 and breaks $0.4025, expect accelerated downside movement.
🚀 BYBIT:SUSDT.P is in a consolidation phase – preparing for a breakout!
📢 BYBIT:SUSDT.P is in an accumulation phase, and a breakout of key levels will determine the next trend.
📢 Watch volume closely – an increase on a breakout will confirm a stronger move.
(Prev. FTM) Support and Resistance Zone: 0.4126-0.4930
Hello, traders.
If you "Follow", you can always get new information quickly.
Please click "Boost".
Have a nice day today.
-------------------------------------
(SUSDT 1D Chart)
FTM Coin (Token) has been changed to Sonic Coin (Token).
Since the chart was newly created on January 16, the support and resistance role may be weak, so be careful when trading.
-
(12h chart)
Since the indicator has not been created yet on the 1D chart, support and resistance points are not displayed, so the 12h chart was used.
The point of interest is whether it can rise above the Fibonacci ratio of 0.236 (0.5815) ~ 0 (0.6565).
To do so, it is important to see whether it can receive support near the BW (0) indicator point of 0.4126 and rise above 0.4930.
If it falls below 0.4126, it is likely to fall to around the Fibonacci ratio of 1 (0.3385).
Therefore, if it shows support in the low boundary zone of 0.4126-0.4930, it is a time to buy.
-
The MS-Signal indicator is an indicator that can tell the trend.
Therefore, if the price stays above the MS-Signal indicator, there is a high possibility that it will turn into an uptrend.
-
Thank you for reading to the end.
I hope you have a successful trade.
--------------------------------------------------
- Big picture
I used TradingView's INDEX chart to check the entire range of BTC.
(BTCUSD 12M chart)
Looking at the big picture, it seems that it has been maintaining an uptrend following a pattern since 2015.
In other words, it is a pattern that maintains a 3-year uptrend and faces a 1-year downtrend.
Accordingly, the uptrend is expected to continue until 2025.
-
(LOG chart)
Looking at the LOG chart, you can see that the uptrend is decreasing.
Accordingly, the 46K-48K range is expected to be a very important support and resistance range from a long-term perspective.
Therefore, it is expected that prices below 44K-48K will not be seen in the future.
-
The Fibonacci ratio on the left is the Fibonacci ratio of the uptrend that started in 2015.
In other words, it is the Fibonacci ratio of the first wave of the uptrend.
The Fibonacci ratio on the right is the Fibonacci ratio of the uptrend that started in 2019.
Therefore, it is expected that this Fibonacci ratio will be used until 2026.
-
No matter what anyone says, the chart has already been created and is already moving.
It is up to you how to view and respond to this.
If the ATH is renewed, there are no support and resistance points, so the Fibonacci ratio can be appropriately utilized.
However, although the Fibonacci ratio is useful for chart analysis, it is ambiguous to use it as support and resistance.
The reason is that the user must directly select the important selection points required to generate Fibonacci.
Therefore, since it is expressed differently depending on how the user specifies the selection points, it can be useful for chart analysis, but it can be seen as ambiguous to use it for trading strategies.
1st: 44234.54
2nd: 61383.23
3rd: 89126.41
101875.70-106275.10 (when overshooting)
4th: 134018.28
151166.97-157451.83 (when overshooting)
5th: 178910.15
-----------------

