Sushi 🍣At the time of analysis, the conditions were very good for growth
Now has reached 40% profit
It has tough resistance in this area
By creating a positive atmosphere in the market, it is possible to break this resistance
Otherwise, It may fit in these prices
And start regrowth by gaining energy
Reaches the next target in the coming days
Sushi
SUSHIUP Binance BUY at $0.089Like what I see on the weekly chart of the underlying asset (SUSHI) so I opened a trade in Binance yesterday. Bought the SUSHIUP contract at $0.089. Let's see how it goes!
SUSHI/USDT AnalysisSUSHI / USDT
price is retesting the upper resistance of the accumulation zone for past 2 months
Which can indicate bulls want to push price higher
The best entery for alts when BTC is pullingback / rebounce
As long as sushi holding this resistance as support is good for more push upward
Make sure you have your own plan before buying and selling
Best of luck
sushi 8 august 2021tracing support lines to localize bounce-off areas. for a scaled entry.
sushi was last season the best performer in the early weeks along with aave, recording 96% growth in 6 weeks. perhaps not as explosive as many others, but, considering the market cap, very good opportunity on leverage. very volatile, with some large bag holders. prone to exploits due to TVL, but part of yearn ecosystem which factor should not be underestimated.
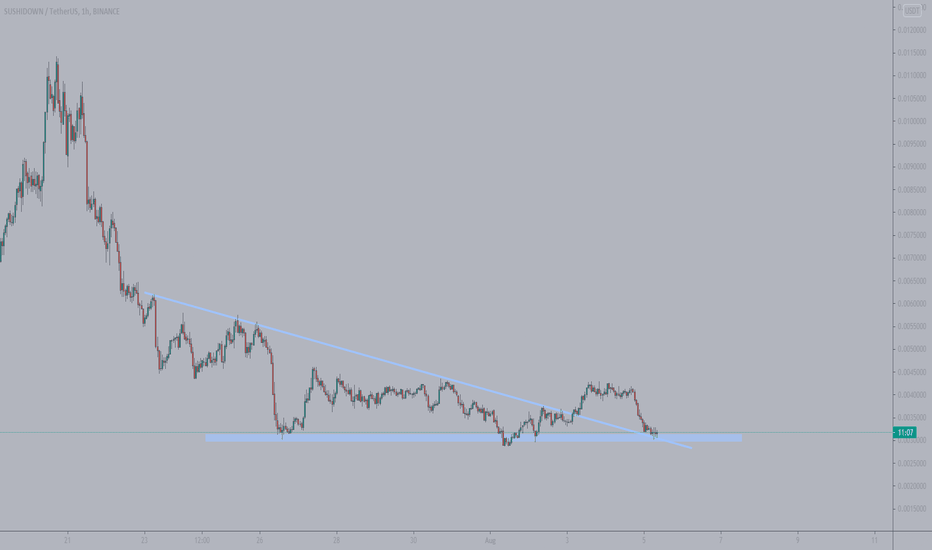
BUY SUSHIDOWNBuy: 0.003 - 0.00325
Stop Loss: 0.0028
Reason: retest of trendline and proprietary buy signal
SUSHIAlthough sushi just pumped pretty hard, it may be due for another one if btc continues its uptrend.
Trend is testing resistance multiple times, trend has also been accumulating on current support at 7.82 against resistance at 9.58. Overall trend is still in an uptrend as shown.
its funny cause alot of alts across the board all look bullish and prime for another move up.
Most definitely keeping an eye on SUSHI as well.
🆓SushiSwap (SUSHI) July-31 #SUSHI $SUSHISUSHI continues to be budged at $9 but selling is decreasing and $7.50 is a good support so we can expect a strong rally to $9 and $12 within a few days. next. However, if SUSHI loses the $7.5 zone, we have only 1 support left at the $6 zone
📈BUY
🔴Buy : 7.3-7.7$. SL if B
🔴Buy : 8.8-9.2$ if A. SL if B
📉SELL
🔴Sell : 8.8-9.2$. SL if A
🔴Sell : 11.7-12.3$. SL if A
♻️BACK-UP
🔵Sell : 7.3-7.7$ if B. SL if A
🔵Buy : 5.85-6.15$. SL if B
❓Details
🕯Timeframe : 1 Day
📈Red Arrow : Main Direction as BUY and SELL section
📉Blue Arrow : Back-Up Direction as BACK-UP section
🟩Green zone : Support zone as BUY section
🟥Red zone : Resistance zone as SELL section
🅰️A : The Close price of candlestick is Above the zone
🅱️B : The Close price of candlestick is Below the zone
Sushi Prints Massive Descending Triangle Pattern-SUSHI dropped nearly -25% the last week
-Price is hanging on to major support zone
-250MA has held price down for 2 months
Sushi-swap was full of hype a few months ago as the interest in using a decentralized swap skyrocketed. Price also followed as it rose nearly 5000% in a short 5 month period. Price started to turn around as BTC was flattening out around $60,000. Ever since then, SUSHI along with the majority of the cryptocurrency market has been in a strong downtrend. A newly formed price pattern may give a hint of when the next trend may begin.
Sushi has formed a near 2 month long descending triangle which is shown in light green. This pattern is generally a bearish one but does sometimes break to the upside. At the time of writing, Sushi is hanging on to its last major support zone at $6.00-$6.55. If bulls fail to hold this mark, sushi will fall hard. At that point, price would have broken to the downside of its descending triangle and would likely visit levels of $5.57 & $4.88.
Sushi-swap has nearly 9 days until the very end of its descending triangle formation. For a bullish breakout to occur, Sushi must first break & hold the major resistance found at $7.11. If this is deemed successful, price will then retreat to next major resistance at $7.76. This is where bulls must battle hard as the 250 MA also lies right near this resistance. As this MA has held price down for 2 months, breaking & holding above this mark will likely send Sushi to its major resistance zone near $10.00.
While looking at the Relative Strength Index, we can conclude the RSI is having a hard time at staying above the 50 value. Anything above this value is considered bullish and it must hold above this to see a strong revival. The Stochastic RSI is hanging out in oversold levels. This is the area where the largest price drops occur so strength must bounce above 20 very soon or Sushi is in for another tumble.
Sushi intraday levels
Spot rate: $6.67
Trend: Bearish
Volatility: High
Support: $6.57
Resistance: $7.10


