SUSHI/USDT 300% Potential from here as per chart analysis#SUSHI/USDT TA Update:-
$SUSHI currently trading at $13
And bounced back from $10
I am expecting big breakout in coming days.
And Target will be $50
Need to break upward $14
Accumulation zone:- $10-$13
Targets:- $19.8/$23.3/$30/$45
Stop Loss:- below $10 exit point
Support:- $10/$6
Resistance:- $14/$19/$23
SUSHIUSD

$sushi- still 50% ST upsideJust mapping $sushi call for reference. Hit very HTF support level . Price didn't even sneeze at the LTC/walmart 'fake news' selloff.

SUSHIUSDT Reversing from the major support!SUSHIUSDT (Day Chart) Technical analysis
Reversing from the major support!
SUSHI/USDT(4H Chart) Currently trading at $10.75
Buy level : $10.50 - $10.75
Stop loss: Below $9.40
TP1: $11.80
TP2: $13.50
TP3: $16.80
TP4: $20.00
Max Leverage 2x
Always Keep Stop loss

SUSHI 1D BUY & SUPPORT (LONT-TERM)SUSHI 1D support is at ~$10
Also try to set some buy orders near the support zone
If SUSHI holds above the trendline,
the Take-Profit target would be $12, $14 and $16

The sushi will definitely be pumpedThe sushi will definitely be pumped. Due to the pattern of the sushi cup, it will easily touch all the marked targets. Bitcoin conditions are favorable. Enjoy the upward trend of the market. Be profitable.

There is a potential cup and handle pattern on SUSHIUSD 4h !!In SUSHIUSD 4H
There is a potential cup and handle pattern in the chart and the price retest the downtrend line .
If the price break-out Fib 1 (14.85) and close is higher than Fib 1 (14.85).
We setup the trading plan like:
TP1: Fib 1.272~1.382(17.249~18.220)
TP2: Fib 1.618 (20.302)
TP3: Fib 2(23.673)
SL: 12.762

🟢 SUSHIUSDT 1D : #Buy_RecommendationWell, as we can see, the price has reached an important X-point, and if this range is broken, we can expect growth up to the specified limits and in this range, buying and investing is recommended.
In order to buy, the SL (stop loss) and capital management must be observed.
All resistances and TPs (take profits) are marked on the chart.
BINANCE:SUSHIUSDT
👤 Arman Shaban
⚠️(DYOR)

Sushi UpdateNailed Sushi waves this summer but don't really have to be a genius. Set up was clear and easy to play. Now however, I prefer the sidelines and want to see a solid base built up around $12 for a chance to run to $20. If you think it will run, the time to add is now. I still want to see $20 but nobody cares what I want.
I am out of Sushi as of yesterday. However, if I like what I see I will get back in with tight stop losses in place. I like the repeat of the W pattern so if it holds - I am adding. If not, I am ok with good old American currency.
Side note: there are 11K+ tokens, coins, imaginary mediums of exchange and so on. Bitcoin dominance is loosing steam...why? Well you have 11k of other coins that compete. Scarcity is not the reason BTC goes up, make sure you understand the narrative you subscribe to. I am a gambler, not a macro thinker so gamble at your own risk when you read these pajama pants trader posts.
As my friend says "You are just as imaginary and worthless as Bitcoin". Have fun staying rich if you are in it.
I think we are going into a shake out stage of the crypto market and every dip should be bought.

SUSHI/USD looking good to me... Hay All Traders,
I'm not a financial advisor, Don't buy or sell bass on what I'm saying... PLEASE DO YOUR OWN HOMEWORK. THIS POST IS JUST FOR INFO ONLY... At this time, I do own a small amount of this coin!
I'm looking at the daily chart and putting on my version of the RSI, and yes, it has a lower lowered, but it's still hodling the overall trend. With my version of MACD, it's still red, but I'm looking at the bars at the top, it's popping out of the "Linear Regression," my look back is the last 100 days and 10 days, and I'm using Linear Regression as support and resistance.
And looking at the 1H chart, it looks even better to me!

SUSHI MOVES UPwe see price how reacts to Fibo channels and now it is in a bullish channel . TP1 is shown at chart and TP2 will be Num.2 of Fibo channel .

SUSHI Consolidates Within Ascending Channel, Bulls Eye Break -SUSHI has risen over 30% the last week
-Price has been respecting an ascending channel
-75MA will act as support if necessary
Sushi Swap experienced great hype in the earlier months of this year but has since fallen a bit under the radar. Its main competitor, Uniswap, has still been holding well throughout the market as platform visits have been increasing over the last month. Since BTC has broken out of its $40,000 resistance, many alt coins have been surging off their lows. SUSHI has been attempting to break free from a major resistance zone over the last 3 days but has fallen short. If BTC can gain its footing soon we should see SUSHI above $15 in no time.
Since the 20th of July, Sushi Swap has been in a healthy uptrend. Price has been supported within an ascending channel as each time price touches either trend, it gets rejected to the opposite trend. For SUSHI to experience a strong breakout, price must break & confirm its major resistance zone found from $13.39-$14.24. If bulls manage to pull this off, we should expect price to rise to at least $15.59 & potentially $16.58. If price manages to break & hold the top trend of the channel, SUSHI will go parabolic.
At the time of writing, SUSHI is holding the median line of the channel. If at any point bears assert their dominance & Sushi breaks below this trend, we should expect price to fall to the bottom trend of the channel. Along with this median line lies a near 3 month trend line that has held price down from a bullish trend. Just 2 days ago, bulls managed to break this trend line and have since been able to hold. Breaking both of these trends will likely result in a minimum -5% downfall. In this case, Sushi Swap will likely find support at $10.63.
While looking at the Stochastic RSI, we can see how strength reset to the oversold territory. As long as strength manages to break out of this zone, this is a good sign that SUSHI is regaining strength for its next upward push. The RSI has been hanging out above the 50 value for nearly 9 days. A strong push into the overbought territory is needed for SUSHI to break out of its major resistance zone. If at any time strength breaks below the given trend line, expect price to start some type of downtrend.
SUSHI Intraday Analysis
Spot rate: $12.85
Trend: Bullish
Volatility: High
Support: $12.02
Resistance: $13.39

SUSHIUSDT Breakout! Did you take this trade?My potential take profit levels are 12.622(0.382), 13.438(strong resistance), and the least possible one at 14.684(0.5)

SUSHIAlthough sushi just pumped pretty hard, it may be due for another one if btc continues its uptrend.
Trend is testing resistance multiple times, trend has also been accumulating on current support at 7.82 against resistance at 9.58. Overall trend is still in an uptrend as shown.
its funny cause alot of alts across the board all look bullish and prime for another move up.
Most definitely keeping an eye on SUSHI as well.

SUSHIUSD: 700% gains BEST level TO BUY/HOLD(SL/TP)(SWING)Why get subbed to me on Tradingview?
-TOP author on TradingView
-2000+ ideas published
-15+ years experience in markets
-Professional chart break downs
-Supply/Demand Zones
-TD9 counts / combo review
-Key S/R levels
-No junk on my charts
-Frequent updates
-Covering FX/crypto/US stocks
-before/after analysis
-24/7 uptime so constant updates
🎁Please hit the like button and
🎁Leave a comment to support our team!
SUSHIUSD: 700% gains BEST level TO BUY/HOLD(SL/TP)(SWING)
IMPORTANT NOTE: speculative setup. do your own
due dill. use STOP LOSS. don't overleverage.
previously recommended buying low.
🔸 Summary and potential trade setup
::: SUSHIUSD 2daily chart review
::: accumulation in progress now
::: BULL flagging - strong chart
::: final pullback likely
::: BUY LOW later after pullback
::: 700% gains is not a typo
::: already BROKE OUT
::: MARKET BUY NOW / 700% upside
::: LONG RANGE OUTLOOKS
::: this is not for short-term traders
::: accumulation NOT COMPLETE YET
::: 1000%+ gains still possible
::: currently trading near range highs
::: BUY/HOLD setup TP +700%
::: previously recommended buying low
::: up to 1000% gains possible later
::: SPECULATIVE SETUP
::: do your own due dill
::: and use proper risk management
::: TP bulls is +700% gains
::: details: see chart
::: SWING TRADE: BUY/HOLD IT
::: bull run not over yet
::: good luck traders!
::: BUY/HOLD and get paid. period.
🔸 Supply/Demand Zones
::: N/A
::: N/A
🔸 Other noteworthy technicals/fundies
::: TD9 /Combo update: N/A
::: Sentiment mid-term: BULLS
::: Sentiment short-term: PULLBACK/RANGE LOWS
RISK DISCLAIMER:
Trading Crypto, Futures , Forex, CFDs and Stocks involves a risk of loss.
Please consider carefully if such trading is appropriate for you.
Past performance is not indicative of future results.

SUSHI Breakout Target $17.31SUSHI just broke out of this massive multi-month consolidation triangle and has a price target of $17.31. That's more than a 2x from here. Don't miss out on these crazy gains!

Sushi Prints Massive Descending Triangle Pattern-SUSHI dropped nearly -25% the last week
-Price is hanging on to major support zone
-250MA has held price down for 2 months
Sushi-swap was full of hype a few months ago as the interest in using a decentralized swap skyrocketed. Price also followed as it rose nearly 5000% in a short 5 month period. Price started to turn around as BTC was flattening out around $60,000. Ever since then, SUSHI along with the majority of the cryptocurrency market has been in a strong downtrend. A newly formed price pattern may give a hint of when the next trend may begin.
Sushi has formed a near 2 month long descending triangle which is shown in light green. This pattern is generally a bearish one but does sometimes break to the upside. At the time of writing, Sushi is hanging on to its last major support zone at $6.00-$6.55. If bulls fail to hold this mark, sushi will fall hard. At that point, price would have broken to the downside of its descending triangle and would likely visit levels of $5.57 & $4.88.
Sushi-swap has nearly 9 days until the very end of its descending triangle formation. For a bullish breakout to occur, Sushi must first break & hold the major resistance found at $7.11. If this is deemed successful, price will then retreat to next major resistance at $7.76. This is where bulls must battle hard as the 250 MA also lies right near this resistance. As this MA has held price down for 2 months, breaking & holding above this mark will likely send Sushi to its major resistance zone near $10.00.
While looking at the Relative Strength Index, we can conclude the RSI is having a hard time at staying above the 50 value. Anything above this value is considered bullish and it must hold above this to see a strong revival. The Stochastic RSI is hanging out in oversold levels. This is the area where the largest price drops occur so strength must bounce above 20 very soon or Sushi is in for another tumble.
Sushi intraday levels
Spot rate: $6.67
Trend: Bearish
Volatility: High
Support: $6.57
Resistance: $7.10

SUSHI - undervaluedPerfect accumulation/bottoming out set up. Will not happen overnight but looks ready to me.

AAVE LONG TRADE 20210711Signals: Blue -> Green
AAVE, AAVEUSD,AAVEUSDT,AAVEUSDTP, CRYPTO,CRYPTOCURRENCY
DISCLAIMER
This is only a personal opinion and does NOT serve as investing NOR trading advice.
Please make your own decisions and be responsible for your own investing and trading Activities.

SUSHI LONG 20210711Signal:
Blue -> Green
Red -> Green
SUSHI, SUSHISWAP, SUSHIUSD , SUSHIUSDT , SUSHIUSDTP, CRYPTO, CRYPTOCURRENCY
DISCLAIMER
This is only a personal opinion and does NOT serve as investing NOR trading advice.
Please make your own decisions and be responsible for your own investing and trading Activities.

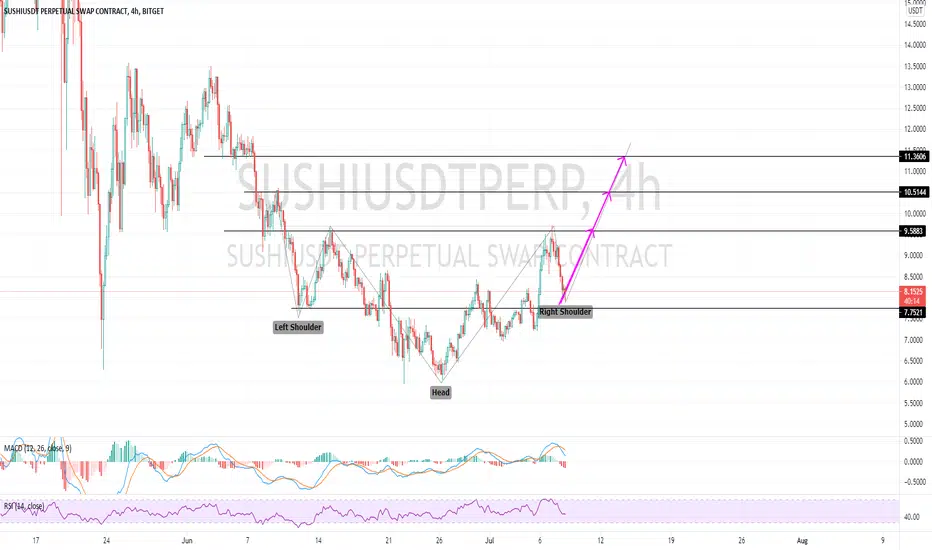
$SUSHIUSDT - Inverted head and shouldersHello everyone!
Looking to long Sushi here as seems like there is an Inverted Head and Shoulders being formed.
Good luck!
50EMA is holding, for how long ?#SUSHI/USD TA Update:-
$SUSHI is currently trading at $8.15
SUSHI is still in his ascending channel and 50EMA is holding in 4h chart.
We can see a retest at 7.75 before a rebound. If not, it can also retest the previous support that he broke july 4th around 6.74.
I am watching for now.
Please click LIKE button and Appreciate my hard work.
Must follow me for latest crypto real time updates.
Thank you.

(Update) SUSHI is still in a falling wedgeHi every one
SUSHI/USDT
SUSHI/USDT is still in a falling wedge.but there is a regular bullish divergence on MACD (+RD) which means a huge pump can happen to this currency. We just have to wait for confirmation (upward breakout).
Previous Analysis
Traders, if you liked this idea or have your opinion on it, write in the comments, We will be glad.
Things can change...
The markets are always changing and even with all these signals, the market changes tend to be strong and fast!!
Thank you for seeing idea .
Have a nice day and Good luck

SUSHI ENTRY, TARGETS, & STOP-LOSSSee my chart for my BINANCE:SUSHIUSDT entry, targets, and stop-loss.
