SUSHI/USD this chart its so simple I'm not typing anything for it just leaving ............................................................................................................................................................................................................................................................................................
Sushiusdt

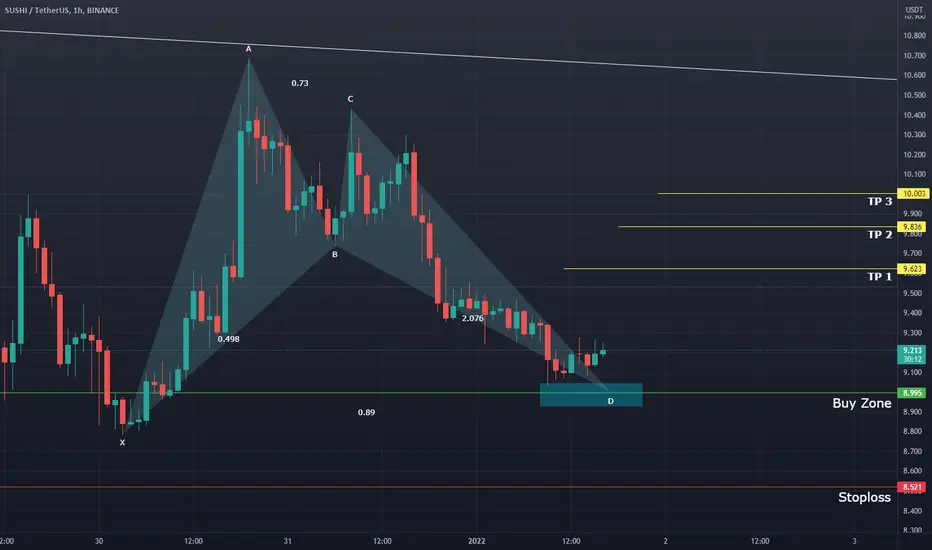
SUSHI SETUP FOR THE NEXT WEEKI'm waiting sushi retracement to the buy area, sushi price target is $10 in short term, this setup is for the next week, we should not trade on weekend, I expect sideways and low volatility on weekend


SUSHIUSDT LONG entry 7.35
stoploss 6.8
target 8++
always dyor and happy profit
becarefull market can bleed anytime

SUSHI: Long and ShortSummary:
1. SUSHI seems relatively strong in this downturn.
2. Several converging points seem to suggest a Long for SUSHI to the green rectangle.
3. A short can also be placed to hedge with a target to the red rectangle.
Chart: Daily
Scale: Linear
Trading Pair: SUSHI/USDT
Breakdown:
- Price broke above the upper parallel line of the red Pitchfork.
- This retrace came back to retest the upper parallel line of the red Pitchfork.
- A single negative vector extrapolation intersects at the projected reversal point (yellow box) adding confluence to the idea of a reversal to the upside here.
- Price is sitting slightly above an inner frequency line that did not break on this retrace.
- There is sloped (same slope as the pitchfork) inner frequency line in the counter trend pitchfork (green) that also intersects the reversal zone (yellow box).
- Lastly, the Hagopian's Rule seems to be in play as well with the failure of price to reach the center median line in the red Pitchfork.


SUSHI in a very bullish wedgeThere isn't much to say, all DeFi are about to wake up after a long free fall. VLPR shows the bottom of this huge falling wedge has been bought (up until 3 weeks ago) and now price is heading toward another test of the upper trendline. In general this pattern looks so neat that I'm personally very bullish, I wish I had more fiat to buy it right now.
One advice, this could even take another dip before breaking out so DCA your entry, I'd enter with something between 10-15% right now because it's uncertain. For sure eventually this will break out!
Good luck!

SUSHI, SUPPORT COMING SOON !!!Sushi may be supported somewhere around 6.75 .
Stay tuned for updates please.
-Thanks-

SUSHI-USDT PREPETUALkeep an eye on 9.43, if it Breaks and waits for the confirmation candle, then Enter a LONG POSITION with 10X.
Not a Financial Advice.

sushiusdt buy and hold for short term sushi is in a good position and there is a lot of volumes expected in the short term sushi will fly buy and sell targets are on chart buy as per mention and hold for all targets
if you like my idea please like and share


sushi backtestnot financial advice just my backtest
use stoplose if you want to try
have a nice day!

Sushi/usdtSushi/usdt
4 hour time frame
formed bullish Bat pattern
in 4 hour RSI bullish
in daily time frame rsi is bearish
we can see upward for short time frame
Dyor
NFA
SUSHI LTF 4h correction?Seems like the bearish divergence on 4h chart is playing out.
The EMA 21 support did not hold.
Overall SUSHI did 100% with little to no correction so I think 30% corrective move is healthy with making HL and continuing with the uptrend.
If we do not make HL and make LL instead or lose $7.5-$8 support, there is a high chance we are gonna revisit the HTF range low (around $6) --> Check out my related idea on why was sushi currently pumping from the HTF pov.

SushiAs we see it's time to long on Sushi its on critical area and broke its 1H trend line as i draw on chart(white line) and its finishing pullback then go up to TP1 , you should keep SL so tight because of powerful daily downtrend line( Red line ).

SUSHI could deliver fireworksOne last thing for this year: SUSHI might deliver fireworks if it can get past resistance. Next stop would be 13.5

Sushi pumping, why?HTF perspective --> sushi hits range low --> pumps towards mid range or range high
It is still in the huge downtrend, so far playing the range --> 3 possible scenarios ?
IMO we hit the mid range, after that, keep an eye for a while to decide which direction we go

SUSHI ANALYSISHere quick look
Sushi made a 10.6$ high and now coming back .
It having a support zone 8.8$ and 7.97$ from there sus hi bounce to 12.370$,14.266$ targets
All we need to break a descending triangle
thank you

Sushi waiting till the new yearSushi looking for a price of 10.41 on January 4 before making a move on outer edge of that gain circle around 12:24 on January 6/22....... on the 144m chart

$SUSHI, UCTS printed a 1D Buy signal while testing ~7.2$ area $SUSHI /USD
UCTS printed a 1D Buy signal while testing ~7.2$ area that I identify as a resistance
Volume also looking strong, lets see if it can show continuation..
If manage to hodl/flip, then looking to ~8.6$ as next important level to watch
#SUSHI

SUSHIUSDT-SHORTThere is a short position in SUSHIUSDT Sushi
SUSHIUSDT Sushi
🔴Short Now or set on Key Level 9.830
🟢Target 1 8.630
🟢Target 2 7.770
❌Stop loss 10.260
#K_Level
Please support our activity with your likes and comments.

SUSHI SWAP Daily TA : 12.29.21 : $SUSHIAs we can see, if the price can break this important range of X-Point resistance, we can expect growth to the levels indicated on the chart.
Follow our other analysis & Feel free to ask any questions you have, we are here to help.
⚠️ This Analysis will be updated ...
👤 Arman Shaban : @ArmanShabanTrading
📅 29.DEC.2021
⚠️(DYOR)
❤️ If you apperciate my work , Please like and comment , It Keeps me motivated to do better ❤️

SUSHI/USDT ChartHi, I try to post often so if you could follow, like and comment your thoughts it would mean a lot.
SUSHI had a good run in the past week, and after having a run from the 5.10$ range to 10$ today I think that the coin will have a correction now.
In the 4H chart we can see a bearish divergence showing up recently so we have a very nice short set-up in the short/mid term. I can't speak about the long term but in the short term I'm preety sure that we will have a correction. A good target would be around the 8.50$ support.
Another bearish factor for altcoins is the fact that BTC just brokedown the 48K zone and the market isn't showing that strenght and confirmation that we need to resume the BTC uptrend. Thanks for your attention and good luck on your trades.
