Swedbank Just Did Something It Hasn't Done in 18 Years!Hi all,
A few weeks ago, at the Estonian finance conference, I pointed out that Swedbank needs a Monthly candle close above a historically significant level to confirm further upside into "open waters".
Before I dive deeper - if someone still claims that "price has no history" or "price doesn't repeat itself," just show them Swedbank’s chart. Back in 2007, Swedbank attempted to break the 215–228 SEK level for the first time. The result? A complete failure. Sellers took control and smashed the price down.
Fast forward 7–10 years: “Let’s try again a few more times!” Still nothing. The level remained unbreakable, draining all momentum. Over the past 18 years, this zone has been tested 7–9 times, and every single attempt ended in failure.
Now, today, things are changed. Today, we have that Monthly close, and the price has now entered a potential buying zone. Technically, Swedbank is ready - optimal zone 215 to 237 SEK!
Do your homework; this is just my opinion and my analysis!
Do not forget to "Boost" the idea - all the best,
Vaido
Sweden

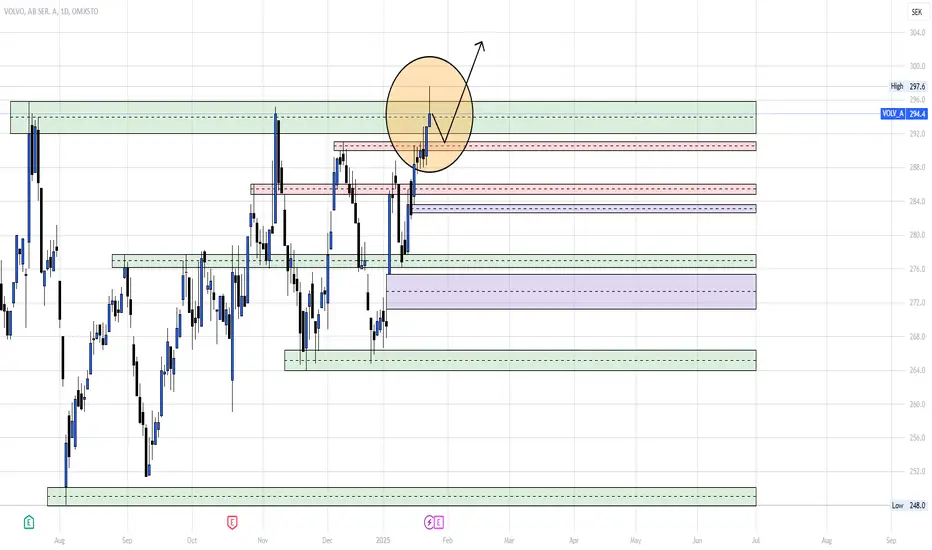
WAIT BEFORE YOU BUY VOLVOHere on Volvo, we have a long position entry, however, since the price now is stuck in a strong liquidity zone that it pulled back on for multiple times, we won't risk and enter, unless the price broke through it to make our entry the pullback on the price.
Follow for more!
BUY ATCO_AOn ATCO_A, you can see that it started going higher and higher, again after the brake it did after swipping the liquidity at 170.65, to give us a confirmation of the bullish movement.
Now for those who bought, you can watch how the price reacts in every levels in between the 1st and the 3rd target before reaching the main one which is at 220.3.
Follow for more!

BUY INVE_AOn INVE_A, you can see that the price is showing a great potential to go higher especially after the last LQ sweep we got and now it started pushing towards the level 355.0.
If you're welling to buy, or you already bought and you don't know which level exactlt to target or where to close, now you got the answer to it!
Follow for more!

AAC CLYDE SPACEaac clyde space is in a bull flag with a golden cross with 50/200 moving average. trend should be strong and target 20% up, let's go

Avanza Breakout: Analyzing the Uptrend and RetestLong-Term Trend Analysis
Since its IPO, Avanza has demonstrated a clear uptrend, consistently forming higher highs and higher lows, reflecting a strong bullish sentiment over the long term.
Recent Price Action (Weekly Timeframe)
On the weekly timeframe, a triangle pattern emerged, which has recently broken out. The price then retraced, suggesting a potential retest of the previous resistance level, which could now act as support.
Retest and Key Levels
The recent retracement appears to be a successful retest of the previous triangle pattern's resistance. This successful retest often signals a continuation of the upward trend.
Examining further, we can see that the previous triangle pattern has now become a critical area for retests, followed by strong upward reactions. This supports the idea that the recent move down was indeed a successful retest.
Fibonacci Retracement Analysis
Using the Fibonacci retracement tool, the stock's recent reversal aligns perfectly with the 0.618 level, reinforcing its significance as a key support level. This level is often considered a strong area of support in uptrends.
Outlook and Potential Patterns
After analyzing the chart for patterns and key levels, we can anticipate potential future movements. A key level has been identified, which the stock has respected multiple times. This level could play a crucial role in forming a reversal pattern.
Two scenarios could unfold:
Inverse Head and Shoulders Pattern: The stock could form an inverse head and shoulders pattern, using the key support level as its neckline.
Double Bottom Formation: Alternatively, a double bottom pattern could emerge at the key support level, signaling a strong reversal.
Trading Strategy
To capitalize on this setup:
Conservative Approach: Wait for a clear reversal pattern (like the inverse head and shoulders or double bottom) to form before entering a position. This approach minimizes risk by confirming the trend direction, set a stop loss top minimaze risk.
Aggressive Approach: If you believe the stock doesn't require a full reversal pattern, consider entering now. In this case, setting a stop loss just below the key support level is crucial to minimize potential losses.

Nordnet: The question is Breakout or Fakeout? OMXSTO:SAVE 's Position: Breakout or Fakeout?
OMXSTO:SAVE is currently at a critical juncture, having recently broken out of its long-term bullish channel. The key question now is whether this move represents a genuine breakout with a successful retest or just a fakeout.
Monthly Chart Analysis
On the monthly chart, we observe that since its IPO in 2020, Nordnet has been in a strong bullish uptrend, defined by two key trend lines. Recently, however, the stock broke through the upper boundary of this bullish channel, raising questions about its next move.
Weekly Chart Analysis
The weekly chart shows that after breaking through the upper trendline, the stock made a downward move, testing this line as a new support level. This was followed by a strong upward reaction, suggesting a potential retest and continuation of the bullish trend. However, the possibility of a fakeout remains, which could see the stock reverse back down to the long-term support level.
Daily Chart: Key Levels
On the daily timeframe, several key levels have emerged where the stock has shown significant reactions in the past. These levels—197 SEK, 217 SEK, and 230 SEK—are crucial for determining the stock's future direction. Recently, the stock bounced upward after touching one of these key levels and is currently testing another.
Support Line Identification
We can also identify a rising support line that the stock has respected, providing additional context for potential future movements.
Outlook: What's Next?
I anticipate that Nordnet may form a reversal pattern, such as a double bottom or an inverse head and shoulders, with the 217 SEK level serving as the neckline. If this scenario plays out, the stock is likely to resume its upward journey along the rising support line.
Trading Strategy
For those looking to trade this setup, consider entering a position near the long-term upper resistance line, provided there are confirmations on lower timeframes (e.g., reversal patterns, volume spikes, or indicator signals) that indicate upward momentum. If you suspect this is just a fakeout, it might be wise to wait for a clearer setup. Regardless, be sure to set a stop loss to minimize potential losses.

Atlas Copco AB: Potential Entry Points in a Long-term UptrendOMXSTO:ATCO_A has demonstrated a long-term uptrend throughout its history, marked by two strong channels, with higher highs and higher lows.
Since the Ukraine-Russian market crash, OMXSTO:ATCO_A has experienced a 100% increase. Currently, the stock is at the resistance channel, which has resulted in a notable downward reaction:
During the strong uptrend, previous resistance levels, where the price peaked, turned into support levels when the stock experienced pullbacks. Now, as the stock returns to these crucial levels, they may serve as key support, potentially causing the stock to struggle to break below them or to rebound and rise further.
I anticipate that the stock will gradually break through each of these key levels, eventually approaching the lower trendline before launching into a significant bull run. This scenario presents a promising opportunity for a long position, but we need additional bullish confirmation at these levels before making a move.
Important levels: 150 SEK, 140 SEk, 120 SEK, 100 SEK

Trade Like A Sniper - Episode 43 - USDSEK - (14th June 2024)This video is part of a video series where I backtest a specific asset using the TradingView Replay function, and perform a top-down analysis using ICT's Concepts in order to frame ONE high-probability setup. I choose a random point of time to replay, and begin to work my way down the timeframes. Trading like a sniper is not about entries with no drawdown. It is about careful planning, discipline, and taking your shot at the right time in the best of conditions.
A couple of things to note:
- I cannot see news events.
- I cannot change timeframes without affecting my bias due to higher-timeframe candles revealing its entire range.
- I cannot go to a very low timeframe due to the limit in amount of replayed candlesticks
In this session I will be analyzing USDCOP, starting from the 3-Month chart.
If you want to learn more, check out my TradingView profile.

NIBE Industries Short brewing thanks to an M FormationM Formation has clearly formed on the daily chart.
The price has broken below the Neckline which is showing more downside to come.
We have other indicators showing a downtrend momentum including:
200>20>7
RSI<50
My first target will be at 43.22

VOLVO BULLISH CONTINUATION Volvo Cars, based in Sweden, has announced a remarkable 21% increase in car sales for the month of July compared to the previous year. The company managed to sell 54,165 vehicles during this period, marking the 11th consecutive month of continuous year-over-year growth.
Taking a broader look at the year so far, Volvo has demonstrated impressive performance in 2023. In the initial seven months of the year, the company achieved a global car sales figure of 395,856 units. This substantial number reflects an impressive 18% growth when compared to the same timeframe in 2022. This growth can largely be attributed to the surging demand for their fully electric and plug-in hybrid models, which have captured the interest of consumers.
Risk Disclosure: Trading Foreign Exchange (Forex) and Contracts of Difference (CFD's) carries a high level of risk. By registering and signing up, any client affirms their understanding of their own personal accountability for all transactions performed within their account and recognizes the risks associated with trading on such markets and on such sites. Furthermore, one understands that the company carries zero influence over transactions, markets, and trading signals, therefore, cannot be held liable nor guarantee any profits or losses.


Hemnet time to buy? Lookng to perhaps buy Hemnet if it break out of 155 here. I suspect its a trendline of importance. Also from a finance perspective it could be postive.

Energy development at the bottomHello trenders,
I show you today a solid company with strong backup and investors.
High potential on the upside, undervalued and part of utility sector it makes it a hot stock.
Given the circumstances in EU the price will go up starting by this winter.
Perfect for your portfolio diversification, good for short or long term.
Good luck.
Be wise don´t work for money, make money work for you.

Omx 30 sweden will fallNow Im back again, I have refined my analyses,..
Looking at vix, sp500, Dax and sweden while trading.
Target 2016.

30-100% to the end of the year. Just patent approved, gave the first signal.
Target, 6.5- 7.5 - 10.
Be wise, make your money work for you.

Why the U.S. dollar is strengtheningYellow= Support or Resistance
Green= Positive trendlines
Blue= Strong and trend effecting S/R
The analysis concern USD bound to SEK, however its a great general directional indication to USD weighing against all other.
The Analysis is about the current positive trend. Due to its already developed for some time its not in its beginning, therefore its not an obvious buy, so im neutral and HOLD at the moment, passing the orange line would say SELL, enter short, EXIT LONG. Otherwise we are currently at green trendline bottom and if passing many yellow lines (current resistances) we aim next to rebounded up until upper green trendline resistance.
Like & Share if this was worth anything, only then ill hare more ideas.

Is the krona a new safe-haven currency?The Swedish krona is among the major currencies that are susceptible to the latest developments in East Europe alongside the Euro, and both have been a basis for market sentiment surrounding the conflict on markets and economies.
On March 7, as the third round of peace talks capped off without any breakthroughs and as energy prices surged to a 14-year high, the SEK fell to its lowest in nearly two years at almost 10 SEK per USD.
Dovish Riksbank
The Swedish central bank’s (Riksbank) recent dovish stance also weighs on the SEK. At its February monetary policy meeting, Riksbank kept interest rates at 0% and maintained the volume of its asset purchases unchanged. The decision dealt a further blow to the SEK, knocking its value by 2% shortly after the rate decision.
However, the pressure is growing on Riksbank Governor Stefan Ingves to hike rates as the central bank acknowledged the rising inflation rate as a result of higher energy prices.
Central bank peer pressure
Still, the central bank does not expect energy prices to continue to rise this year, it said in its most recent policy report, adding that inflation will likely fall back.
The central bank now expects a tightening of its policy in the second half of 2024, earlier than its previous forecast issued in November, amid peer pressure as the Bank of England recently hiked rates again to back to pre-pandemic levels, while the US Federal Reserve penciled in rate hikes at each of its remaining policy meetings this year.
Riksbank expects to raise its repurchase rate — or the interest it charges to commercial banks for short-term borrowings — to 0.06% in the first quarter of 2024 and to 0.31% by the first quarter of 2025.
Weakening SEK
In its February policy report, Riksbank acknowledged that the SEK is losing its value from its November 2021 levels based on the krona index. The central bank attributed the weakening of the krona to the rising turbulence on the financial markets.
"Variations in the Swedish krona exchange rate usually coincide with changes in risk appetite on the financial markets. In the coming years, the krona exchange rate is expected to slowly strengthen,” the central bank said.
Even before the COVID-19 pandemic, between 2013 and 2020, the SEK depreciated sharply due to lower interest rates and Riksbank’s quantitative easing. In an earlier report, the Riksbank said the depreciation of the SEK during the said seven-year period "is a puzzling phenomenon for an advanced economy” as the krona kept depreciating even when the interest differential stabilized.
Growing use as a reserve currency
Although Sweden’s economy is fairly smaller than its neighboring European countries including Germany, the UK, France and Italy, the Swedish krona has been classified as a safe haven currency for many foreign exchange watchers.
The IMF sees the SEK as the sixth non-traditional reserve currency globally next to the Australian and Canadian dollars, the Chinese renminbi, the Swiss franc, and the Korean won.
The SEK is becoming increasingly viable as a reserve currency as the US dollar’s dominance has been steadily declining over the past two decades as central banks turn to non-traditional currencies, according to a recent report by the International Monetary Fund.
The share of the US dollar in official reserve assets has decreased over the past two decades, which the IMF attributed to the increased share of non-traditional reserve currencies like the SEK, it said.

IS THIS THE HEALTHY UPTREAD?Weekly Time-frame
We are currently above Ichimoku Cloud but not yet confirmed. Still this is a Bullish Scenario. Bullish Relative Strength Index (RSI), Bullish Awesome Oscillator (AO). Rejection Area of $45,806 & $48,008. Support is in $43,971.
1D Time-frame
Huge green volume candle right there in AO. Area of rejection is still in $45,350, $48,008, and max would be $49,965. RSI is not overbought yet means there are still room for the upside. EMA 144 and EMA 233 has become a Strong Resistance. We are yet to test this resistance which is weakening and becoming a flattening slope resistance. Support is found in $44,106 & $42,624.
4H Time-frame
alternative.me
There is no sign of eminent reversal of trend yet. Greed and Fear Index remains neutral 52 (yesterday 51).
We can expect more to the upside. Rejection Area $45,653, $45,806, & $48,008. Relative Strength Volatility Variable Bands (RSVVB) staying inside the Bullish Pumping Zone. We have formed Cup & Handle price target at $53,907. RSI is overbought but doesn't matter it is normal during a healthy up-trend.
We will discuss more on the possibility on our Live. Stay tune and check with us!
Want more insights before US market open? Hit Like, Share, and Subscribe for more daily trading tutorial & cryptocurrency news
Trade Scholar, the best cryptocurrency educational community online!
Find the content above difficult to understand?
Feeling lost about how to trade?
Want to learn how to do your Own Price Prediction?
We endeavour to share you our investment knowledge & experience in order to help you starting your path to financial freedom. Follow, Subscribe & Join our Community to trade together!
Disclaimer: Above Technical Analysis is pure educational information, not Investment Advice. The information provided on this post does not constitute investment advice, financial advice, trading advice, or any other sort of advice and you should not treat any of the website's content as such. Do conduct your own due diligence and consult your financial advisor before making any investment decisions.

Trading Idea - #BillerudKorsnasBillerudKorsnas specializes in the manufacture and marketing of packaging products and materials made from virgin fiber.
- very intact upward trend with corrections about 5% to 15%! Wait for a min. 5% correction to buy or re-buy!
- Fair price 145.00 SEK
- 180 SEK becomes a mid-term resistance level!

KIND_SDB Daily TimeframeSNIPER STRATEGY
This magical strategy works like a clock on almost any charts
Although I have to say it can’t predict pullbacks, so I do not suggest this strategy for leverage trading.
It will not give you the whole wave like any other strategy out there but it will give you huge part of the wave.
The best timeframe for this strategy is Daily, Weekly and Monthly however it can work any timeframe above three minutes.
Start believing in this strategy because it will reward believers with huge profit.
There is a lot more about this strategy.
It can predict and also it can give you almost exact buy or sell time on the spot.
I am developing it even more so stay tuned and start to follow me for more signals and forecasts.

Investor. The King of Sweden. Stable and fast. But not for long.Investor. The King of Sweden. Stable and fast. But not for long.
Like all stocks. we are going down. Momentum and bubble is about to burst.

Wait for uptrend confirmation and buy signal with USDCHFH4 time frame.
Structure: The price broke out of the triangle pattern and the 0.92000 resistance.
Waiting for the price to retest 0.92000 or have a larger retracement towards 0.91700 and confirm the uptrend then buy setups with USDCHF can be found.
The profit target is 0.92800 zone.
-----------------------------------------------------------------------------------------------
Wish you all have a good trading day!
