HYPE | Sweep & Reclaim SetupPlan:
Watching for a sweep into the blue H4 Untapped Demand zone, then a reclaim of 41.237 (green line) to add longs.
Ideal target: new ATH and 55 extension.
If the blue zone fails or we can't reclaim 41.237, risk-off mode: equal lows at 30.6 could be the draw.
Reasoning:
A sweep into demand would reset local liquidity and trap late shorts.
Reclaiming 41.237 confirms a shift in momentum and invalidates the breakdown.
Structure is bullish above 41.237; below, risk increases for deeper downside.
Sweep

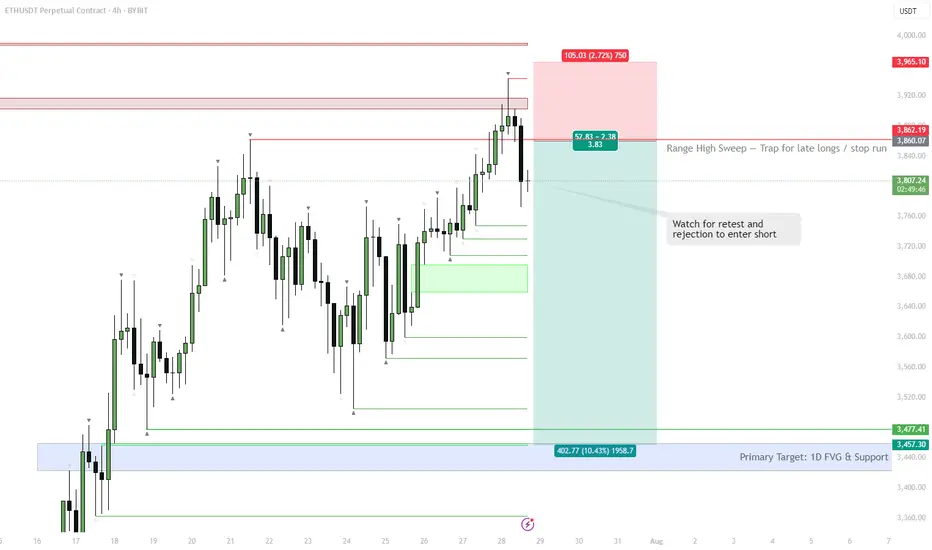
ETH | #4h #short — Range High Sweep & Short SetupScenario:
ETH swept the range high at $3,860, trapping late buyers and triggering stops. Watching for a retest of this level — if it holds as resistance and we see rejection, that’s a short trigger.
Target:
Main target is the 1D FVG at $3,457–$3,477. Possible extension: sweep of range low if selling accelerates.
Why:
Failed breakout setups are classic mean reversion triggers, especially when supported by a visible liquidity pool (FVG) below.
Plan:
Wait for a retest and rejection to confirm short. Partial TP at the FVG zone, manage risk above the sweep high.
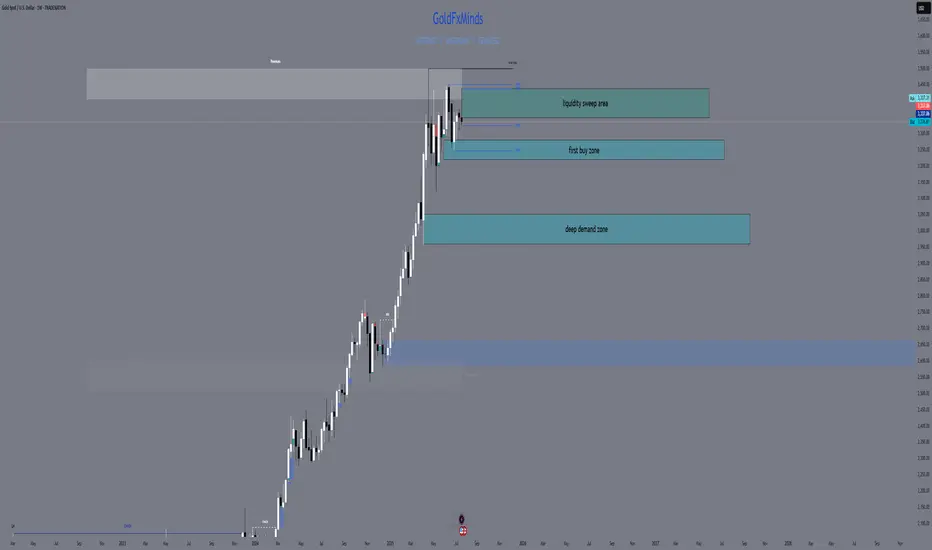
XAUUSD FULL WEEKLY STRUCTURE MAPHello traders! 🌟
We’re stepping into a pivotal week for gold (XAUUSD), and the weekly chart tells a story of tension, liquidity hunts, and potential big moves. Let’s dive into the three truly critical zones, backed by SMC/ICT logic, Fibonacci, EMAs, RSI, and fair‑value gaps — all in one elegant map. 🎨✨
🔹 HTF Overview & Macro Pulse
Current Price: 3336
Weekly Trend: Bullish overall, but momentum is fading as price coils under premium highs.
EMAs (5/21/50/200):
EMA5 & EMA21 are flattening beneath price, hinting at stall.
EMA50 sitting near 3120 as a deep support magnet.
RSI (Weekly): Cooling from ~75 down to ~66, showing bearish divergence vs those upper wicks.
Fair‑Value Gaps:
Unfilled 3365–3405 zone above — institutional imbalance still waiting.
Partially filled 3280–3320 below — common reaction pocket.
Fibonacci Extensions (1984 → 3365 high): 127.2% at 3405, 161.8% at 3439 — the exact top of our supply wick.
Macro Catalysts This Week
Wed (Jul 30): FOMC + Fed Statement
Thu (Jul 31): Core PCE + Unemployment Claims
Fri (Aug 1): NFP + ISM Manufacturing
Prepare for violent spikes into one of our zones — then trade the reaction.
🔸 The Three TRUE Weekly Zones
W1 Supply (Ultimate Wick Zone)
🔥 3350 – 3439
This entire wick from May–July is YOUR one and only supply zone on weekly.
Pure liquidity sweep area
Confluence: unfilled fair‑value gap, 127–161.8% Fib, RSI divergence
Every touch here is a short‑trap until we see a full weekly close above 3439.
W1 Demand (Primary Buy Zone)
🌊 3220 – 3285
The last robust order block & BOS base before gold ran vertical.
Confluence: filled FVG, weekly OB body, EMA21 target, RSI back at 50
Ideal sniper entry after a news‑driven sell‑off into this range.
Deep Discount Block
🛡️ 2960 – 3050
The origin of the full 2024–2025 bull trend — true institutional accumulation.
Confluence: March 2024 CHoCH base, EMA50/200 proximity, 78.6–88.6% Fib retrace
Only for a major quarterly reset; not on the immediate radar unless USD spikes dramatically.
🧭 Strategy & Execution
Short Bias: Wait for a liquidity spike into 3350–3439 (likely around FOMC/NFP), then watch for a clean rejection candle.
Long Bias: After a thrust down into 3220–3285, look for wick‑based rejection plus EMA21 hold and a bullish engulf on weekly.
Avoid the mid‑zone between 3285–3350 — that’s noise, not structure.
Patience is everything. Let price sweep, then let us strike. The real power trades this week will be born from clear structure — not guesswork.
💬 What’s your favorite zone to watch? Drop a comment below!
👍 Smash that like🚀🚀🚀 if you found this map helpful, and hit follow for more GoldFxMinds sniper blueprints.
Disclosure: Analysis based on Trade Nation’s TradingView feed. I’m part of their Influencer Program.
GoldFxMinds 💛
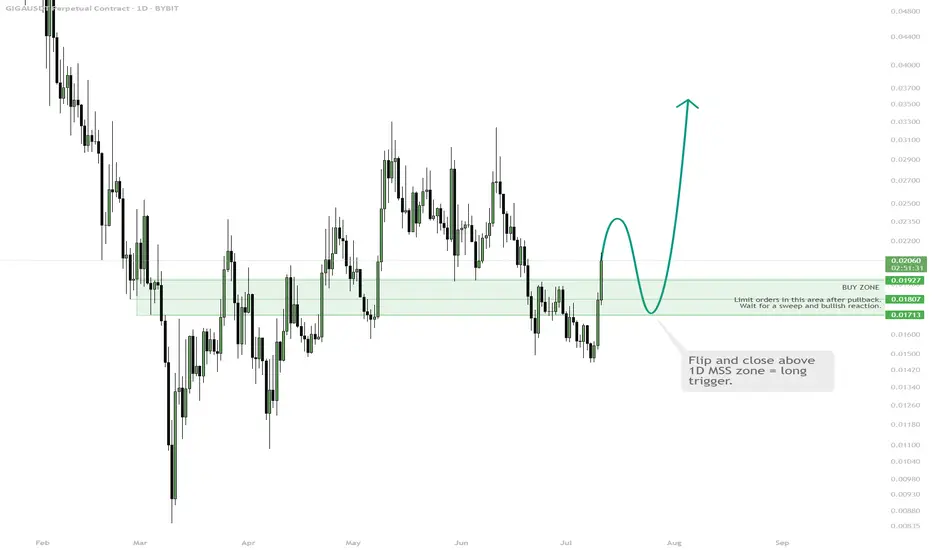
GIGA | Watch for 1D MSS Flip & Long TriggerBUY ZONE $0.0175–0.0192 — wait for pullback, enter on bullish signal.
TRIGGER: Flip and hold above 1D MSS zone.
STOP: Close below $0.0171 = exit.
TP: $0.025 / $0.03 — take profit on move up.
Wait for the break and flip above 1D MSS, then enter long on confirmation. Avoid early entry — only buy after a clear signal. Fix part of profit at resistance.
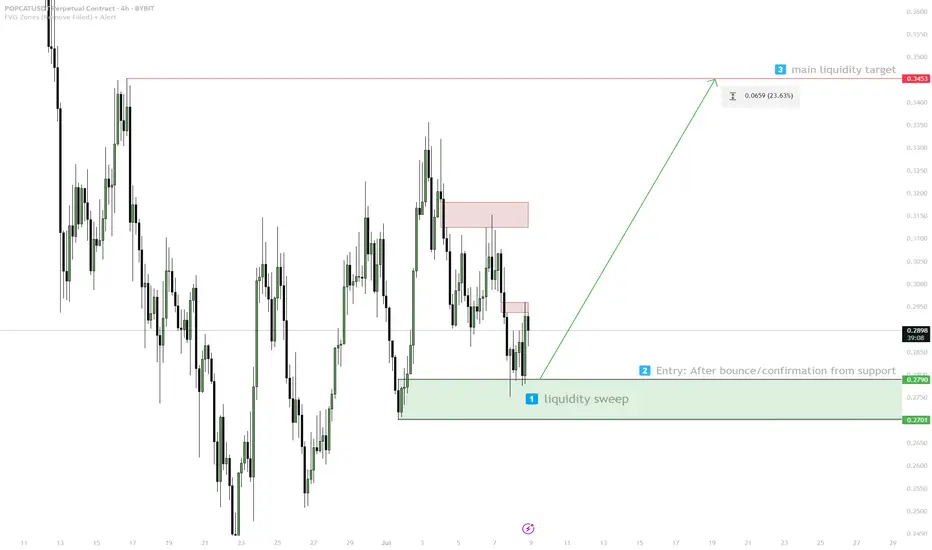
POPCAT — Liquidity Target Play1. Watch for sweep/liquidity grab in 0.270–0.279
2. Enter on confirmed bounce
3. Target: 0.3453 (liquidity zone)
4. Stop: below 0.270 — invalid
Sonic (FTM) — RR Sweep & Accumulation Setup1. Wait for full sweep of weak lows (target $0.15)
2. Enter long only after reclaim above support zone
3. Macro target: $3.47+
4. If no strong low or reclaim, stay flat

SOL — Liquidity Sweep & Demand Play1. Wait for price to sweep into demand
2. Enter long on SFP or strong bounce
3. Target: 240+
4. Stop: below demand zone
If no sweep, stay flat or wait for clear reclaim

GBPUSD sweep of lowGBPUSD sweep of low reclaim of low and respecting liquidity aree take to weekly high cautiously after that short of lifetime

CHILLGUY Breaking Out — Rotating Gains Into Next Meme Runner🎯 Trading Plan:
Watch for a sweep into the red box and LTF reclaim for spot entry
Targets: $0.117 (yearly high), then $0.129–$0.158 if strong momentum
Manual invalidation: 1D close below red box
🚨 Risk Warning:
No spot entry unless sweep/reclaim at supply zone
Exit if 1D candle closes below supply zone

BTC may going low after ATH?Weekly Analysis:
- Market to go higher , as last week's weekly candle was very bullish
- May sweep Weekly Buyside Liquidity
- May move bearish towards the Weekly FVG

XAUUSD Daily Sniper Plan – June 27, 2025Hey traders! Today’s a trader’s dream: high-impact US news, gold trapped in a tight coil between supply and demand, and price flirting with the decision zone. The first breakout will be explosive — but only one side survives the trap. Let’s lock in the real structure, real bias, and sniper-level execution.
🔸 HTF Bias Breakdown
Daily Bias: Neutral → Price trapped between major supply (3359) and HTF demand (3282). Expect breakout after news.
H4 Bias: Bearish → Lower highs holding below 3359, structure weak below 3340.
H1 Bias: Mixed → Bullish momentum building off 3310–3282, but compression under EMAs warns of a fake rally.
🔹 Key Levels Above Price
3385 – Final top-side liquidity zone (last week’s spike high)
3359–3344 – HTF supply & OB (main short zone)
3340–3330 – The pivot zone (battle for control)
🔸 Key Levels Below Price
3317–3310 – Primary demand zone (where buyers stepped in yesterday)
3297–3282 – Deep liquidity pocket & HTF OB (last chance for bulls)
3260 – Breakdown zone if everything fails below
🔥 Sniper Zones & Execution Logic
🔴 3385–3375 – Extreme Supply
Only trade this zone if NY news launches price up and rejection is instant. Needs M5/M15 bearish reversal (engulfing, CHoCH, FVG fill). No news spike = no trade.
🔴 3359–3344 – Main Supply Zone
This is your first real short setup. Sweep into this area + rejection = clean short trigger. Confluence: HTF OB, FVG, EMA 100 rejection, bearish CHoCH.
⚔️ 3340–3330 – Pivot Decision Zone
This is where direction flips.
Break and hold above 3340 = bullish → targets 3359 / 3375
Rejection under 3330 = bearish → back toward 3310 or 3282
Plan: Use for break/retest entries only with M5/M15 confirmation. No blind trades.
🟢 3317–3310 – Primary Demand Zone
Watch for news-induced sweep, then M15 bullish PA (CHoCH, engulfing, RSI bounce). First safe buy zone if structure holds.
🟢 3297–3282 – Deep Demand Zone
Only used if NY session nukes the market. Enter only on textbook SMC/ICT reversal + RSI sub-30. This is the last stand for bulls.
🧠 Execution Strategy
Wait for NY news and first liquidity sweep. Don’t guess.
Sell 3359–3344 or 3375+ only on strong rejection
Buy 3310 or 3282 only on bullish reversal confirmation
Pivot 3340–3330 is the heart of today — use for break/retest or trap reversal
If you love clear logic, tap like, follow, and share your bias in the comments! 🚀👇
Disclosure: I am part of TradeNation's Influencer program and I'm using their TradingView charts in my analyses and educational articles.
GoldFxMinds

XAUUSD – Sniper Entry Plan June 26, 2025👋 Hello traders,
Gold is currently consolidating after recent downside liquidity sweeps, and Thursday brings high-impact USD catalysts. Let’s break it down and build a precise plan for sniper entries around these volatile zones. We’re trading structure, not noise — eyes on the prize. 🎯
🔸 HTF Outlook (D1 → H4 → H1)
🌐 Macro & Geopolitical Context
Markets are bracing for:
USD Unemployment Claims (Forecast: 244K, previous: 245K)
Final GDP q/q and Durable Goods Orders
Fed speakers (Barkin, Barr, Harker)
Stronger-than-expected data could reinforce USD bullish sentiment, sending gold down. Weaker reports + dovish Fed = bullish pressure on gold.
🗺️ Daily Bias: Neutral to Bullish
Price is ranging above a key CHoCH low + Daily OB (3272–3288)
Strong bullish continuation only confirmed with a break above 3370–3384
FIBO: 50% retracement of the last swing is near 3310, giving structure to Buy Zone 1
Bias: Bullish as long as 3272 holds — PA supports HL structure above imbalance
🕓 H4 Bias: Bearish Pullback
CHoCH at 3384 → clean Lower High + price failed to close above premium FVG
Pullback testing EMA 50/100 + FVG at 3345
FIBO extension zone at 161.8% aligns near 3288 = reactive downside target
Bias: Reactive bearish under 3352. If 3370 breaks cleanly → short invalid.
🕐 H1 Bias: Bullish Short-Term
CHoCH → HL printed at 3310 → higher lows forming toward supply
EMA 21/50 crossed to the upside, RSI mid-range (50–60)
PA structure showing ascending triangle under resistance
Bias: Bullish continuation valid toward 3352–3370, unless breakdown under 3308
🔸 LTF Precision (M30 → M15)
🔹 Sell Zone 1 – 3352–3345
H1 OB + M15 FVG + upper range sweep
RSI expected to peak near 70 → potential divergence
FIBO: 78.6% retracement of previous bearish leg
PA: Watch for M15 liquidity sweep + bearish engulfing
🔸 Entry: Wait for break/retest → confirmation on M5–M15 BOS
🔹 Sell Zone 2 – 3370–3384
HTF premium imbalance zone + weak high above
RSI likely in exhaustion zone
FIBO extension 1.272–1.618 completes inside this supply
PA: Only enter after stop hunt wick + clear CHoCH (M5)
🔸 Entry: Reactive fade after liquidity trap
🔸 Buy Zone 1 – 3308–3313
H1 CHoCH + OB + EQ zone
RSI bounce zone (30–40)
FIBO 50–61.8% retracement of bullish swing
PA: Watch for M15 bullish engulfing or double bottom formation
🔸 Entry: Only on structure break + retest confirmation
🔸 Buy Zone 2 – 3288–3272
Daily OB + HTF FVG + massive imbalance
RSI expected to overshoot under 30
FIBO: 1.618 extension from previous M15 bullish leg
PA: High-RR reversal zone if flushed by NY open
🔸 Entry: Enter only after M5 CHoCH or strong engulfing near the OB
⚖️ Decision Zone – 3333–3336
Previous supply turned EQ zone
PA shows indecision — do not enter here
Useful for monitoring if price holds support or rejects
🔸 Trade Scenarios
🟢 Bullish Scenario
If USD data is weak:
Flush to 3308 or 3288
Confirm HL formation → sniper buy from OB → aim 3345+, possibly 3370 sweep
🔴 Bearish Scenario
If USD prints strong:
Price spikes into 3352 or 3370 zones → rejection + BOS
Sniper short entry → targets 3310 → 3288
🔸 Final Plan & Action Points
✅ Patience is key during news. Let structure confirm.
✅ Track price behavior near 14:30 CEST, avoid instant spikes.
✅ Best sniper RR zones:
🔹 Sell from 3352 or 3370
🔸 Buy from 3308 or 3288
📊 Precision matters. Structure wins.
👍 Like this if it helped you map the move, and 🔔 follow for tomorrow’s sniper entry.
— GoldFxMinds
Disclosure: I am part of TradeNation's Influencer program and receive a monthly fee for using their TradingView charts in my analyses and educational articles.

XAUUSD Daily Sniper Plan – Monday, June 23, 2025Current Price: 3368.76
Trend: Bearish on H4 | Corrective on H1 | Weak Bullish Attempt on M15
Market Context: Gold is consolidating under EMA pressure after FOMC. Price is pinned inside a key flip zone, awaiting Monday’s fundamental triggers.
🔸 HTF Overview (D1, H4, H1)
📰 Macro + Economic Context – Week of June 23–28:
This is a high-impact week for USD with Fed speeches, inflation, and growth data. Monday opens with caution:
Monday, June 23
🟠 FOMC Member Waller Speaks
🔴 Flash Manufacturing & Services PMI
🟠 Existing Home Sales
Tuesday, June 24
🔴 Fed Chair Powell Testifies
🟠 CB Consumer Confidence
🟠 Richmond Manufacturing Index
Wednesday, June 25
🔴 Powell Testimony (Day 2)
🟠 New Home Sales
Thursday, June 26
🔴 Final GDP q/q
🔴 Unemployment Claims
🟠 Durable Goods Orders
🟠 Pending Home Sales
Friday, June 27
🔴 Core PCE Price Index
🟠 Revised UoM Consumer Sentiment
📌 Monday is lighter in impact, but PMI data and Waller’s speech may spark the week’s directional bias. Avoid trading blindly into PMI spikes.
H4 Structure & Bias:
Bearish trend intact: Lower High = 3418, Lower Low = 3311
EMAs (21/50/100) aligned downward — price capped below 3380
RSI still under 60 = no bullish momentum
Rejection zone remains valid at 3406–3420 (H4 OB)
Strong demand expected at 3340–3352 and extreme at 3310–3288
🔸 LTF Precision (M30, M15)
Price compressing around 3365–3372
RSI around 56 → indecision
No bullish HH above 3380 = still within bearish control
EMA flattening → prepare for trap setups around NY open
🧭 Trade Scenarios
🔻 Sell Zone – 3406–3420
H4 OB, FVG top, liquidity above 3405
Entry: 3412
SL: 3426
TP1: 3312
TP2: 3288
TP3: 3265
🧠 Wait for sweep or strong bearish reaction — no early entries.
⚠️ Flip Zone – 3360–3380
No-trade zone: EMA cluster + mid-FVG
Only use for confirmations, not entries
🟢 Buy Zone – 3340–3352
OB + demand + Fib retracement
Entry: 3348
SL: 3334
TP1: 3448
TP2: 3472
TP3: 3490
🟢 Buy Zone – 3310–3288
Below LL sweep (3311)
Deep liquidity + OB demand
Entry: 3298
SL: 3280
TP1: 3365
TP2: 3405
TP3: 3440
📍 Key Structural Levels – June 23
Level Type Role
3460 Bull Trap Limit Irrational spike area
3445 FOMC Unfilled wick – trap zone
3426 Sell Zone Risk protection above OB
3418 H4 LH Confirmed bearish structure
3410 OB Midpoint Micro-rejection inside OB
3395 Previous HH Inducement target
3384 FVG Top Minor LTF rejection
3360–3380 ⚠️ Flip Zone MA/FVG compression – avoid entries
3352 OB entry edge Buy Zone 1 upper limit
3340 OB base Buy Zone 1 key level
3311 H4 LL Confirms bear structure
3300 Round Level Psychological + liquidity
3288 OB base Final demand structure zone
3265 Final TP Bearish extension only
✅ Final Action Plan
📉 Stay bearish below 3380 unless a clean HH + OB support forms
⚠️ Avoid trading inside 3360–3380 flip zone during NY PMI data
🛒 Longs valid only from 3340 or 3310 with confirmation (RSI, PA, OB)
🧠 Focus on structure integrity and clean OB rejections only
💬 Will you fade the 3412 OB or wait for the sniper bounce at 3348?
🔔 Follow and 🚀@GoldFxMinds for premium breakdowns, macro updates, and real-time sniper execution guidance.
🔹 Disclosure: As part of Trade Nation’s Influencer Program, we receive monthly compensation for using their charts.
GoldFxMinds

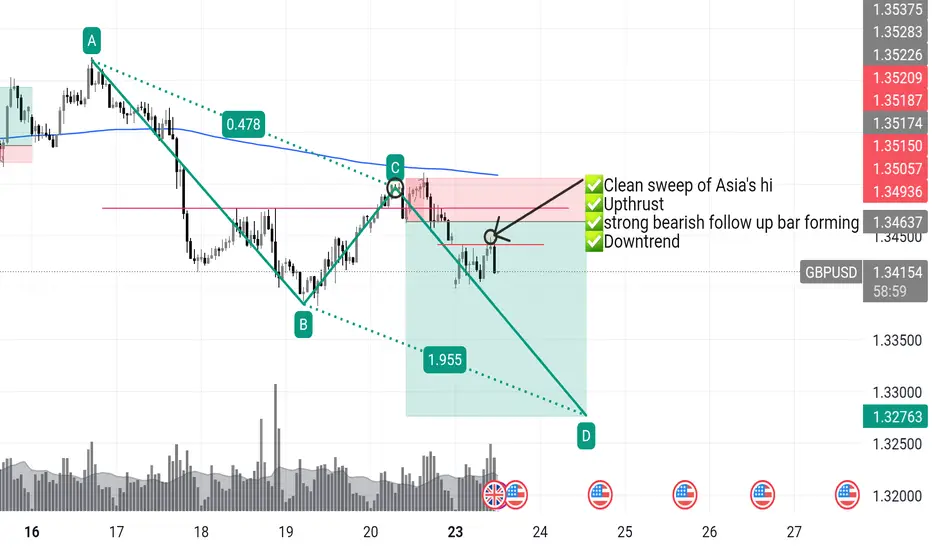
GBPUSD short re-entryGBPUSD – I Got Clipped. Now I’m Coming Back With Intent.
📅 Monday | June 23, 2025
Yes — I got stopped out. That’s execution, not failure.
Clean sweep of Asia’s high. Textbook.
Liquidity taken. Weak hands shaken. Now the real move can begin.
🔁 This 1H close is my greenlight for re-entry.
I don’t hesitate when the market gives me the same setup twice —
It’s still:
✅ Downtrend dominant
✅ Upthrust confirmed
✅ Sellers stepping back in
✅ Price under key rejection zone
If this bar closes bearish, I’m short again — this time with full intent.
📉 Target: 3r+ and beyond
🔥 London
H4 Outlook – Between Flip and Trap👋 Hey Gold minds, welcome to another sniper-level breakdown. We're mid-range between major sweep zones and watching carefully how price reacts around the current compression under key EMAs and FVG. Let’s break it down:
🔸 MACRO + FUNDAMENTAL CONTEXT
USD drivers this week:
🔹 Monday–Tuesday: Multiple FOMC Members speaking
🔹 Wednesday: Powell Testimony
🔹 Thursday: Final GDP + Unemployment Claims
🔹 Friday: Core PCE and UoM Inflation Expectations
Macro sentiment:
FOMC speakers remain hawkish while inflation is sticky. Gold reacts defensively as markets price in Powell’s tone. Liquidity traps on both sides still active. Gold consolidates below key liquidity at 3405, potentially setting up for either expansion or sweep rejection.
🔸 H4 STRUCTURE + BIAS
Market structure:
Price formed a Lower High (3452) and confirmed bearish intent with a break of structure to the downside (CHoCH & BOS).
Currently compressing under H4 Fair Value Gap and retesting an internal OB + EQ zone around 3360–3370, showing signs of rejection.
EMA Cluster:
Price is compressing between EMA 21 / 50 / 100, failing to reclaim EMA100.
EMA5 is crossing under EMA21 – short-term bearish bias holds.
Bias: 🔻 Bearish to neutral
As long as price stays under 3380, supply remains in control. Only a break and close above 3405–3415 would flip bias bullish short term.
🧭 Sniper Zones – H4 Precision Map
🔷 Type 📍 Price Zone 📌 Justification
🔵 Buy Zone #1 3315 – 3340 Valid OB , previous HL structure, FVG reaction support
🔵 Buy Zone #2 3280 – 3302 Deeper demand pocket, untapped imbalance
🟠 Flip Zone 3360 – 3380 FVG + internal OB + EMA compression = key battle zone
🔴 Sell Zone #1 3405 – 3415 Internal OB + unmitigated premium zone under LH
🔴 Sell Trap Zone 3440 – 3460 Extreme rejection zone — 3452 HH sweep logic + OB
🔸 Price Action Expectations (PA)
If price rejects 3360–3380, expect a clean push back to 3320, with possible deeper draw to 3300–3285.
A clean break and close above 3380 (not just a wick) may open the door for a sweep of 3405, where sellers are expected.
Only an aggressive news-driven breakout above 3415 would unlock the final trap zone toward 3450+ – lower probability unless Powell surprises.
✅ Conclusion & Execution Plan
🎯 Watch how price behaves around the Flip Zone — this is the decision point.
📉 Main bearish confirmation = strong rejection at Flip Zone or 3405.
📈 Bullish continuation only above 3415 with volume and closing strength.
💎 Best RR zones:
Sell 3405–3420 → targeting 3360 / 3340
Buy 3315–3340 → targeting 3360 / 3380
🔥 If this breakdown helped sharpen your edge, drop a 🚀 in the comments and like the post!
🔔 Follow GoldFxMinds for more real-time, structure-based sniper plans.
🧠 Precision isn't optional. It's the edge.
🔹 Disclosure: As part of Trade Nation’s Influencer Program, we receive monthly compensation for using their charts.
GoldFxMinds

XAUUSD Weekly Outlook | June 23–27, 2025👋 Hey gold traders! As we close out the FOMC week and head into the final stretch of June, gold continues to hold bullish structure — but this week's candle is entering a very sensitive premium area. Let's break it all down in full top-down clarity:
🔍 Weekly Structure Update
✅ Weekly BOS confirmed since November 2023
✅ Price holding above EMA 5/21/50 — bullish lock intact
🔼 Current HH printed at 3452
📍Price is now entering a weekly FVG + supply trap zone around 3440–3460
🟣 RSI divergence starting to appear — caution in premium
🗺 Key Weekly Zones
Type Price Range Context
🔵 Demand Zone 3150 – 3190 Weekly OB + EMA50 confluence
🟣 FVG Support 3284 – 3320 Fresh imbalance post BOS
🟠 Flip Zone 3363 – 3385 Retest of BOS + FVG bottom
🔴 Sell Trap Zone 3440 – 3460 Weekly OB + liquidity sweep area
🧠 Bias This Week
📌 Bullish, but extended.
We expect a reaction from 3440–3460, not blind continuation.
The next healthy buy opportunity is only valid on a retrace toward 3320–3280, aligned with imbalance + structure.
🧭 GoldFxMinds Game Plan
Above 3440–3460 = overextension — wait for trap/sweep confirmation 🧨
Below 3363 = bearish flip zone — risk of revisiting 3280
Ideal buy = 3284–3320 → only on bullish PA or reversal confirmation
📰 Upcoming Economic Events (June 23–27)
🗣 FOMC Speakers flood the week (Waller, Powell, Williams, Goolsbee, Hammack, etc.)
🏠 Existing & New Home Sales, Consumer Confidence, Pending Home Sales
🛢 Crude Oil & Natural Gas Inventory reports
📊 Final GDP q/q, Core PCE, Personal Spending/Income
📉 Durable Goods, Unemployment Claims
🧪 Bank Stress Test Results (Friday)
⚠️ This is a dense news week — stay alert for surprise volatility, especially around Powell’s testimonies (Tue & Wed).
⚠️ Summary:
We are no longer in discount — we are inside the premium trap. Gold remains bullish, but 3440–3460 is a red flag zone. If this becomes the top, watch the flip at 3363–3385. Only re-enter long if structure confirms.
💬 If you found this helpful, drop a comment, give it a like, and make sure to follow GoldFxMinds for more sniper-level updates every week!
📣 This post was made using the Trade Nation chart feed. As a partner in their influencer program, I receive compensation for using and sharing their tools.

EUR/USD - Daily highs taken, now what?Introduction
The EUR/USD made a strong move higher today, establishing a clear uptrend on the 4-hour chart. With this latest push, it swept the daily liquidity above the previous high. The question now is whether the EUR/USD will continue moving higher or if there are opportunities for long entries at lower levels.
Liquidity Sweep
EUR/USD has taken out liquidity above the daily highs, where many stop losses are typically positioned. These stops have now been removed from the market. This area could potentially act as a support and resistance flip. However, if we see a 4-hour candle close below the previous daily high, further downside becomes likely.
Where Can We Look for Buys?
During the recent 4-hour move higher, significant progress was made. This upward movement created a daily Fair Value Gap (FVG) between $1.149 and $1.145. This FVG aligns perfectly with the golden pocket Fibonacci level, drawn from the swing low to the swing high. As a result, this zone forms a strong area of confluence for potential buy positions to target a retest of the highs.
Conclusion
Although we are currently breaking above the previous high, this move has yet to be confirmed as sustainable. Holding above this level is crucial. If a 4-hour candle closes below the previous high, it becomes likely that we will revisit the daily FVG and golden pocket Fibonacci zone.
Disclosure: I am part of Trade Nation's Influencer program and receive a monthly fee for using their TradingView charts in my analysis.
Thanks for your support.
- Make sure to follow me so you don't miss out on the next analysis!
- Drop a like and leave a comment!

TRADE ASSESSMENT: March 23 EuroUSD - LOSSwhen price has made a sweep and is making higher highs on the 15min, look for 1hr FVGs to rebalance. that's your narrative. then look for context and entry. (POC+OTE+FVG)
when price has made a sweep and is making higher highs on the 15min, look for 1hr FVGs to rebalancewhen price has made a sweep and is making higher highs on the 15min, look for 1hr FVGs to rebalancewhen price has made a sweep and is making higher highs on the 15min, look for 1hr FVGs to rebalancewhen price has made a sweep and is making higher highs on the 15min, look for 1hr FVGs to rebalancewhen price has made a sweep and is making higher highs on the 15min, look for 1hr FVGs to rebalancewhen price has made a sweep and is making higher highs on the 15min, look for 1hr FVGs to rebalancewhen price has made a sweep and is making higher highs on the 15min, look for 1hr FVGs to rebalance

Sell gold after 2950-65 sweepAfter a lot of bullish week, we may assist to an huge retracement.
I will take care about last week hight and assume there will be a bullish momentum to around 2960-65.
If this level is sustained it will probably go to the 3000.
If the 2960-65 level mark an huge sell off, this could lead us to the weekly retracement
Sell idea
Entry : ~2950-65
SL : 3% Risk
TP1 : 2920
TP2 : 2900
TP3 : 2880
TP4 : 2832

BTCUSDT Fresh Short Setup: Targeting Key Support Zones with SMC Description:
This trade setup presents a Bitcoin short opportunity on the 4H timeframe using the Smart Money Concepts (SMC) framework. After a significant reaction from the supply zone, Bitcoin's price structure aligns with bearish confluences, signaling potential downside. Additionally, external events, such as the recent announcement of China's AI application "DeepSeek," may have amplified market volatility, further supporting the setup.
Trade Setup:
Entry:
Between 103,300 and 104,500
Take-Profit Levels (TP):
101,897
99,825
97,565
95,208
Stop Loss (SL):
Above 105,975
Analysis and Confluences:
Market Structure:
Bitcoin remains in a bearish trend on the 4H timeframe, with consistent lower highs and lower lows.
Supply Zone:
The price is entering the 103.3k–104.5k supply zone, a key resistance area where sellers are expected to dominate.
Fibonacci Confluence:
This zone overlaps with the 0.618–0.786 Fibonacci retracement levels, a high-probability reversal area.
Liquidity Sweeps:
Liquidity above previous highs has been swept, leaving the path clear for potential downside.
Bearish Targets:
The targets align with previous demand zones and liquidity pools at 101,897, 99,825, 97,565, and 95,208.
Trade Plan:
Confirmation: Wait for bearish price action signals or smaller timeframe BOS (Break of Structure) within the supply zone before entering.
Risk Management: Adjust position size to keep risk within acceptable levels. After reaching TP1, move your stop loss to breakeven and secure partial profits.
Final Note: While bearish bias dominates, unexpected macroeconomic events can cause reversals, so use tight risk management.

BTCUSD | 1D SMC Short Setup with Refined SL and TargetsDescription:
This analysis identifies a high-probability short opportunity for BTCUSD on the 1D timeframe using the Smart Money Concepts (SMC) framework. The chart shows clear bearish confluences, including market structure, supply zones, liquidity levels, and Fibonacci retracement zones. I believe the current bullish momentum is merely a manipulation driven by inflation news and the upcoming Trump inauguration. Following these events, I anticipate a significant market correction. Here’s the detailed breakdown and trade plan:
Analysis:
Market Structure:
Break of Structure (BOS): Price has confirmed a bearish trend with BOS to the downside, signaling a continuation of lower highs and lower lows.
Trendline Resistance: A well-defined downward trendline indicates selling pressure, reinforcing the bearish bias.
Key Zones and Liquidity:
Supply Zone: Highlighted in purple at $102,000-$104,000 . This zone represents an area where strong selling previously occurred, creating an imbalance.
Golden Zone (Fibonacci Retracement): Located around $101,000-$103,000 , this area aligns with the 61.8%-78.6% retracement levels and offers a high-probability reversal opportunity.
Weak High: The high near $104,000 represents untapped liquidity, which smart money may target for a liquidity grab before reversing lower.
Equal Lows (EQL): Around $92,000 , these act as a bearish target where liquidity rests, aligning with the continuation of the bearish trend.
Confluences for Short Entry:
Price is approaching the supply zone and Fibonacci Golden Zone , indicating a potential reversal point.
The weak high may trigger a liquidity grab to entice buyers before sellers regain control.
Previous BOS and trendline resistance add further validation to the bearish bias.
Trade Plan:
Short Entry Setup:
Entry Zone: $102,000-$104,000 (inside the supply zone and Golden Zone).
Stop Loss (SL): $105,500 (above the supply zone and imbalance to account for liquidity grabs).
Take Profit Levels:
TP1: $97,000 – Close partial profits at this imbalance mitigation level.
TP2: $92,000 – Target the equal lows and resting liquidity.
TP3: $88,000 – Final target near the blue demand zone for maximum reward.
Risk-Reward Ratio:
With the entry at $103,000 (midpoint of supply), SL at $105,500, and TP at $92,000, the trade offers a 1:4 RR or better, depending on execution and scaling.
Additional Notes:
Monitor the price action closely as BTC approaches the supply zone for confirmation, such as bearish candlestick patterns or lower timeframe CHoCH (Change of Character).
Scaling into the trade in smaller portions across the supply zone can improve overall entry precision.
Adjust stop loss or take profit levels as market conditions evolve

09:30 Liquidity sweep 09:30 liquidity sweep that was build starting from end of Tokyo session.
very fast bull run until Tokyo session top that need to be caught very fast .. ia actually enter at the bottom where i saw a smt with ES.

Gold long oportunity on 15mGold in 15m sweeped its ENG liquidity and made a sub-minor ChoCh , also Gold sweeped previouse day candle's low , so I expect it rise to see major structure's high at 2531.765 .
This is not a financial advice and its just my own oponion, DYOR.
