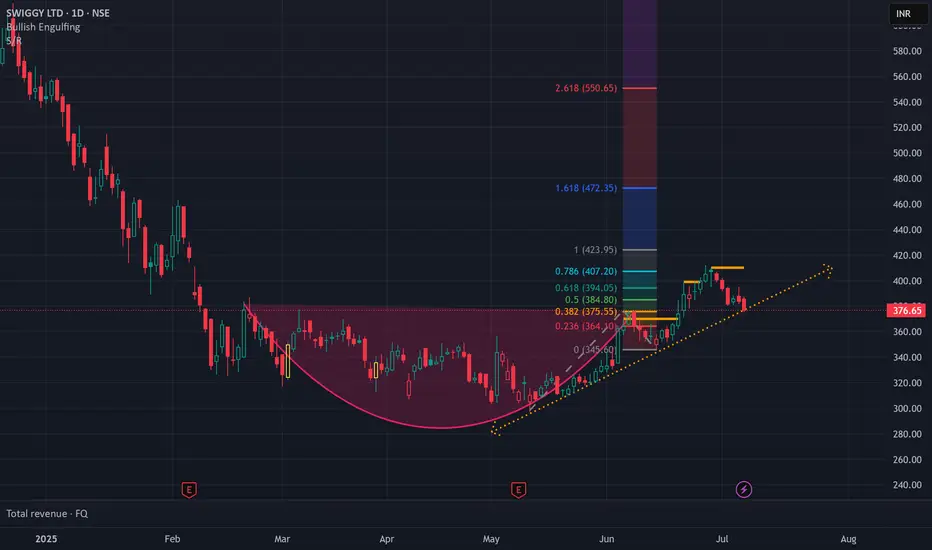
SWIGGY Breaking out of Rouding Bottom PatternNSE:SWIGGY is breaking out of Rouding Bottom Pattern. You can Buy at 398 and Target for 420. Keep Stop loss at 370. The Points that you will gain here is 22 points and since the stock price is less, you can invest a little more and try gaining more profit.
Swigtrading
WHY swing trading, accumulation to explode or fall sharply.Upon joining Binance Futures, there was an artificial drop due to the normal mass selling. Now that some time has passed, it is going to recover. It's a high-risk trade but with great reward. If it breaks the trendline, it could drop significantly, which is why the stop loss must be strict. It could even go up much more up to the FVG at 0.00000028 - 0.00000030, so the stop should be gradually raised as it goes up with the 4-hour or daily candles, just below each one.

SHANKARAHi guys,
In this chart i Found a Demand Zone in SHANKARA CHART for Positional entry,
Observed these Levels based on price action and Demand & Supply.
*Don't Take any trades based on this Picture.
... because this chart is for educational purpose only not for Buy or Sell Recommendation..
Thank you

CADJPY , SHORT Resault: 600 pips✅As you can see in the chart, due to the weakness in the decline and the reaction to the support level , I expect an upward correction first, and then I will update the analysis if there is a reaction to the resistance level .
Stay with me to get more analysis after following me by sharing with friends and leaving a comment.
According to my risk and capital management system, the risk of each trade is one percent per position.
What do you think about this analysis and other analyses?
What symbol would you like me to analyze for you?

AUDCAD SWINGTRADE LONGThis is a swing short on a major daily support level.
This signal is shared too late, but I've taken it so I share it.

Possible Candle Formation Will Determine Trend DirectionThis looks like an incomplete inverted head, neck, and shoulder forming on the 4hr after the strong bullish move the later half of last week. We did pass a weekly level, so a pullback is likely, but may not hold for very long. If we breakthrough both the weekly 1.55481 and daily level 1.53147 areas, we'll continue on the downtrend seeking to reach a new low. Let's see how this plays out.
BULL TPs:
• 1.55140
• 1.55357
• 1.55772
• Stretch TP: 1.57114
BEAR TPs:
• 1.54481
• 1.53962
• 1.53488
• 1.53147
• Stretch TP: 1.52359

EURNZD Price has bounced in our bearish zone This is a full breakdown of my perception of price action on higher time frames! I take my entries using smaller time frame confirmation and you should, too. If you have any questions about this trade or my strategies feel free to ask them in the comment section below!
Let’s make some money together!


GBPUSD - Bearish MovementBearish Movement on the GBPUSD pair, tracked from monthly timeframe down to 4H based on engulfing candles. Opportunities for day trades as well as swing trades

$OSS - low risk/reward - Swing Idea$OSS swing idea
1. Recent Earnings
2. Retraced to all time low (Multiple bottom)
3. Upcoming Conference 6/4/19
Market is weak so small caps and all other sector is bearish. So I'm looking for low risk entry with tight stop loss.
Idea:
1. Enter within the Orange and Red Line OR HOD break of Friday's candle - Scale out 5-8% (target is the green line) but will scale out at any opportunity. Rinse and repeat the play if it falls back to support zone.
2. Honor your Stop loss if it goes below RED line (5c or 7c - depends on where you have entered)
3. Low volume so manage your size/shares.
OR.. You can wait for confirmation when buyers start to step in on a weekly chart.
With the market being so weak, I'm taking smaller position and taking profits faster. Keep adding to support and move stops up accordingly.
Remember! HONOR your STOP LOSS & Plan your trade for small caps.
