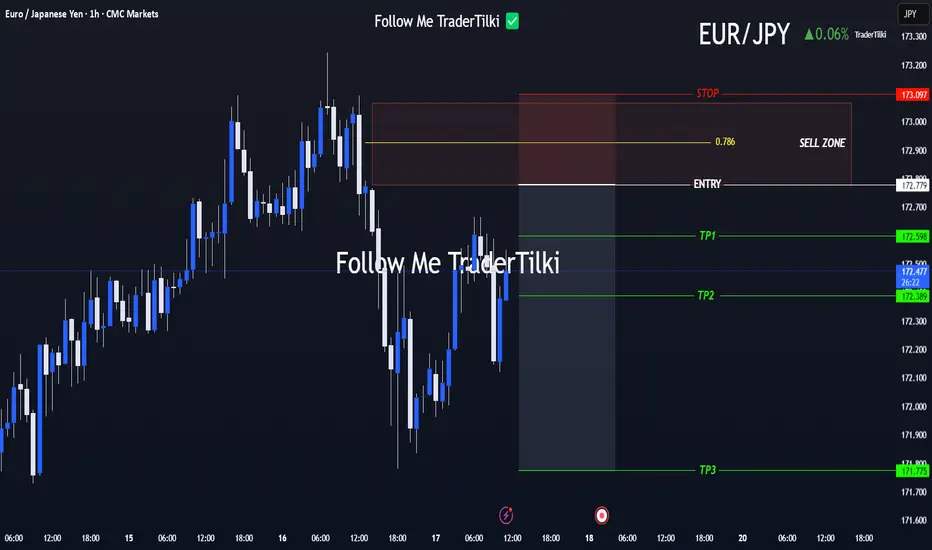
Clear Entry, Clear Targets! Strategy Kicks Off with EUR/JPYHey everyone 👋
📌 SELL LIMIT ORDER / EUR/JPY Key Levels
🟢 Entry: 172,779
🎯 Target 1: 172.598
🎯 Target 2: 172.389
🎯 Target 3: 171,775
🔴 Stop: 173.097
📈 Risk/Reward Ratio: 3.17
I double-checked the levels and put together a clean, focused analysis just for you. Every single like seriously boosts my motivation to keep sharing 📈 Your support means the world to me!
Huge thanks to everyone who likes and backs this work 💙
Our goals are crystal clear, our strategy is solid. Let’s keep moving forward with confidence and smart execution!
Swing-trading
GOLD[XAUUSD]: Breakthrough the bearish pressure, What next?Evening Everyone,
Hope you are doing great, price recently breakthrough the current price inducement, showing a strong bullish volume emerging in the market. Long term approach remain bullish ultimately taking the price towards the new high.
Good luck
Team Setupsfx_

Psychological Trap That Costs You More Than Just Money — KnowHow🎯 Psychological Trap That Costs You More Than Just Money — Know the "Profit Illusion Trap"
“The biggest cost in trading is not just losing money; it’s losing control of your mind.”
Let’s break down a common yet dangerous psychological trap that derails even experienced traders—“Profit Illusion Trap” (you can rename this as per your idea, but this name captures the concept well).
📌 Real Trade Scenario: What Went Wrong?
You took a long position at 108500.
Soon, the price dropped by 300 points, dipping to 108200. You stayed calm.
Then, the price recovered to 108900 — now in profit!
✅ But instead of booking profits, your mind whispered:
“Wait… it’ll go more. Let’s catch a bigger move.”
Now comes the trap:
Price reverses hard. Drops to 104000.
You’ve gone from profit → hope → fear → panic → heavy loss.
This is not bad luck or bad entry.
This is a psychological error, one that eats away traders from the inside.
🧠 What Psychology Is This? Meet “Profit Illusion Trap”
This behavior is a result of:
Recency Bias: You believe recent price action will continue, so when price goes up, you assume it’ll go more up.
Fear of Missing Out (FOMO): Even when you’re in profit, you fear leaving money on the table.
Loss Aversion: Once price reverses, you don’t want to accept a small loss or breakeven — instead, you hold and hope, which deepens the pain.
Ego Attachment: You want to prove yourself right — that the trade will work out, and that you know better than the market.
This combination creates a trap — where your mind tells you it’s rational to hold, but in reality, you’ve lost control over your system.
💥 The Real Cost: “Opportunity Cost vs. Loss Cost”
Let’s define two simple trading terms that affect your P&L and mindset:
🔷 Opportunity Cost
The profit you could’ve booked but didn’t.
Example: You had +400 points profit. Didn't book. Gone.
🔴 Loss Cost
The actual loss incurred because you didn’t act.
In this case: You lost -4500 points from top to bottom.
📉 One trade ruined the risk-to-reward of your entire strategy.
✅ How Can You Avoid This in Intraday & Swing Trading?
Here’s how successful traders manage this trap:
Plan Your Exit Before Entry
Set clear Take Profit (TP) and Stop Loss (SL) levels before clicking that Buy/Sell button. No compromise.
Use Trailing Stop Strategy
Once in profit, trail your SL upward. That way, if price reverses, you're still in profit.
Scale Out of the Trade
Book partial profits when your first target hits. Let the rest run with no stress.
Track Your Emotions
Keep a log. After each trade, write how you felt — scared, greedy, hopeful, etc. Patterns will emerge.
Build a System, Not Dreams
Trading is about math, probabilities, and discipline — not “hope” or “gut feeling.”
📊 Intraday vs Swing: Slight Differences, Same Trap
Aspect Intraday Swing
Time Pressure High — fast decisions Lower — time to reassess
Volatility Impact Very high Medium
Psychology FOMO is faster Overconfidence in "news/events"
Risk Management Tight SL essential Clear zone-based SL & TP
Whether intraday or swing — the trap is the same, just wears different clothes.
💎 Final Thoughts: From “Assaulted by Price” to “Assured by Plan”
This story isn’t rare. It happens every day — in every market.
But traders who learn to exit emotionally dangerous zones with systems, not feelings, are the ones who grow.
Not just their capital — but their character.
“Discipline beats desire. Process beats prediction.”
🔔 Action Plan: Train the Mind, Not Just the Chart
📌 Backtest your system — including exit strategies.
📌 Set predefined rules and stick to them — every trade.
📌 Review and refine — every week.
Control the mind, and the market can’t control you. Opportunity missed is a cost of missing days for recovery to enter again.
✅ If you liked this post, give it a thumbs up, leave your thoughts, or share how you’ve overcome this trap.
📈 Follow for more deep psychological and technical trading content.
Trade Safe. Trade Smart. 💼💡

Is There the Best Moving Average For Swing Trading?Is There the Best Moving Average For Swing Trading?
In swing trading, moving averages are widely used to analyse market trends and identify potential turning points. In this article, we’ll dive into the most commonly used MAs, their unique characteristics, and how they can be applied in swing trading strategies.
What Are Moving Averages?
You definitely know what moving averages are. However, we need to start our article with a brief introduction to this market analysis tool.
A moving average (MA) is a fundamental tool in technical analysis that helps traders understand the direction of a market trend by smoothing out price fluctuations, often touted among the best indicators for swing trading. Instead of focusing on the volatile ups and downs, MAs calculate an average of prices over a specific period, such as 20, 50, or 200 periods. This gives traders a clearer picture of the overall trend by filtering out short-term volatility.
There are different types of moving averages, but they all work on the same principle: tracking the average price over time to highlight the market's trajectory. For example, a 20-period MA shows the average (usually closing price but a trader can choose highs, lows, and opens) over the past 20 periods, updating as new prices come in. This rolling calculation creates a line on the chart, making it easy to identify whether the market is trending upwards, downwards, or moving sideways.
Types of Moving Averages
Moving averages come in various forms, each with unique characteristics that cater to different trading styles and strategies.
Simple Moving Average (SMA)
The simple moving average (SMA) is the most straightforward type, calculated by averaging the closing prices (but a trader can choose any price type) over a set number of periods. For example, a 20-period SMA adds up the last 20 closing prices and divides by 20. It’s popular among traders who want a broader view of price trends without overreacting to short-term fluctuations, making it a contender for one of the best moving averages for swing trading. However, SMAs can lag behind price action, as they give equal weight to all prices in the calculation.
Hull Moving Average (HMA)
The hull moving average (HMA) is designed to reduce lag while maintaining a smooth line. By combining weighted averages with additional smoothing techniques, the HMA offers a balance of speed and clarity, making it an underrated moving average for swing trading.
Exponential Moving Average (EMA)
The exponential moving average (EMA) prioritises recent prices, giving them more weight in the calculation. This makes it more responsive to price changes compared to the SMA. Swing traders often use EMAs in faster-moving markets, where quick adjustments to trend shifts are crucial, with 8- and 21-period EMAs considered by some traders as two of the best EMAs for swing trading. For instance, a 20-period EMA reacts faster to sudden price movements than a 20-period SMA, helping traders spot potential reversals sooner.
Weighted Moving Average (WMA)
Similar to the EMA, the weighted moving average (WMA) also gives more importance to recent prices but does so with a linear weighting system. This means the most recent price has the greatest impact, gradually decreasing with older data. WMAs are less common but useful when traders want a more precise reflection of recent price action.
How to Use Moving Averages in Swing Analysis and Trading
Moving averages are versatile tools that can provide valuable insights for swing traders. Beyond highlighting trends, they can help identify potential turning points and dynamic support or resistance levels. Here’s how they’re commonly used in swing trading:
1. Identifying Trends
MAs are widely used to assess the direction of a trend. For instance, if the price consistently stays above a rising moving average, it suggests an upward trend. Conversely, when prices remain below a declining moving average, the market could be trending downward. Swing traders often rely on shorter moving averages, like the 20-period, for identifying trends that align with their trading horizon.
2. Spotting Reversals with Crossovers
Crossovers happen when two MAs intersect. A common example is a shorter MA crossing above a longer one, which may indicate a shift towards bullish momentum and vice versa.
3. Dynamic Support and Resistance
MAs act as floating support and resistance levels. MAs serve as a support level in an uptrend, with the price bouncing off it repeatedly. In a downtrend, the same moving average might act as resistance, limiting upward moves.
4. Filtering Market Noise
In choppy markets, MAs can smooth out minor fluctuations, making it easier to focus on the bigger picture. Swing traders often use longer MAs, such as the 50-day or 200-day, to filter out irrelevant short-term movements.
5. Timing Entry and Exit Zones
Many traders use crossovers to time their entries and exits, though it’s worth noting their lagging nature means they can result in untimely trades. They can also provide context. For example, if the price approaches a key moving average after a strong move, it might indicate a consolidation phase or a potential reversal, allowing traders to adapt their analysis.
Common Moving Averages for Swing Trading: The 20, 50, and 200 MAs
Swing traders often turn to the 20-, 50-, and 200-period moving averages as their go-to tools for analysing market trends. Each serves a specific purpose, helping traders gauge short-, medium-, and long-term price movements. These moving averages are often used together.
20-Period Moving Average
The 20-period MA is a favourite for short-term trend analysis. It reacts quickly to price changes; therefore, traders use it to identify recent momentum or potential trend shifts. Traders frequently watch for price “bounces” off the 20-period MA as potential indications of continuation in the current trend.
50-Period Moving Average
The 50-period MA provides a medium-term perspective, offering a smoother look at price trends. It’s slower to react than the 20-period MA but avoids being overly lagging. This balance makes it useful for identifying sustained trends while filtering out minor price noise. When prices interact with the 50-period MA, it often acts as a dynamic support or resistance level.
200-Period Moving Average
The 200-period MA is the benchmark for long-term trend analysis. It’s often used to determine the overall market direction. This MA is also a widely followed indicator for institutional traders, adding weight to its significance. Interactions with the 200-period MA often mark key turning points or areas of consolidation.
Traders also monitor crossovers between the 50- and 200-period MAs, recognised by some as the best moving average crossover for swing trading. For instance:
- Golden Cross: When the 50-period MA crosses above the 200-period MA, it suggests potential bullish momentum.
- Death Cross: When the 50-period MA drops below the 200-period MA, it signals a possible bearish shift.
Using Them Together
Using the 20-, 50-, and 200-period MAs together offers a comprehensive approach to identifying the best moving average crossover setups, allowing traders to see the bigger picture while still tracking short-term shifts. For instance, when the price breaks above the 200-period MA while the 20-period MA crosses above the 50-period MA, it may signal the beginning of a broader bullish trend. Meanwhile, a price drop below all three MAs could suggest broader bearish momentum.
Other Moving Average Combinations for Swing Trading
While the 20, 50, and 200-period MAs are staples in swing trading, exploring other combinations can offer nuanced insights tailored to specific trading strategies. Some alternative moving average setups that traders often employ include:
8-Period and 21-Period Exponential Moving Averages (EMAs)
This pairing is favoured by traders seeking to capture short-term price movements with greater sensitivity. They call this the best EMA crossover strategy. The 8-period EMA responds swiftly to recent price changes, while the 21-period EMA provides a slightly broader perspective.
10-Period and 50-Period Simple Moving Averages (SMAs)
Combining the 10- and 50-period SMAs offers a balance between short-term agility and medium-term trend identification. This combination helps traders filter out minor price fluctuations and focus on more sustained movements.
28-Period and 50-Period HMAs
For traders focused on short-to-medium-term trends, the 28- and 50-period HMAs offer a balanced approach. The 28-period HMA reacts quickly to price changes, while the 50-period HMA provides a steadier view of the broader trend. Crossovers between the two can signal potential bullish or bearish momentum shifts, benefiting from the HMA’s reduced lag.
13-Period and 34-Period WMAs
Rooted in Fibonacci sequences, the 13- and 34-period WMAs are employed by traders who believe in the natural rhythm of the markets. A 55-period WMA can also be included for a longer-term perspective. Crossovers between these WMAs can highlight potential trend reversals or continuations, with the WMA adapting more quickly than other MAs due to its weighted calculation.
Implementing These Combinations
When applying these moving average combinations, it's crucial to consider the following:
- Market Conditions: These combinations often perform better in trending markets versus ranging markets. Moreover, shorter MAs might be more effective in capturing quick price movements during high volatility.
- Timeframes: Traders align MAs with their trading horizon. Shorter periods like the 5-period or 8-period MAs are usually used by traders focusing on brief swings, while longer periods like the 50-period MA cater to those looking at extended trends.
- Confirmation with Other Indicators: Relying solely on moving averages can lead to false signals. Traders corroborate these signals with other technical indicators, such as Bollinger Bands or the Relative Strength Index (RSI).
What Moving Averages Should You Use for Swing Trading?
There is no best moving average for swing trading. The choice of MAs ultimately depends on a trader's strategy and preferences. The combinations discussed provide a framework, but experimenting with different setups can help identify what aligns with individual trading styles and objectives.
The Bottom Line
Moving averages are powerful tools for swing trading, offering insights into trends and potential market turning points. Whatever your unique preference for different types and lengths, understanding their application can refine your strategy.
FAQ
Which Moving Average Is Good for Swing Trading?
The 20-period, 50-period, and 200-period moving averages are widely used in swing trading. However, different combinations, like the 8- and 21-period or 13- and 34-period MAs can offer equally valuable insights; it ultimately comes down to the trader’s preference.
What Is the Most Popular Moving Average to Use?
The most popular moving average depends on a trader’s trading style and goals. Shorter MAs, like the 20-day MA, are popular for quick trend identification, while longer ones, such as the 200-day MA, provide a bigger picture. Many traders combine MAs to cover different timeframes.
Is 200 EMA Good for Swing Trading?
The 200-period EMA is useful for swing traders seeking to understand long-term trends. It reacts faster than the 200-period SMA, making it suitable for traders looking to incorporate a responsive indicator in their analysis.
Which Indicator Is Most Popular for Swing Trading?
There isn’t a single best indicator for swing trading. Moving averages, RSI, MACD, and volume indicators are commonly used. Combining these can provide a more comprehensive analysis.
Which Volume Indicator Is Popular for Swing Trading?
The On-Balance Volume (OBV) and Volume Weighted Average Price (VWAP) are popular volume indicators for swing traders, helping assess market momentum.
Which RSI Indicator Is Popular for Swing Trading?
The standard 14-period RSI is widely used. Swing traders often adjust it to shorter periods (e.g., 7) for faster signals or longer periods (e.g., 21) for smoother trends.
This article represents the opinion of the Companies operating under the FXOpen brand only. It is not to be construed as an offer, solicitation, or recommendation with respect to products and services provided by the Companies operating under the FXOpen brand, nor is it to be considered financial advice.

Leap for AMD to the upside?OptionsMastery:
🔉Sound on!🔉
📣Make sure to watch fullscreen!📣
Thank you as always for watching my videos. I hope that you learned something very educational! Please feel free to like, share, and comment on this post. Remember only risk what you are willing to lose. Trading is very risky but it can change your life!

EURJPY Will Move Lower! Sell!
Take a look at our analysis for EURJPY.
Time Frame: 1D
Current Trend: Bearish
Sentiment: Overbought (based on 7-period RSI)
Forecast: Bearish
The market is on a crucial zone of supply 162.022.
The above-mentioned technicals clearly indicate the dominance of sellers on the market. I recommend shorting the instrument, aiming at 159.493 level.
P.S
We determine oversold/overbought condition with RSI indicator.
When it drops below 30 - the market is considered to be oversold.
When it bounces above 70 - the market is considered to be overbought.
Disclosure: I am part of Trade Nation's Influencer program and receive a monthly fee for using their TradingView charts in my analysis.
Like and subscribe and comment my ideas if you enjoy them!

Swing Trading: Unique Features and StrategiesSwing Trading: Unique Features and Strategies
Swing trading stands out as a dynamic approach in the trading world, blending elements of both short-term and long-term strategies. In this article, we will explore the unique features of swing trading, including its reliance on technical analysis, the use of chart patterns, and the strategic timing of entries and exits. Whether you're new to trading or seeking to refine your approach, understanding the nuances of swing trading can provide valuable insights into navigating the financial markets.
The Basics of Swing Trading
Swing trading meaning refers to a style that involves holding short- and medium-term positions - usually from a couple of days to a few weeks - with the aim of capitalising on the “swings” in the market.
What is a swing trader? A swing trader’s definition is simple: swing traders are those who typically enter and exit markets at significant support and resistance levels, hoping to capture the bulk of expected moves.
These traders tend to look at hourly to weekly charts to guide their entries, although the timeframe used will depend on the swing trader’s individual approach and the asset being traded. Swing trading can be used across all asset classes, from stocks and forex to cryptocurrencies* and commodities. In the stock market, swing trading can be especially effective, as stocks tend to experience high volatility and are subject to frequent news and events that can drive prices.
Swing traders predominantly use technical analysis to determine their entries and exits, but fundamental analysis, like comparing the interest rates of two economies, can also play a significant role. It can help determine a price direction over the course of days or weeks.
Swing Trading vs Other Styles
To better understand the unique features of swing trading, let’s compare it with our styles.
Position trading involves holding trades for weeks and months, focusing on capturing long-term trends. Position traders are less concerned with short-term fluctuations and are more likely to use fundamental analysis, such as economic data and company earnings, to make their decisions. This style requires patience and a long-term perspective, with fewer trades but potentially larger returns per trade.
Swing trading involves holding trades for several days to a few weeks, aiming to capture short- and medium-term price movements within a larger trend. This style balances the need for active market participation with the flexibility to not monitor trades constantly. Swing traders primarily rely on technical analysis to identify entry and exit points, focusing on chart patterns and indicators.
Day trading requires traders to buy and sell assets within the same trading day, often holding positions for just minutes or hours. The goal is to capitalise on intraday price movements, and traders close all positions before the market closes to avoid overnight risk. This style demands constant market monitoring and quick decision-making, with a strong reliance on real-time technical analysis.
Scalping is an ultra-short-term trading style where positions are held for seconds to minutes, aiming to make small profits on numerous trades throughout the day. Scalpers rely almost entirely on technical analysis and need to act quickly, often executing dozens or hundreds of trades daily. The focus is on high-frequency trading with very tight stop-losses, requiring intense concentration.
Swing Trading: Benefits and Challenges
Although swing trading provides numerous opportunities which makes it popular among traders, it comes with a few challenges traders should be aware of.
Benefits:
- Lower Time Commitment. One of the most significant benefits for swing traders is the reduced time commitment. This style can be adapted to suit a trader’s individual schedule.
- Flexibility. It is often more flexible than other styles. Not only does it offer time flexibility, but it allows for a wider range of tools to be used to determine price swings. Also, it can be applied to many assets. The most common is swing trading in forex and swing trading in stocks.
- Technical Analysis Focus: Utilises technical indicators and chart patterns to identify entry and exit points, providing clear criteria for decision-making.
- More Opportunities Compared to Long-Term Techniques. Because swing traders usually hold positions for a few days to a few weeks, they have the ability to take advantage of shorter-term market movements that might not be reflected in longer-term price trends.
Challenges:
- Exposure to Overnight Risk. Positions held overnight or over weekends can be affected by unexpected news or events, leading to potential gaps or adverse price movements.
- Requires Patience: Effective swing trading requires waiting for trades to develop over days or weeks, which may test a trader's patience.
- Market Volatility: Performance can be impacted by periods of low volatility or choppy markets, where price movements may not align with your expectations.
Popular Tools to Use When Swing Trading
The effectiveness of a swing traders’ strategies will ultimately depend on their ability to correctly identify price movements. For this, traders use different chart patterns and technical indicators. Here are three common tools that can be used as part of a swing trading strategy.
Channels
Traders can use channels to take advantage of well-identified price trends that play out over days and weeks. To plot a channel, you first need to identify a trending asset that’s moving in a relative zig-zag pattern rather than one with large jumps in price. Traders will often use the channel to open a swing trade in the direction of the trend; in the example above, they might look to buy when the price tests the lower line and take profit when the price touches the upper line of the channel.
Moving Averages
Moving averages (MAs) are one of the commonly used indicators and they can help swing traders determine the direction of the trend at a glance. The options here are endless:
- You could pair fast and slow moving averages and wait for the two to cross; this is known as a moving average crossover. When a shorter MA crosses above a longer one, the price is expected to rise. Conversely, when a shorter MA breaks below a longer one, the price is supposed to decline.
- You could stick with one and observe whether the price is above or below its average to gauge the trend. When the price is above the MA, it’s an uptrend; when it’s below the MA, it’s a downtrend.
- You could use an MA as a support or resistance level, placing a buy order when the price falls to the MA in an uptrend and a sell order when it rises to the MA in a downtrend.
Fibonacci Retracements
Lastly, many swing traders look to enter pullbacks in a larger trend. One of the most popular ways to identify entry levels during these pullbacks is the Fibonacci Retracement tool. Traders typically wait for a shift in price direction, then apply the tool to a swing high and swing low. Then, they enter at a pullback, usually to the 0.5 or 0.618 levels, to take advantage of the continuation of the trend. As seen above, this strategy can offer entry points for those looking to get in early before a trend continues.
The Bottom Line
Swing trading stands out for its ability to balance the demands of active trading with the flexibility of longer-term investing. The unique features of swing trading, such as its moderate holding periods and strategic use of technical indicators, allow traders to potentially manage risk and adapt to various market conditions. Embracing swing trading strategies can help traders refine their approach. As with any trading style, continued learning and disciplined execution are key to achieving consistent results.
FAQ
What Is Swing Trading?
Swing trading is a style that involves holding positions over a period of several days to weeks to take advantage of price movements within a trend. Swing traders use technical analysis, including chart patterns and indicators, to identify potential entry and exit points, balancing the need for active participation with a longer-term perspective.
What Is Swing Trading vs Day Trading?
Swing trading and day trading are distinct methods. The former focuses on capturing price movements over several days to weeks, allowing for less frequent trading and requiring less constant market monitoring. In contrast, the latter involves buying and selling assets within the same trading day, often holding positions for minutes or hours, and requires continuous market observation and quick decision-making.
What Is the Downside of Swing Trading?
The downsides of swing trading include exposure to overnight and weekend risks, as positions held outside market hours can be affected by unexpected news or events. Additionally, this method requires patience and discipline, as trades may take time to develop, and performance can be impacted by periods of low volatility or choppy markets.
*Important: At FXOpen UK, Cryptocurrency trading via CFDs is only available to our Professional clients. They are not available for trading by Retail clients. To find out more information about how this may affect you, please get in touch with our team.
This article represents the opinion of the Companies operating under the FXOpen brand only. It is not to be construed as an offer, solicitation, or recommendation with respect to products and services provided by the Companies operating under the FXOpen brand, nor is it to be considered financial advice.

Bullish swing on DELL?🔉Sound on!🔉
📣Make sure to watch fullscreen!📣
Thank you as always for watching my videos. I hope that you learned something very educational! Please feel free to like, share, and comment on this post. Remember only risk what you are willing to lose. Trading is very risky but it can change your life!

SOXL Has Room to Run?This one has a double bottom look, with a higher low, and another 4% remaining to hit take profit enroute to retesting the neckline before breaking out (another 8% from here) or balance and fail! Stop loss of 5% is pretty steep, so typically I either lower my position size or stop loss. Even at 4% stop loss, according to backtest results this wins more than it loses and has done pretty decent in the past, as I have been forward testing this model for over the past 18 months and profiting from over 100 different equities that I signal on.
The King Trading Momentum Strategy combines the 5 EMA crossing above the 13 EMA, RSI strength, favorable momentum as measured by ADX plus evaluating recent volume changes! SOXL and over 100 equities are built into this script with optimal backtest take profits and stop losses and can be toggled on by simply checking a box (default they are turned off). Check out my script, as I am always looking for people to help test and I am always interested in feedback...

EPL Ltd Breakout Alert: 52-Week High + Bullish Momentum! Ready f📈 EPL Ltd (EPL) is showing explosive bullish momentum and has recently achieved a 52-week breakout, positioning it for potential short-term gains. Here’s why EPL should be on your radar:
🔑 Key Technical Highlights:
Bullish Marubozu Candle: Strong buyer dominance, signaling a solid uptrend.
RSI Breakout (63): Momentum is building; watch for continued upward pressure.
Volume Breakout: Price surge supported by heavy volume—confirming buyer interest.
Donchian Bands: New highs suggest further breakout potential ahead.
Bollinger Bands: Positive breakout confirms the strength of the current trend.
Stochastic (94) & CCI (195): Strong overbought levels indicate market strength.
MACD Bullish Crossover: A confirmed bullish signal, pointing to sustained upward movement.
200 EMA: Price above the EMA, and both price and moving averages are trending up, showing a strong uptrend.
Bullish Candlestick Patterns:
🔥 Long White Candles across the Daily, Weekly, and Monthly timeframes indicate consistent bullish pressure and potential for further upward movement.
Why This Could Be a Great Trade:
Possible Swing Trade: Targeting short-term profits with strong bullish indicators.
Possible BTST (Buy Today, Sell Tomorrow): Perfect setup for quick gains.
📢 Don’t miss out on this breakout opportunity – EPL is trending upward, and the momentum is strong! 💥
🚀 Are you ready to take action?
💬 Share your thoughts, predictions, or trade setups in the comments below!
🔔 Follow for daily stock analysis and stay ahead of the market.
Possible levels to watch out : 324-360-396-432

Trade Idea -- Starbucks Corporation (SBUX)SBUX is testing a significant resistance level, as illustrated by the horizontal consolidation pattern in the chart. A breakout above this level could suggest the start of an upward trend, especially if volume picks up. Watching the stock’s interaction with the moving averages and Bollinger Bands will be crucial in assessing the strength and sustainability of any potential breakout.

SCHAEFFLER Swing Trade, Price is taking support from 50 EMASCHAEFFLER is taking support from 50 EMA in Weekly Chart. (For Swing Trade)
We can go for long swing trade only after price going above 3530 with approx. 6% stoploss and 24% Target.
Risk-Reward = 1:4
Plan your quantity/investment accordingly.
Note : Its just an analysis, wait for the price to confirm.
Disclaimer : Always follow risk to reward, this is the only key to success in market, no matter how much good a trade is looking we never know the future.

GBPUSD ANALYSISAfter seeing GU reject a daily trendline area of resistance for a retracement, we could see price continue to the upside after reaching into the Fibonacci 61.8%

POPCAT: Our Next Crypto Swing PlayIt's been a while since we posted any crypto swing trades. The last few months have been particularly challenging for swing plays, and we made very good profits just by scalping in August. However, we've been closely monitoring the higher time frames, and we believe we've found a potential play with POPCAT.
For this trade to work out, we need BTC to behave, but so far, everything looks good, and the depth of the retracement is consistent with prior pullbacks. Recently, POPCAT has shown a change in structure after what seems to be a completed Wave (2). We want to bid on this continuation with a wider stop loss because there's a 12H FVG below that is relatively important for altcoins. There's a chance that we tag this FVG before rising higher, though a body close below it would invalidate our bullish outlook. Therefore, we're cautious but still want to place this bid, and we will DCA down if necessary. We'll keep you updated whenever we make any moves.
As for targets, we're looking to go above the high of the latest COS, then the fair value gap above, and finally, a continuation above the current Wave (1). If we get this far, we would let it run as a moonbag, but we'll keep you informed regardless.

Coinbase (COIN): Anticipating the Next Big MoveNearly five months ago, we shared our last analysis on Coinbase, predicting a 30-40% drop.
And guess what? We saw a 40% decline. At that time, many were bullish on COIN and the broader crypto market, but we opted to wait and watch. In hindsight, this cautious approach was clearly the right move, especially given the higher time frame of our analysis.
Since then, we've climbed out of that zone, and everything seems to be progressing well. We're now looking for a 5-wave structure to the upside to complete Wave 5 and, consequently, the first cycle. Our target range for COIN lies somewhere between $286 and $412, but we believe the most likely range is between $290 and $325.
Currently, we have some swing positions open in cryptos, and we're not looking to enter Coinbase at this moment. However, either in the near or distant future, we plan to make a move. Specifically, our target for the big Wave (2) is the imbalance between $160 and $115, but it’s still a long journey before we reach those levels.

KNRCON Have Broken All Time High Giving Target of Around 25%NSE:KNRCON
BUSSINESS OVERVIEW
One of the leading companies providing Engineering, Procurement and
Construction (EPC) services.
Major Projects in Roads & Highways – one of the fast-growing sectors
Established presence in Irrigation and Urban Water Infrastructure Management
25+ years of experience of project execution
Successfully executed more than ~8,700 lane km Road Projects
Projects executed across 12 states in India
Portfolio of BOT/HAM Projects
668 lane Kms Projects in the state of Telangana, Karnataka & Bihar
2 Annuity based Projects, 1 Toll based project and 8 HAM based projects
8 HAM based projects with total Bid Project cost of Rs. 96,188 million
Strong EPC Order Book
Total Orderbook as on 31st March 2024 53,048 cr.
₹ 31,980 Mn
Roads Sector
₹ 21,068 Mn
Irrigation and Pipeline Sector
Recently Won Projects
Construction of Access Controlled four laning with paved shoulder from
Mysore to Kushalnagara Section of NH-275 on Hybrid Annuity Mode
under NH(O) in the State of Karnataka (Package IV) worth of 5750 CR.
Construction of Access Controlled four laning with paved shoulder from
Mysore to Kushalnagara Section of NH-275 under NH(O) in the State of
Karnataka (Package V) worth of 6250 CR.
1. Project Execution Capabilities
19
SIGNIFICANT EXPERIENCE AND STRONG TRACK RECORD IN TIMELY EXECUTION OF PROJECTS
Top management’s active involvement at all stages of Project execution
Selection of Major Raw Material
Selection of construction Camp location
Faster Decision making to ensure project completion on schedule
Received Bonus for completion of construction ahead of schedule

FINEORG: 3 Technical Possibilities 👌Okay, This one was requested by @Saikumarvsk
The Chart should tell you everything you need to know. But here are some specific pointers:
- The price looks to be in a consolidation mood
- We have a support trendline at play
- The Support and resistance zones are clearly marked
- The Psy. levels, 5000 and 4000 are positioned near the support and resistance. They will add to the strength of respective zones.
- The price is trading below the 200EMA on daily TF
- The MACD shows a slowdown but no bearish crossover yet
- It is too early to predict future price action at this point but below are some technical possibilities.
- Before we go there, Would you give us a boost for motivation? The more you like our posts, the more we will post.
1. ascending triangle scenario
2. Sideways consolidation.
If the price takes this route, The breakdown of the support trendline may not have much impact on the momentum.
3. Breakout of either zone (support or resistance zone).
A break and close above or below the zone may trigger a good momentum.
What is your take on Fine Organic?
Have Requests, Questions, or Suggestions? DM us or comment below.👇
⚠️Disclaimer: We are not registered advisors. The views expressed here are merely personal opinions. Irrespective of the language used, Nothing mentioned here should be considered as advice or recommendation. Please consult with your financial advisors before making any investment decisions. Like everybody else, we too can be wrong at times ✌🏻

HeroMotocop-Bullish swing signs NSE:HEROMOTOCO
Buy Above 5608
Target 1- 5850
Target 2-6135
Stop Loss: 5410
Inside candle breakout
Rejection from 0.5 Fibonacci & crossed above 0.382
Rejection from big Fair value gap
Volume are lower during retracement
21 EMA Rejection & above 50 EMA
Happy Trading!!

Marathon (MARA) - Breakout and Upward MomentumMarathon Digital Holdings has been trading sideways for an extended period after our last analysis. The stock formed an equal high, dipped again, but consistently held around the High Volume Node Edge Point at approximately $20. Following the latest retest of the $20 level, MARA has broken out upwards, leaving a breakout gap behind. Today's 19% increase indicates strong upward momentum.
Key observations include the breakout gap, which may be retested. This retest could provide a good entry point if the price holds above the gap. The $20 level has proven to be a strong support area, consistently holding the price during the sideways movement. The recent strong movement and potential bottom formation at $14.23 indicate a possible end to the downward trend. A push above the $25 level would provide stronger confirmation of the bullish trend and indicate a clear breakout from the previous range.

VTL: Breakout - retest - Continuation?The chart is self-explanatory as always :)
Want to request a specific analysis? Check our bio for details.
⚠️Disclaimer: We are not registered advisors. The views expressed here are merely personal opinions. Irrespective of the language used, Nothing mentioned here should be considered as advice or recommendation. Please consult with your financial advisors before making any investment decisions. Like everybody else, we too can be wrong at times ✌🏻

HDFCBANK: A technical outlookThe chart is pretty self-explanatory as always :)
What do you make of this price action?
Have Requests, Questions, or Suggestions? DM us or comment below.👇
⚠️Disclaimer: We are not registered advisors. The views expressed here are merely personal opinions. Irrespective of the language used, Nothing mentioned here should be considered as advice or recommendation. Please consult with your financial advisors before making any investment decisions. Like everybody else, we too can be wrong at times ✌🏻

Swing Trading - Using Market Side and Opening Range FiltersSwing trading is a short-term strategy where traders aim to capitalise on small price movements within a financial instrument over a specific period. The goal is to capture gains from these "swings" in the market rather than focusing on long-term trends.
In this example, I am trading the GBP/JPY using the market side and the session opening range as filters to determine high probability trading direction:
Market Side: This helps to identify the overall trend or sentiment in the market.
Session Opening Range: This is the price range between the high and low during the initial period after the market opens. It is used to set reference points for potential entry and exit levels.
Here's a simple breakdown:
Below the Market Side and Opening Range: If the price is below both the market side indicator and the opening range, this signals a bearish sentiment, and you look for selling opportunities.
Above the Market Side and Opening Range: If the price is above both the market side indicator and the opening range, this indicates a bullish sentiment, and you look for buying opportunities.
I use the Charts247_WT Custom Indicator Candles for entries and exits, which provide specific signals to enter trades and exit existing positions. This combination of trend filters and entry signals helps improve your trades' accuracy and timing, aligning your actions with the broader market context.

GUJARAT GAS: Gap filling due??The chart is pretty self-explanatory as always. But as usual, Below are some good-to-know pointers.
- The price has been stuck in a range for about a year now
- The support zone is holding up. But for how long, we do not know.
- The best case scenario will be the break of the support inviting sellers followed by filling of the long due gap and a recovery. Again, this is a scenario, not a prediction.
- If the support holds, We will see a good up move only when the crucial resistance zone is broken and the price sustains above it.
- Weekly Moving averages have negativity written all over them. The 50EMA has crossed 100EMA. The price is trading close to 200EMA after taking support from it.
What do you make of this price action?
Have Requests, Questions, or Suggestions? DM us or comment below.👇
⚠️Disclaimer: We are not registered advisors. The views expressed here are merely personal opinions. Irrespective of the language used, Nothing mentioned here should be considered as advice or recommendation. Please consult with your financial advisors before making any investment decisions. Like everybody else, we too can be wrong at times ✌🏻
