GBPUSD Will Fall! Sell!
Here is our detailed technical review for GBPUSD.
Time Frame: 6h
Current Trend: Bearish
Sentiment: Overbought (based on 7-period RSI)
Forecast: Bearish
The market is approaching a significant resistance area 1.349.
Due to the fact that we see a positive bearish reaction from the underlined area, I strongly believe that sellers will manage to push the price all the way down to 1.341 level.
P.S
The term oversold refers to a condition where an asset has traded lower in price and has the potential for a price bounce.
Overbought refers to market scenarios where the instrument is traded considerably higher than its fair value. Overvaluation is caused by market sentiments when there is positive news.
Disclosure: I am part of Trade Nation's Influencer program and receive a monthly fee for using their TradingView charts in my analysis.
Like and subscribe and comment my ideas if you enjoy them!
Swing

EURNZD Will Go Higher From Support! Buy!
Take a look at our analysis for EURNZD.
Time Frame: 1h
Current Trend: Bullish
Sentiment: Oversold (based on 7-period RSI)
Forecast: Bullish
The market is on a crucial zone of demand 1.922.
The oversold market condition in a combination with key structure gives us a relatively strong bullish signal with goal 1.930 level.
P.S
We determine oversold/overbought condition with RSI indicator.
When it drops below 30 - the market is considered to be oversold.
When it bounces above 70 - the market is considered to be overbought.
Disclosure: I am part of Trade Nation's Influencer program and receive a monthly fee for using their TradingView charts in my analysis.
Like and subscribe and comment my ideas if you enjoy them!

GOLD Will Go Down From Resistance! Short!
Please, check our technical outlook for GOLD.
Time Frame: 1h
Current Trend: Bearish
Sentiment: Overbought (based on 7-period RSI)
Forecast: Bearish
The price is testing a key resistance 3,373.02.
Taking into consideration the current market trend & overbought RSI, chances will be high to see a bearish movement to the downside at least to 3,354.03 level.
P.S
Overbought describes a period of time where there has been a significant and consistent upward move in price over a period of time without much pullback.
Disclosure: I am part of Trade Nation's Influencer program and receive a monthly fee for using their TradingView charts in my analysis.
Like and subscribe and comment my ideas if you enjoy them!

EURJPY Is Going Up! Long!
Please, check our technical outlook for EURJPY.
Time Frame: 4h
Current Trend: Bullish
Sentiment: Oversold (based on 7-period RSI)
Forecast: Bullish
The price is testing a key support 166.677.
Current market trend & oversold RSI makes me think that buyers will push the price. I will anticipate a bullish movement at least to 167.654 level.
P.S
The term oversold refers to a condition where an asset has traded lower in price and has the potential for a price bounce.
Overbought refers to market scenarios where the instrument is traded considerably higher than its fair value. Overvaluation is caused by market sentiments when there is positive news.
Disclosure: I am part of Trade Nation's Influencer program and receive a monthly fee for using their TradingView charts in my analysis.
Like and subscribe and comment my ideas if you enjoy them!

GBPUSD Is Very Bearish! Sell!
Take a look at our analysis for GBPUSD.
Time Frame: 5h
Current Trend: Bearish
Sentiment: Overbought (based on 7-period RSI)
Forecast: Bearish
The market is testing a major horizontal structure 1.357.
Taking into consideration the structure & trend analysis, I believe that the market will reach 1.351 level soon.
P.S
The term oversold refers to a condition where an asset has traded lower in price and has the potential for a price bounce.
Overbought refers to market scenarios where the instrument is traded considerably higher than its fair value. Overvaluation is caused by market sentiments when there is positive news.
Disclosure: I am part of Trade Nation's Influencer program and receive a monthly fee for using their TradingView charts in my analysis.
Like and subscribe and comment my ideas if you enjoy them!

GBPJPY Will Go Lower! Short!
Here is our detailed technical review for GBPJPY.
Time Frame: 6h
Current Trend: Bearish
Sentiment: Overbought (based on 7-period RSI)
Forecast: Bearish
The market is approaching a significant resistance area 196.531.
Due to the fact that we see a positive bearish reaction from the underlined area, I strongly believe that sellers will manage to push the price all the way down to 195.203 level.
P.S
Overbought describes a period of time where there has been a significant and consistent upward move in price over a period of time without much pullback.
Disclosure: I am part of Trade Nation's Influencer program and receive a monthly fee for using their TradingView charts in my analysis.
Like and subscribe and comment my ideas if you enjoy them!

GOLD[XAUUSD]: Breakthrough the bearish pressure, What next?Evening Everyone,
Hope you are doing great, price recently breakthrough the current price inducement, showing a strong bullish volume emerging in the market. Long term approach remain bullish ultimately taking the price towards the new high.
Good luck
Team Setupsfx_

SILVER Is Very Bullish! Long!
Take a look at our analysis for SILVER.
Time Frame: 4h
Current Trend: Bullish
Sentiment: Oversold (based on 7-period RSI)
Forecast: Bullish
The market is testing a major horizontal structure 3,603.0.
Taking into consideration the structure & trend analysis, I believe that the market will reach 3,697.2 level soon.
P.S
Overbought describes a period of time where there has been a significant and consistent upward move in price over a period of time without much pullback.
Disclosure: I am part of Trade Nation's Influencer program and receive a monthly fee for using their TradingView charts in my analysis.
Like and subscribe and comment my ideas if you enjoy them!

USDJPY Is Going Down! Short!
Please, check our technical outlook for USDJPY.
Time Frame: 12h
Current Trend: Bearish
Sentiment: Overbought (based on 7-period RSI)
Forecast: Bearish
The market is approaching a key horizontal level 145.574.
Considering the today's price action, probabilities will be high to see a movement to 144.101.
P.S
Please, note that an oversold/overbought condition can last for a long time, and therefore being oversold/overbought doesn't mean a price rally will come soon, or at all.
Disclosure: I am part of Trade Nation's Influencer program and receive a monthly fee for using their TradingView charts in my analysis.
Like and subscribe and comment my ideas if you enjoy them!

EURUSD Will Go Lower! Sell!
Here is our detailed technical review for EURUSD.
Time Frame: 1h
Current Trend: Bearish
Sentiment: Overbought (based on 7-period RSI)
Forecast: Bearish
The market is trading around a solid horizontal structure 1.148.
Taking into consideration the structure & trend analysis, I believe that the market will reach 1.143 level soon.
P.S
Please, note that an oversold/overbought condition can last for a long time, and therefore being oversold/overbought doesn't mean a price rally will come soon, or at all.
Disclosure: I am part of Trade Nation's Influencer program and receive a monthly fee for using their TradingView charts in my analysis.
Like and subscribe and comment my ideas if you enjoy them!

AUDUSD Will Go Down! Short!
Take a look at our analysis for AUDUSD.
Time Frame: 4h
Current Trend: Bearish
Sentiment: Overbought (based on 7-period RSI)
Forecast: Bearish
The market is testing a major horizontal structure 0.646.
Taking into consideration the structure & trend analysis, I believe that the market will reach 0.643 level soon.
P.S
The term oversold refers to a condition where an asset has traded lower in price and has the potential for a price bounce.
Overbought refers to market scenarios where the instrument is traded considerably higher than its fair value. Overvaluation is caused by market sentiments when there is positive news.
Disclosure: I am part of Trade Nation's Influencer program and receive a monthly fee for using their TradingView charts in my analysis.
Like and subscribe and comment my ideas if you enjoy them!

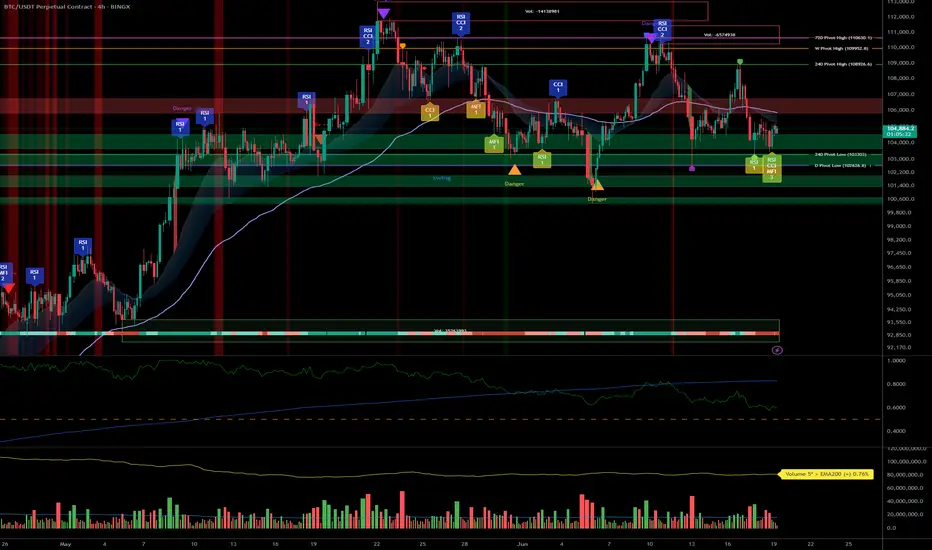
BTC – Bullish bias under review: 102k/103k supports in focus__________________________________________________________________________________
Technical Overview – Summary Points
__________________________________________________________________________________
Momentum : Dominant on all major timeframes (1D, 12H, 6H, 4H). Risk On / Risk Off Indicator signals STRONG BUY except on 15min (neutral).
Support/Resistance : Structurally key pivot zone 102k–106k; major supports 102k/103k. Potential breakout above 106k (swing target 109k).
Volumes : Normal across all timeframes. No excess signals, no accumulation/capitulation peaks.
Multi-TF Behaviors : Horizontal consolidation with bullish dominance. Short-term bearish divergence on 2H–15min, micro-TF in correction only, no panic.
__________________________________________________________________________________
Strategic Summary
__________________________________________________________________________________
Global Bias : Solid bullish structure as long as 102k/103k hold. “Risk On” maintained by sector outperformance.
Opportunities : Entries on pullback/main base 103k–104k; breakouts to watch above 106k.
Risk Zones : Clear invalidation <102k, potential rapid flush to 97k–88k; keep strict stop-loss below 102.5k.
Macro Catalysts : FOMC, Fed projections, Middle East geopolitics keep volatility high, but no shock. Price action leads near-term strategy.
Action Plan : Swing buy on confirmed support, dynamic hedge post-news, monitor volumes/closures on key pivots.
__________________________________________________________________________________
Multi-Timeframe Analysis
__________________________________________________________________________________
1D : Bullish momentum, major supports intact (102k/105k). Risk On / Risk Off Indicator = STRONG BUY, stable volume, no excess. Healthy structure for long swings.
12H : Positive bias, range 102.6k–106k. Risk On / Risk Off Indicator = STRONG BUY.
6H : Presumed accumulation 103k–106k, momentum still strong. No volume weakness.
4H : Range oscillation, structural support test at 103k. Sector outperformance, neutral volume.
2H : First sign of short-term weakness. Divergent with higher TFs but no panic.
1H : Technical rebound towards 104.8k possible as long as 103k support holds.
30min : Short-term trend remains bearish (trend 30min = down). Correction/purge ongoing.
15min : Neutral momentum, supports being tested. No panic or melt-down observed.
Summary : Strong bullish confluence on higher TFs, temporary divergence on micro-TFs. “Range with bullish bias” scenario as long as 102k/103k holds the structure.
__________________________________________________________________________________
Macro and Fundamental Analysis
__________________________________________________________________________________
FED/FOMC (June 18) : Rates unchanged, “data dependent” guidance. Raised volatility but no risk-off shift.
Market Sentiment : BTC technical structure holds, moderate post-FOMC volatility.
S&P500 : Above all key moving averages. Sector momentum (software, uranium, semis) remains dominant.
Energy Level : Weak oil = little macro pressure against BTC.
Geopolitics : Israel–Iran escalation / US posture reinforced. High FX/oil volatility but BTC resilient (>102k), no panic on record.
Economic Calendar : Closely watching BoE & SNB, but low BTC impact odds.
Implications : Post-news phase = ideal for range trading, no rupture event expected within 48h.
__________________________________________________________________________________
Strategic synthesis & R/R guidance
__________________________________________________________________________________
Long on pullback 103–104k, swing targets 106/109k. Optimal R/R (>2.5) if stop 102.5k (D Pivot Low).
Invalidation area : Clean close <102k or heavy downside volume (capitulation via ISPD/volumes).
Risk Management : Dynamic stops, partial hedge post-FOMC during macro volatility.
Conclusion : Bullish structure preserved. Range trading scenario dominant, no extreme signals or panic. Actions: support watch, technical buy on confirmed pullback.
US30 Is Bearish! Sell!
Here is our detailed technical review for US30.
Time Frame: 12h
Current Trend: Bearish
Sentiment: Overbought (based on 7-period RSI)
Forecast: Bearish
The market is approaching a significant resistance area 42,254.4.
Due to the fact that we see a positive bearish reaction from the underlined area, I strongly believe that sellers will manage to push the price all the way down to 41,307.3 level.
P.S
Overbought describes a period of time where there has been a significant and consistent upward move in price over a period of time without much pullback.
Disclosure: I am part of Trade Nation's Influencer program and receive a monthly fee for using their TradingView charts in my analysis.
Like and subscribe and comment my ideas if you enjoy them!

ETHUSD Is Very Bullish! Buy!
Take a look at our analysis for ETHUSD.
Time Frame: 10h
Current Trend: Bullish
Sentiment: Oversold (based on 7-period RSI)
Forecast: Bullish
The market is on a crucial zone of demand 2,508.60.
The oversold market condition in a combination with key structure gives us a relatively strong bullish signal with goal 2,717.66 level.
P.S
Please, note that an oversold/overbought condition can last for a long time, and therefore being oversold/overbought doesn't mean a price rally will come soon, or at all.
Disclosure: I am part of Trade Nation's Influencer program and receive a monthly fee for using their TradingView charts in my analysis.
Like and subscribe and comment my ideas if you enjoy them!

GBPJPY Will Fall! Short!
Here is our detailed technical review for GBPJPY.
Time Frame: 9h
Current Trend: Bearish
Sentiment: Overbought (based on 7-period RSI)
Forecast: Bearish
The market is trading around a solid horizontal structure 194.806.
The above observations make me that the market will inevitably achieve 193.727 level.
P.S
We determine oversold/overbought condition with RSI indicator.
When it drops below 30 - the market is considered to be oversold.
When it bounces above 70 - the market is considered to be overbought.
Disclosure: I am part of Trade Nation's Influencer program and receive a monthly fee for using their TradingView charts in my analysis.
Like and subscribe and comment my ideas if you enjoy them!

GOLD Will Go Higher From Support! Buy!
Take a look at our analysis for GOLD.
Time Frame: 9h
Current Trend: Bullish
Sentiment: Oversold (based on 7-period RSI)
Forecast: Bullish
The market is testing a major horizontal structure 3,395.19.
Taking into consideration the structure & trend analysis, I believe that the market will reach 3,467.28 level soon.
P.S
Overbought describes a period of time where there has been a significant and consistent upward move in price over a period of time without much pullback.
Disclosure: I am part of Trade Nation's Influencer program and receive a monthly fee for using their TradingView charts in my analysis.
Like and subscribe and comment my ideas if you enjoy them!

AUDUSD Will Go Up From Support! Long!
Please, check our technical outlook for AUDUSD.
Time Frame: 2h
Current Trend: Bullish
Sentiment: Oversold (based on 7-period RSI)
Forecast: Bullish
The market is approaching a key horizontal level 0.653.
Considering the today's price action, probabilities will be high to see a movement to 0.657.
P.S
Please, note that an oversold/overbought condition can last for a long time, and therefore being oversold/overbought doesn't mean a price rally will come soon, or at all.
Disclosure: I am part of Trade Nation's Influencer program and receive a monthly fee for using their TradingView charts in my analysis.
Like and subscribe and comment my ideas if you enjoy them!

AUDJPY Will Go Higher! Buy!
Here is our detailed technical review for AUDJPY.
Time Frame: 6h
Current Trend: Bullish
Sentiment: Oversold (based on 7-period RSI)
Forecast: Bullish
The market is approaching a significant support area 94.496.
The underlined horizontal cluster clearly indicates a highly probable bullish movement with target 95.595 level.
P.S
The term oversold refers to a condition where an asset has traded lower in price and has the potential for a price bounce.
Overbought refers to market scenarios where the instrument is traded considerably higher than its fair value. Overvaluation is caused by market sentiments when there is positive news.
Disclosure: I am part of Trade Nation's Influencer program and receive a monthly fee for using their TradingView charts in my analysis.
Like and subscribe and comment my ideas if you enjoy them!

GBPAUD Will Go Up! Long!
Take a look at our analysis for GBPAUD.
Time Frame: 2h
Current Trend: Bullish
Sentiment: Oversold (based on 7-period RSI)
Forecast: Bullish
The market is on a crucial zone of demand 2.074.
The oversold market condition in a combination with key structure gives us a relatively strong bullish signal with goal 2.083 level.
P.S
We determine oversold/overbought condition with RSI indicator.
When it drops below 30 - the market is considered to be oversold.
When it bounces above 70 - the market is considered to be overbought.
Disclosure: I am part of Trade Nation's Influencer program and receive a monthly fee for using their TradingView charts in my analysis.
Like and subscribe and comment my ideas if you enjoy them!

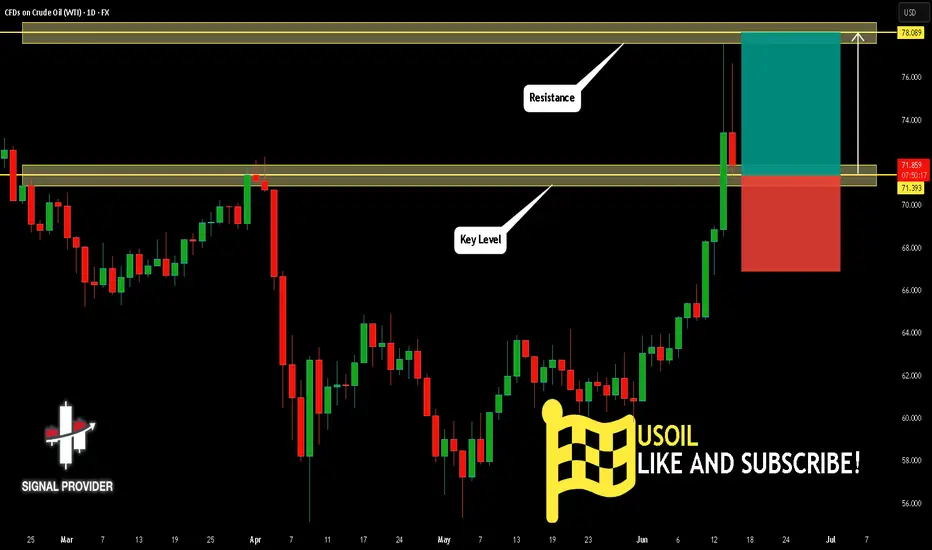
USOIL Will Move Higher! Buy!
Please, check our technical outlook for USOIL.
Time Frame: 1D
Current Trend: Bullish
Sentiment: Oversold (based on 7-period RSI)
Forecast: Bullish
The price is testing a key support 71.393.
Current market trend & oversold RSI makes me think that buyers will push the price. I will anticipate a bullish movement at least to 78.089 level.
P.S
Overbought describes a period of time where there has been a significant and consistent upward move in price over a period of time without much pullback.
Disclosure: I am part of Trade Nation's Influencer program and receive a monthly fee for using their TradingView charts in my analysis.
Like and subscribe and comment my ideas if you enjoy them!
EURUSD Is Bullish! Long!
Here is our detailed technical review for EURUSD.
Time Frame: 3h
Current Trend: Bullish
Sentiment: Oversold (based on 7-period RSI)
Forecast: Bullish
The market is trading around a solid horizontal structure 1.157.
The above observations make me that the market will inevitably achieve 1.165 level.
P.S
Please, note that an oversold/overbought condition can last for a long time, and therefore being oversold/overbought doesn't mean a price rally will come soon, or at all.
Disclosure: I am part of Trade Nation's Influencer program and receive a monthly fee for using their TradingView charts in my analysis.
Like and subscribe and comment my ideas if you enjoy them!

NZDCAD Is Going Down! Sell!
Take a look at our analysis for NZDCAD.
Time Frame: 1h
Current Trend: Bearish
Sentiment: Overbought (based on 7-period RSI)
Forecast: Bearish
The market is testing a major horizontal structure 0.825.
Taking into consideration the structure & trend analysis, I believe that the market will reach 0.822 level soon.
P.S
Overbought describes a period of time where there has been a significant and consistent upward move in price over a period of time without much pullback.
Disclosure: I am part of Trade Nation's Influencer program and receive a monthly fee for using their TradingView charts in my analysis.
Like and subscribe and comment my ideas if you enjoy them!

GOLD Is Very Bullish! Buy!
Please, check our technical outlook for GOLD.
Time Frame: 9h
Current Trend: Bullish
Sentiment: Oversold (based on 7-period RSI)
Forecast: Bullish
The market is approaching a key horizontal level 3,327.72.
Considering the today's price action, probabilities will be high to see a movement to 3,385.41.
P.S
Please, note that an oversold/overbought condition can last for a long time, and therefore being oversold/overbought doesn't mean a price rally will come soon, or at all.
Disclosure: I am part of Trade Nation's Influencer program and receive a monthly fee for using their TradingView charts in my analysis.
Like and subscribe and comment my ideas if you enjoy them!
