#DOGEUSDT: Swing Trade Targeting $0.50| Swing Trade| Setupsfx_|Hey there! Everyone
DOGEUSDT is at a turning point right now, and it looks like it might just reverse course and head towards its target price of $0.50. This is a swing trade, which means it could take a few weeks, or even months, to complete.
We’d really appreciate your support.
Thanks
Team Setupsfx_
Swingsetup

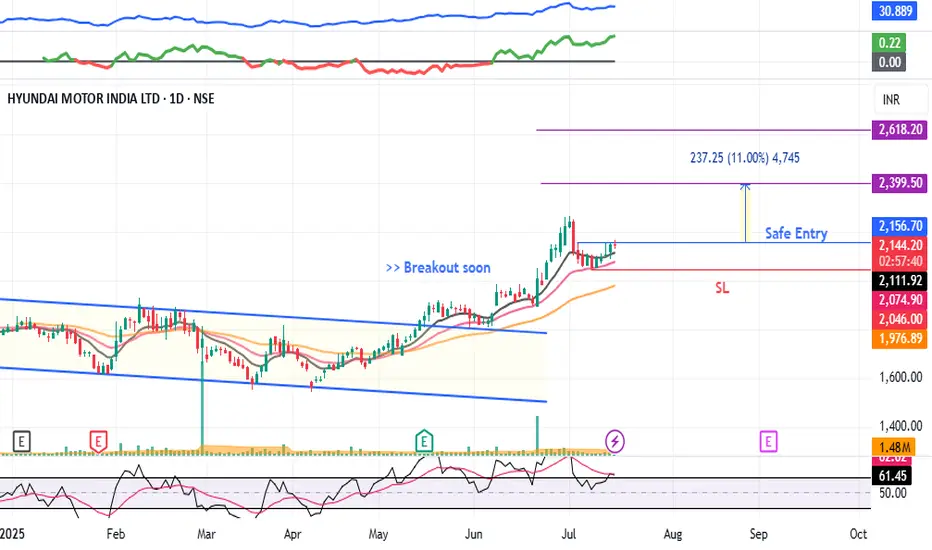
HYUNDAI - Swing Trade#HYUNDAI #swingtrade #trendingstock #momentumtrading #breakoutstock
HYUNDAI : Swing Trade
>> Breakout soon
>> Trending Stock
>> Volume Dried up
>> Good strength
>> Low Risk Trade ( RR - 1:2 or 1:3 )
Swing Traders can lock profit at 10% and keep trailing
Pls Boost, like and comment if u like the analysis
Disc: Charts shared are for Learning purpose, Take position only after consulting ur Financial Advisor or a SEBI Registered Advisor
Mount Fuji Series- Old runners waking upMount Fuji Series- Old runners waking up -
TARC - started running after 50-70 levels.. hope getting ready again.
Realty company with good land holding. Funda strong company.

HIMS 20SMA Trend Contiuation PULLBACK SETUP NYSE:HIMS – Momentum Reload at 20 SMA After Massive Run
NYSE:HIMS has been one of the hottest stocks in the market, and it’s giving us a textbook trend continuation pullback setup — right into the sweet spot.
🔹 Pullback to the 20 SMA
• After a huge run, NYSE:HIMS finally gave us a controlled pullback to the 20 SMA, where it based for multiple days.
• Today, it remounted the 9 EMA — a key trigger in my swing strategy for momentum re-entry.
🔹 Why This Setup Works
• Momentum names don’t stay down long — this was just a reset.
• Even with the market shaky today, NYSE:HIMS closed strong — up 8% while the rest of the tape faded.
• This setup is all about getting back into strength with low risk.
My Trade Plan:
1️⃣ Entry: Took a position on today’s remount of the 9 EMA.
2️⃣ Stop: Just under the 20 SMA — tight, well-defined risk.
3️⃣ Target: First target is a move back into the previous highs — if it breaks, we trail for continuation.
🧠 This is my bread-and-butter swing entry — clean, controlled, and full of momentum potential.

Equity Research Report – TIMKEN India Ltd 📌 CMP (May 2, 2025): ₹2,728
🧭 Sector: Industrial Bearings & Motion Solutions
📈 Signal: Breakout from falling channel with strong volume confirmation
🔹 Technical Summary
Breakout Pattern: Price has decisively broken out of a long-term falling channel after a 10-month downtrend.
Volume Spike: Breakout accompanied by significant volume spike (highest in over a year) – strong institutional interest.
Momentum: RSI has broken above resistance line (~55), confirming bullish momentum.
🧭 Trade Setup
✅ Buy Zone (Swing Trade/Positional)
Buy Above: ₹2,750
Target 1: ₹2,900
Target 2: ₹3,050
Target 3: ₹3,280
Stop-Loss: ₹2,490 (just below recent breakout candle)
Timeframe: 2–6 weeks
Risk-Reward Ratio: ~1:2.5 (good for swing setups)
🚫 Invalidation Level:
Breakdown and close below ₹2,490 on weekly timeframe.
For Education purposes only

Equity Research Report – Paras Defence & Space Tech Ltd Technical Summary
Volume Spike: Sharp surge in volume confirms breakout strength.
Resistance Flipped: ₹1,299 now acting as strong support.
Momentum: RSI near 75 (overbought but strong bullish trend), indicating short-term potential with caution.
Moving Averages: 20/50/200 EMA crossover in bullish alignment.
🛒 Trade Setup
Short-Term View (Swing/Positional Trade):
Buy Zone: ₹1,315–₹1,330 (on dip near support ₹1,299)
Target 1: ₹1,435
Target 2: ₹1,475
Stop-Loss: ₹1,255 (below support & 5-day EMA)
Timeframe: 2–3 weeks
Short-Term View (Swing/Positional Trade):
Sell Zone below: ₹1,299
Target 1: ₹1,222
Target 2: ₹1,200
Stop-Loss: ₹1,255
For Education purposes only

ASAHI SONGWON : Chart Pattern Breakout#ASAHISONG #cupandhandle #chartpattern #breakout #swingtrade #swingtrading
ASAHISONG : Swing Trade
>> Chart Pattern Breakout soon
>> Cup & Handle Visible
>> Volumes Dried up
>> Good Strength in Stock
Swing Traders can lock Profit at 10% and keep Trailing
Disc : Charts shared are for study Purpose & not a Trade Recommendation
Pls do uour Own Analysis or Consult ur Financial Advisor before taking any position, Dont go all in...plan ur Trades with Proper Position Sizing, Risk Management and clear plan.

U.S. Stock Swing TradeBRK.B
This stock remains one of the few in the U.S. market that continues to exhibit technical strength, maintaining a well-defined uptrend.
Current price action suggests a potential buy-on-dip opportunity near key support levels.
Entry Zone: 494 – 501
Take-Profit Target: 518 – 530
Stop Loss: 488
That said, it remains essential to closely monitor the S&P 500 index, along with prevailing macroeconomic developments, which continue to exert significant influence on market sentiment.

Possible Swing trade setup in Apollo HospitalPossible Swing trade setup in Apollo Hospital:
Note: This analysis is for educational purposes only, consult a qualified financial advisor before taking a trader.

Swing Trading: Unique Features and StrategiesSwing Trading: Unique Features and Strategies
Swing trading stands out as a dynamic approach in the trading world, blending elements of both short-term and long-term strategies. In this article, we will explore the unique features of swing trading, including its reliance on technical analysis, the use of chart patterns, and the strategic timing of entries and exits. Whether you're new to trading or seeking to refine your approach, understanding the nuances of swing trading can provide valuable insights into navigating the financial markets.
The Basics of Swing Trading
Swing trading meaning refers to a style that involves holding short- and medium-term positions - usually from a couple of days to a few weeks - with the aim of capitalising on the “swings” in the market.
What is a swing trader? A swing trader’s definition is simple: swing traders are those who typically enter and exit markets at significant support and resistance levels, hoping to capture the bulk of expected moves.
These traders tend to look at hourly to weekly charts to guide their entries, although the timeframe used will depend on the swing trader’s individual approach and the asset being traded. Swing trading can be used across all asset classes, from stocks and forex to cryptocurrencies* and commodities. In the stock market, swing trading can be especially effective, as stocks tend to experience high volatility and are subject to frequent news and events that can drive prices.
Swing traders predominantly use technical analysis to determine their entries and exits, but fundamental analysis, like comparing the interest rates of two economies, can also play a significant role. It can help determine a price direction over the course of days or weeks.
Swing Trading vs Other Styles
To better understand the unique features of swing trading, let’s compare it with our styles.
Position trading involves holding trades for weeks and months, focusing on capturing long-term trends. Position traders are less concerned with short-term fluctuations and are more likely to use fundamental analysis, such as economic data and company earnings, to make their decisions. This style requires patience and a long-term perspective, with fewer trades but potentially larger returns per trade.
Swing trading involves holding trades for several days to a few weeks, aiming to capture short- and medium-term price movements within a larger trend. This style balances the need for active market participation with the flexibility to not monitor trades constantly. Swing traders primarily rely on technical analysis to identify entry and exit points, focusing on chart patterns and indicators.
Day trading requires traders to buy and sell assets within the same trading day, often holding positions for just minutes or hours. The goal is to capitalise on intraday price movements, and traders close all positions before the market closes to avoid overnight risk. This style demands constant market monitoring and quick decision-making, with a strong reliance on real-time technical analysis.
Scalping is an ultra-short-term trading style where positions are held for seconds to minutes, aiming to make small profits on numerous trades throughout the day. Scalpers rely almost entirely on technical analysis and need to act quickly, often executing dozens or hundreds of trades daily. The focus is on high-frequency trading with very tight stop-losses, requiring intense concentration.
Swing Trading: Benefits and Challenges
Although swing trading provides numerous opportunities which makes it popular among traders, it comes with a few challenges traders should be aware of.
Benefits:
- Lower Time Commitment. One of the most significant benefits for swing traders is the reduced time commitment. This style can be adapted to suit a trader’s individual schedule.
- Flexibility. It is often more flexible than other styles. Not only does it offer time flexibility, but it allows for a wider range of tools to be used to determine price swings. Also, it can be applied to many assets. The most common is swing trading in forex and swing trading in stocks.
- Technical Analysis Focus: Utilises technical indicators and chart patterns to identify entry and exit points, providing clear criteria for decision-making.
- More Opportunities Compared to Long-Term Techniques. Because swing traders usually hold positions for a few days to a few weeks, they have the ability to take advantage of shorter-term market movements that might not be reflected in longer-term price trends.
Challenges:
- Exposure to Overnight Risk. Positions held overnight or over weekends can be affected by unexpected news or events, leading to potential gaps or adverse price movements.
- Requires Patience: Effective swing trading requires waiting for trades to develop over days or weeks, which may test a trader's patience.
- Market Volatility: Performance can be impacted by periods of low volatility or choppy markets, where price movements may not align with your expectations.
Popular Tools to Use When Swing Trading
The effectiveness of a swing traders’ strategies will ultimately depend on their ability to correctly identify price movements. For this, traders use different chart patterns and technical indicators. Here are three common tools that can be used as part of a swing trading strategy.
Channels
Traders can use channels to take advantage of well-identified price trends that play out over days and weeks. To plot a channel, you first need to identify a trending asset that’s moving in a relative zig-zag pattern rather than one with large jumps in price. Traders will often use the channel to open a swing trade in the direction of the trend; in the example above, they might look to buy when the price tests the lower line and take profit when the price touches the upper line of the channel.
Moving Averages
Moving averages (MAs) are one of the commonly used indicators and they can help swing traders determine the direction of the trend at a glance. The options here are endless:
- You could pair fast and slow moving averages and wait for the two to cross; this is known as a moving average crossover. When a shorter MA crosses above a longer one, the price is expected to rise. Conversely, when a shorter MA breaks below a longer one, the price is supposed to decline.
- You could stick with one and observe whether the price is above or below its average to gauge the trend. When the price is above the MA, it’s an uptrend; when it’s below the MA, it’s a downtrend.
- You could use an MA as a support or resistance level, placing a buy order when the price falls to the MA in an uptrend and a sell order when it rises to the MA in a downtrend.
Fibonacci Retracements
Lastly, many swing traders look to enter pullbacks in a larger trend. One of the most popular ways to identify entry levels during these pullbacks is the Fibonacci Retracement tool. Traders typically wait for a shift in price direction, then apply the tool to a swing high and swing low. Then, they enter at a pullback, usually to the 0.5 or 0.618 levels, to take advantage of the continuation of the trend. As seen above, this strategy can offer entry points for those looking to get in early before a trend continues.
The Bottom Line
Swing trading stands out for its ability to balance the demands of active trading with the flexibility of longer-term investing. The unique features of swing trading, such as its moderate holding periods and strategic use of technical indicators, allow traders to potentially manage risk and adapt to various market conditions. Embracing swing trading strategies can help traders refine their approach. As with any trading style, continued learning and disciplined execution are key to achieving consistent results.
FAQ
What Is Swing Trading?
Swing trading is a style that involves holding positions over a period of several days to weeks to take advantage of price movements within a trend. Swing traders use technical analysis, including chart patterns and indicators, to identify potential entry and exit points, balancing the need for active participation with a longer-term perspective.
What Is Swing Trading vs Day Trading?
Swing trading and day trading are distinct methods. The former focuses on capturing price movements over several days to weeks, allowing for less frequent trading and requiring less constant market monitoring. In contrast, the latter involves buying and selling assets within the same trading day, often holding positions for minutes or hours, and requires continuous market observation and quick decision-making.
What Is the Downside of Swing Trading?
The downsides of swing trading include exposure to overnight and weekend risks, as positions held outside market hours can be affected by unexpected news or events. Additionally, this method requires patience and discipline, as trades may take time to develop, and performance can be impacted by periods of low volatility or choppy markets.
*Important: At FXOpen UK, Cryptocurrency trading via CFDs is only available to our Professional clients. They are not available for trading by Retail clients. To find out more information about how this may affect you, please get in touch with our team.
This article represents the opinion of the Companies operating under the FXOpen brand only. It is not to be construed as an offer, solicitation, or recommendation with respect to products and services provided by the Companies operating under the FXOpen brand, nor is it to be considered financial advice.

Castrol India - Swing trading setup!Castrol India - Swing trading setup!
Note: This is not a trading recommendation. This analysis is for educational purposes only. We'll know in few days if the price moved as per the study.
It is not advisable to go long when the general market is trending low.

Deflationary Casino CoinI would not sleep on this token.
They buy back then 🔥 a portion of their total supply every hour.
With the MACD creeping back up on a 1D, it's showing some divergence. And it currently being oversold - hard to pass up the opportunity.
Bullish crypto market scenario leads us to 0.18
Conservative bearish outlook we still land around 0.11
Disclaimer: I am not affiliated with Rollbit and do not encourage anyone to gamble.

Wait for the Swing DownThis is tempting to buy, but patience is key with swing trading to reduce risk. Coming from the world of crypto, this seems like it would take an eternity (2years). But it helps to know the direction it's headed if you did want to scalp it in smaller time frames.
Green arrow represents the safer swing trade.
Orange arrow represents same bull trend but will still end up in that buy zone anyways.
No RSI divergence yet, and MACD still mostly above 0.

HOW-TO Swing Trade SolanaI take a much more conservative approach to trading - that's how the JSC - Swing Long is used. It simply finds extremely oversold moments (on larger time frames) and reaps the rewards. The strategy tester shows 82% win rate using this indicator, with an average 22.5% trade.
As of now, it's VERY close to triggering the BUY alert, but I can't be too hasty because of this bearish momentum we are seeing.
I am able to set alerts for this indicator, so as of now, I will wait for the BUY alert.
I designed it specifically for my students, especially beginners, to have confidence in their next trade.
SOL blockchain is the KING of meme coins - that's the main reason it gained so much value in this bull run. In order to buy meme coins, you had to buy Solana first, then swap it.
Keep it simple and have confidence in your next trade.
-JumpStartCrypto

SOXL Has Room to Run?This one has a double bottom look, with a higher low, and another 4% remaining to hit take profit enroute to retesting the neckline before breaking out (another 8% from here) or balance and fail! Stop loss of 5% is pretty steep, so typically I either lower my position size or stop loss. Even at 4% stop loss, according to backtest results this wins more than it loses and has done pretty decent in the past, as I have been forward testing this model for over the past 18 months and profiting from over 100 different equities that I signal on.
The King Trading Momentum Strategy combines the 5 EMA crossing above the 13 EMA, RSI strength, favorable momentum as measured by ADX plus evaluating recent volume changes! SOXL and over 100 equities are built into this script with optimal backtest take profits and stop losses and can be toggled on by simply checking a box (default they are turned off). Check out my script, as I am always looking for people to help test and I am always interested in feedback...

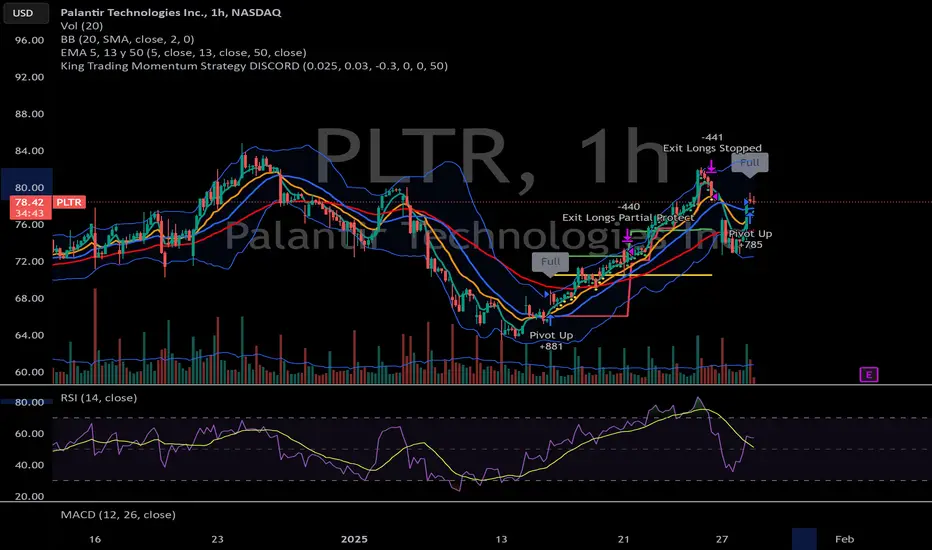
Can PLTR Press to All Time Highs??? and breakout this time?PLTR just signaled on the hour utilizing the King Trading Momentum Strategy. This one from a technical standpoint, looks like an inverse head and shoulders and as much as MM's keep trying to sell it, it keeps bouncing back. A full measure move takes this one back to the neckline where it can balance and fail or breakout. This aligns well with the take-profit of 6% and a stop-loss of 3.5%.
The King Trading Momentum Strategy combines the 5 EMA crossing above the 13 EMA, RSI strength, favorable momentum as measured by ADX plus evaluating recent volume changes and even something that measures breakout momentum called Beta for this one! PLTR and over 100 equities are built into this script with optimal backtest take profits and stop losses and can be toggled on by simply checking a box (default they are turned off). This week even with the crazy DEEPSEEK Monday selloff, the algo has 6 winners and 3 losers! Hopefully this is the next winner!
Time to "ZOOM" back to winnings ways?On Thursday afternoon, the King Trading Momentum Strategy triggered alongside eleven other alerts, followed by five more on Friday. This flurry of signals doesn’t exactly indicate a “bearish” sentiment, but as always, the market has its unpredictable ways! With markets approaching all-time highs, I’ve been cautious, limiting my positions to just a few with low allocations in TNA, ADBE, PYPL, and XYZ.
When I analyzed Zoom (ZM), I noticed that it experienced a strong rally from July through the end of the year, gaining over 50%. Now, the key question is: has it finished consolidating, or is there more downside ahead?
Looking back to July, ZM’s performance suggests a classic bull flag pattern. It’s retraced to the 38% Fibonacci level, and during a two-hour window when the signal fired, the impressive “wick” formed caught my attention. Now, after a short-term pump, it’s retracing again, and I’m eyeing the 50% Fibonacci level as a potential entry point.
Unless Monday brings a major selloff due to concerns over the Fed meeting on Wednesday or the PCE data on Friday, I’ll likely use the usual morning volatility to position myself in this trade. Let’s see how this one unfolds!
The King Trading Momentum Strategy employs a robust combination of indicators: the 5 EMA crossing above the 13 EMA, RSI strength, favorable momentum measured by ADX+, and MACD confirmation. ZM, along with over 100 other equities, is integrated into this script with optimized backtested take-profit and stop-loss levels. Activating these parameters is as simple as checking a box (they’re off by default), making this strategy both powerful and user-friendly.

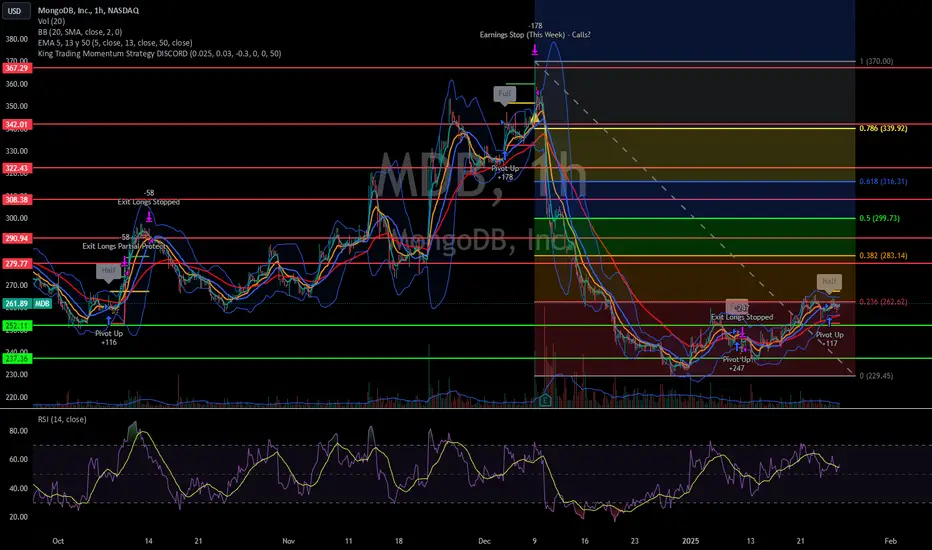
Time to Enter MDB Again?On Thursday afternoon, the King Trading Momentum Strategy signaled alongside eleven other alerts that day, followed by five more on Friday. This activity doesn’t exactly scream “bearish” to me, but the market has a way of keeping you on your toes! With markets once again approaching all-time highs, I’ve been treading cautiously. My positions have been limited to just a few, with low allocation sizes in TNA, ADBE, PYPL, and XYZ.
When I looked at MongoDB (MDB), I found myself wondering why it was hammered after posting a double beat on earnings and providing decent guidance. It turns out the recent drop was primarily driven by the announcement that Michael Gordon, MongoDB's Chief Operating Officer and Chief Financial Officer, will be stepping down on January 31, 2025. Is this reaction overblown? After all, the company delivered a strong earnings report.
That said, MDB seems to have planted its bull flag in the ground. Even if this news creates headwinds, there’s a possibility it could retrace back to the 38% Fibonacci level. Even if the broader market eventually pulls MDB lower, this setup suggests an 8% potential upside, and I’ve set an initial take profit at 5% with a 3% stop loss. If this can hit the take profit, I will sell half to protect the trade and then set a trailing stop loss of 1.5% on the remainder, trying to sell of much of it as possible on the way up!
Unless Monday brings a complete washout due to fears surrounding the Fed meeting on Wednesday or the PCE data on Friday, I’ll likely use the typical morning volatility as an opportunity to enter this trade. Let’s see how this one plays out!
The King Trading Momentum Strategy combines the 5 EMA crossing above the 13 EMA, RSI strength, favorable momentum as measured by ADX plus evaluating recent volume changes and even something that measures breakout momentum called Beta for this one! MDB and over 100 equities are built into this script with optimal backtest take profits and stop losses and can be toggled on by simply checking a box (default they are turned off).
SAFARI IND SEEN A STRONG BREAKOUT...SAFARI IND Stocks give a strong breakout. You should watch for a upside swing. Next resistence is at 2800-3000...

FYBR Weekly BullflagAfter a catalyst with NYSE:VZ FBYR looks ready to run higher towards 40
- $35.93 is key area to hold for immediate push upwards
- May move with or without other telecoms

SCHAEFFLER Swing Trade, Price is taking support from 50 EMASCHAEFFLER is taking support from 50 EMA in Weekly Chart. (For Swing Trade)
We can go for long swing trade only after price going above 3530 with approx. 6% stoploss and 24% Target.
Risk-Reward = 1:4
Plan your quantity/investment accordingly.
Note : Its just an analysis, wait for the price to confirm.
Disclaimer : Always follow risk to reward, this is the only key to success in market, no matter how much good a trade is looking we never know the future.

INDIANB Swing Trade WatchlistINDIANB is taking support from 50 EMA in Weekly Chart. (For Swing Trade)
We can go for long swing trade only after price going above 544 with approx. 7% stoploss and 21% Target.
Risk-Reward = 1:3
Plan your quantity/investment accordingly.
Note : Its just an analysis, wait for the price to confirm.
Disclaimer : Always follow risk to reward, this is the only key to success in market, no matter how much good a trade is looking we never know the future,

