XAUUSD – Swing Trade and Trend FollowingXAUUSD – Swing Trade and Trend Following
Gold prices have been moving sideways, forming a consolidation range, and recently broke out to the upside last week.
Currently, the price is pulling back to retest the bullish Fair Value Gap (FVG). If it can bounce from the 3400 support level, the next target would be the Range Volatile Week High around 3500.
However, if the FVG fails to hold, the price may drop to the next support levels at 3350 and 3300.
These are critical supports that should not be broken, as they also align with the ascending trendline (Up Trend Line).
That said, this move is seen as a pullback for a potential continuation to the upside.
Strategy: Buy the dip
Wait for a reversal candlestick at the key support zones.
The bullish outlook would be invalidated if the price breaks below 3250.
Swingtrade

MGY: Technical Breakout + Fundamental Momentum = Quiet Winner?Magnolia Oil & Gas (MGY) is showing one of the cleanest technical breakouts in the energy sector — and the market hasn’t priced it in yet. After months of pressure, price has broken above both the 50-day and 200-day moving averages with rising volume, signaling a clear phase shift from distribution to accumulation. Recent candles confirm control shifting to the buyers, with a tight structure, rising lows, and bullish momentum building underneath resistance.
The fundamentals back the technical setup. In the latest earnings report, MGY delivered a 9.7% revenue increase, $110M in free cash flow, and continues to pay dividends with low leverage. UBS upgraded the stock with a $29 target, which aligns precisely with the post-breakout projection. Operationally, the company is expanding in key U.S. basins like Eagle Ford, while seeing growing demand from Australia and Latin America.
With oil prices pushing higher and geopolitical tensions rising, MGY stands out as a stable energy play in a volatile world. Holding above the $24.00–$24.30 zone keeps the breakout valid, with $29+ as a natural magnet for price. Most investors are still asleep on this name — but the structure is already telling a very different story.


BTC Tactical rebound or flush? Decision point at $103700 support__________________________________________________________________________________
Technical Overview – Summary Points
➤ Strong overall momentum across all swing/weekly timeframes, clear advantage to buyers.
➤ Key support at 103,700–104,000 USDT (chart/on-chain confluence, maximum visibility on all timeframes).
➤ Major technical resistance zone at 111,000–112,000 USDT (ATH + HTF pivots).
➤ Volumes normal to moderate, no directional climax or emotional excess in short and mid-term.
➤ Risk On / Risk Off Indicator remains strongly positive, indicating persistent sector outperformance.
➤ Only short-term weakness detected: temporary bearish trend on 2H/1H/30min/15min, typical of a short-term flush within a bullish structural context.
__________________________________________________________________________________
Strategic Summary
➤ Main bias: Bullish for swing approaches as long as $103,700 holds on closing.
➤ Opportunity: Buy on support on any retest 103,700–104,000 USDT with stop <102,000 USDT.
➤ Partial target: Take profits at 105–106k, then 111–112k.
➤ Risk zones: Confirmed break below 103,700 USDT with high volume = potential flush to 97–98k or even 95–96k.
➤ Catalysts: Quiet macro calendar until NFP (06/06) & FOMC (mid-June) — increased monitoring as these events approach.
➤ Action plan: Tactical intervention on support pullback, reduce exposure before major events.
__________________________________________________________________________________
Multi-Timeframe Analysis
1D/1W : Major structure fully bullish. No underlying reversal, stable volume, solid momentum. Risk On / Risk Off Indicator fully “On Risk”, no behavioral excess.
12H/6H: Sector momentum and volumes validate all swing-long entries on dips. Key supports 103,700–104,000 USDT consistently defended across timeframes.
4H/2H: Bullish bias maintained, healthy structure. Slight intraday weakness: 2H softens, moderately high volumes without extremes.
1H/30m/15m: Short-term bearish bias across all LTF — profit taking impact, typical technical flush on support. Bearish signals do NOT invalidate HTF bullish trend, but require tactical vigilance.
Risk Summary: A fast drop below 103,700 USDT with volume would validate a flash liquidation scenario to 97–98k. Pullback in mature bull phase, strongly defended at the key support: timing for “mean reversion” on volume reaction, else wait for lower setups.
Risk On / Risk Off Indicator: Still “On Risk”, strong tech/growth sector momentum on daily/swing.
ISPD: No behavioral excess, neutral/median histogram across timeframes.
Volumes: Normal/moderate, no exhaustion spike nor major selling.
On-chain: Mature distribution, LTH profit-taking; key supports at $103,700, $97,100, $95,600.
__________________________________________________________________________________
Strategic Synthesis & Bias
Market in mature bullish consolidation, HTF structure robust as long as 103,700 USDT holds.
Active opportunity window until NFP & FOMC: prioritize swing/mean-revert setups.
Required stop for any trade: strictly below $102,000.
Smart monitoring of volumes & sentiment: confirmed support break + volume = wait for lower rebound.
No excessive panic or exuberance signals: strong RR if re-entering the main range.
Actively manage exposure approaching macro events.
Operational summary:
• Buy at 103,700–104,000 USDT, stop <102,000.
• Partial profits at 105–106k, final offload at 111–112k.
• Reduce exposure ahead of NFP/FOMC.
• If break of 103,700 USDT: stop and wait for $97–98k or $95–96k.
__________________________________________________________________________________

RELIANCEi Observed these Levels based on Price Action and Demand & Supply which is my own Concept "PENDAM CONCEPTS"... Please don't take any trades based on this chart/post... Because this chart is for educational purpose only not for Buy or Sell Recommendation... Thank Q

XAUUSD: Mid-Term Swing Sell OpportunityXAUUSD: Mid-Term Swing Sell Opportunity
While Gold's (XAUUSD) larger timeframe remains bullish, the intermediate trend has turned bearish. This shift is clearly signaled by a break below previous lows and the formation of a clean Head and Shoulders reversal pattern.
Currently, price is testing a strong support confluence at a Fair Value Gap (FVG) and a Demand Zone below.
Strategy: Bounce & Sell
Our strategy is to sell into bounces (short on rallies). Key resistance levels to watch for reversal
signals include:
3300: Coincides with the Range Volatile Day High.
3325 - 3350: This is a significant Supply Zone.
We will wait for bearish candlestick patterns and reversal patterns to confirm the move down at these resistance areas.
Downside Targets
Our primary downside targets are:
3150: Aligns with the Range Volatile Week Low.
3100: If this level breaks, we'll then look towards the final support at 3000, potentially forming a Triple Zigzag (WXYXZ) corrective structure.
From a time perspective, we anticipate this bearish phase to last approximately 13 days, in line with Fibonacci Time Cycle analysis.
Crucial Considerations
Effective Money Management is paramount. Ensure your position sizing is appropriate for the expected volatility range. Always be prepared to adapt your view when the price structure clearly invalidates the current bearish setup.
Trade carefully and profitably.
C.Goii Super Trader

XAUUSD Swing TradeXAUUSD Swing Trade
Market Overview:
Gold remains in an overall uptrend, currently facing resistance around 3350.
At present, price is pulling back with key support levels at:
3333, aligning with a Fair Value Gap
3310, the midpoint of the base structure
3295, a major Order Block zone
Strategy:
Look for buy opportunities on pullbacks at key support levels.
Wait for reversal candlesticks or clear reversal patterns before entering positions.
Take-Profit Targets:
Initial targets: 3380 and 3400, which align with the Volatile Day High range
Extended target for the week: 3450, the Volatile Week High

Equity Research Flash – BEML Ltd.CMP: ₹3,242.10 | Breakout From Falling Trendline
BEML has decisively broken out of a falling trendline and is now sustaining above a key consolidation zone. With strong bullish candles, a rising RSI, and healthy volume spike, the stock signals bullish momentum. Immediate resistance lies at ₹3,420–₹3,480. Sustained move above could target ₹3,750+. 20/50 EMA crossover supports the upward trend. Traders may consider entries on dips with SL near ₹3,080.
For educational purposes only

Intel Breakdown Alert! Bearish Setup with High R:R Opportunity !📉 Intel Corporation (INTC) – Bearish Setup Analysis
Timeframe: 4H | Ticker: NASDAQ:INTC | Exchange: NASDAQ
🔍 Technical Breakdown
We are currently observing a potential bearish reversal on Intel Corp. following a clear breakdown from a rising parallel channel on the 4H chart.
🟦 Pattern Observed
Price was previously moving within a rising channel, forming higher highs and higher lows – a typical short-term bullish structure.
Recently, price broke down below the lower boundary of this channel, signaling a potential shift in momentum from bullish to bearish.
📌 Trade Setup
Entry Zone: Between $20.22 – $20.06
Price is currently trading in this zone, presenting a potential short entry opportunity following the channel breakdown.
Stop Loss: $21.77
Placed above the previous resistance zone and the broken channel. If the price reclaims this level, the bearish thesis is invalidated.
Final Target: $17.70
This level represents a key support zone from previous price action and aligns with potential measured move from the channel breakdown.
✅ Why This Setup?
Channel Breakdown
A break below a well-defined channel often marks a change in trend. This gives a high-probability setup for trend reversal traders.
Bearish Momentum Confirmation
After the breakdown, price failed to reclaim the channel, and is now trading below the prior support, flipping it into resistance.
Risk/Reward Ratio
This setup offers an excellent R:R ratio, with downside potential toward $17.70 and a relatively tight stop just above the failed structure.
Market Structure Alignment
Lower highs and lower lows now appear to be forming post-breakdown, further confirming a potential bearish move ahead.
📉 Bias: Short
📈 Invalidation: Break and close above $21.77
🎯 Target: $17.70
🧠 Disclaimer: This is not financial advice. Always do your own research and manage your risk accordingly. Trade safe!

GBPJPY Bulls wake Up! Clean swing buy opportunity ahead! Price after the recent swing high as indicated on the chart (yellow circles)
It has since retraced to to 61.8 retracement level and has rejected with one bullish candle and currently rejecting again. There is a high probability to see some buy pressure ahead of next weeks trading sessions to the up side to target of 195.78 and beyond.

Russell 2000 - C wave to complete correction?I have been bearish on the Russell for a long time. nothing has changed. the wave count is getting clearer... at least for now.
price action as of late has been like watching paint dry on the wall, still waiting for a catalyst... coming soon, i believe.
this count would only be invalidated with a sustained break above resistance zone.
**minor change from my previous charts - i have simplified the wave counts from a (WXYZ) to (ABC).

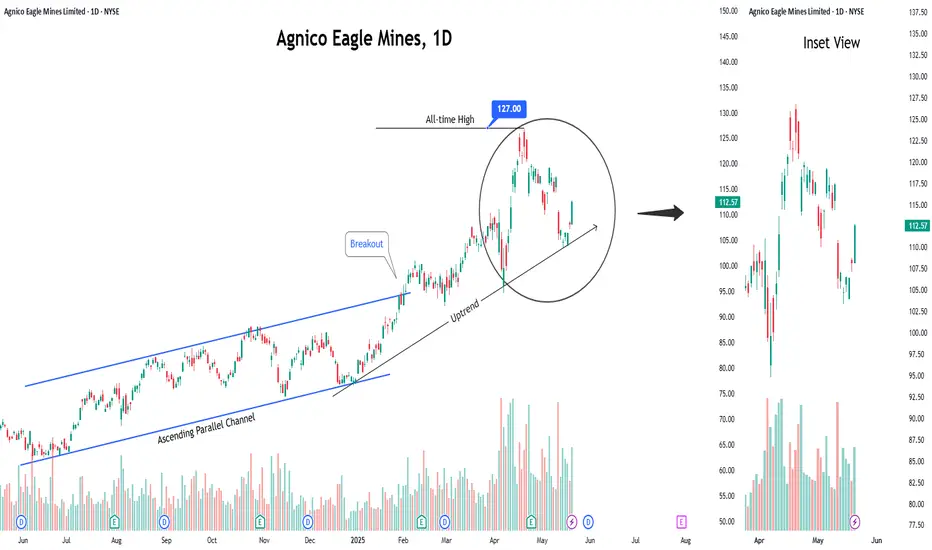
Buy Agnico Eagle Mines LimitedShort Term Trading Advice by Naranj Capital
Buy Agnico Eagle Mines Limited
● Buy Range- 108.5 - 112
● Target- 116 - 118
● StopLoss- 104.5
● Potential Return- 4-5%
● Duration- 14-15 Trading Days
Equity Research Report – NEWGEN SOFTWARE TECHNOLOGIESShort-Term View: A strong breakout above key resistance at ₹1,100 with volume surge indicates bullish momentum. Price reclaimed the 50 EMA after consolidation. RSI at 60.87 supports strength; next resistance lies near ₹1,193.90.
Long-Term View: Structurally strong after correction. Sustaining above ₹1,020 (50 EMA) may attract fresh buying. Long-term targets can stretch to ₹1,300+ if earnings and demand trends remain favorable.
Conclusion: Bullish momentum likely to continue both short and long term. Watch for volume confirmation and hold above ₹1,100.
For Education Purpose only

SBFC FINANCE Breakout from Long Consolidation | Strong Volume✅ Recommendation: Buy (Post-Breakout Strategy)
CMP: ₹108
Buy Zone: ₹106–₹108 (current price is still within a safe buying range after breakout)
Target 1: ₹120
Target 2: ₹135
Stop-Loss: ₹98 (just below breakout zone)
Risk-Reward Ratio: ~1:2 (ideal)
⚠️ Caution
Don’t chase if the price shoots up quickly from here. Wait for minor dips toward ₹106 to enter.
If price closes below ₹98 with volume, the breakout may fail — consider exiting.
for educational purposes only

Is There the Best Moving Average For Swing Trading?Is There the Best Moving Average For Swing Trading?
In swing trading, moving averages are widely used to analyse market trends and identify potential turning points. In this article, we’ll dive into the most commonly used MAs, their unique characteristics, and how they can be applied in swing trading strategies.
What Are Moving Averages?
You definitely know what moving averages are. However, we need to start our article with a brief introduction to this market analysis tool.
A moving average (MA) is a fundamental tool in technical analysis that helps traders understand the direction of a market trend by smoothing out price fluctuations, often touted among the best indicators for swing trading. Instead of focusing on the volatile ups and downs, MAs calculate an average of prices over a specific period, such as 20, 50, or 200 periods. This gives traders a clearer picture of the overall trend by filtering out short-term volatility.
There are different types of moving averages, but they all work on the same principle: tracking the average price over time to highlight the market's trajectory. For example, a 20-period MA shows the average (usually closing price but a trader can choose highs, lows, and opens) over the past 20 periods, updating as new prices come in. This rolling calculation creates a line on the chart, making it easy to identify whether the market is trending upwards, downwards, or moving sideways.
Types of Moving Averages
Moving averages come in various forms, each with unique characteristics that cater to different trading styles and strategies.
Simple Moving Average (SMA)
The simple moving average (SMA) is the most straightforward type, calculated by averaging the closing prices (but a trader can choose any price type) over a set number of periods. For example, a 20-period SMA adds up the last 20 closing prices and divides by 20. It’s popular among traders who want a broader view of price trends without overreacting to short-term fluctuations, making it a contender for one of the best moving averages for swing trading. However, SMAs can lag behind price action, as they give equal weight to all prices in the calculation.
Hull Moving Average (HMA)
The hull moving average (HMA) is designed to reduce lag while maintaining a smooth line. By combining weighted averages with additional smoothing techniques, the HMA offers a balance of speed and clarity, making it an underrated moving average for swing trading.
Exponential Moving Average (EMA)
The exponential moving average (EMA) prioritises recent prices, giving them more weight in the calculation. This makes it more responsive to price changes compared to the SMA. Swing traders often use EMAs in faster-moving markets, where quick adjustments to trend shifts are crucial, with 8- and 21-period EMAs considered by some traders as two of the best EMAs for swing trading. For instance, a 20-period EMA reacts faster to sudden price movements than a 20-period SMA, helping traders spot potential reversals sooner.
Weighted Moving Average (WMA)
Similar to the EMA, the weighted moving average (WMA) also gives more importance to recent prices but does so with a linear weighting system. This means the most recent price has the greatest impact, gradually decreasing with older data. WMAs are less common but useful when traders want a more precise reflection of recent price action.
How to Use Moving Averages in Swing Analysis and Trading
Moving averages are versatile tools that can provide valuable insights for swing traders. Beyond highlighting trends, they can help identify potential turning points and dynamic support or resistance levels. Here’s how they’re commonly used in swing trading:
1. Identifying Trends
MAs are widely used to assess the direction of a trend. For instance, if the price consistently stays above a rising moving average, it suggests an upward trend. Conversely, when prices remain below a declining moving average, the market could be trending downward. Swing traders often rely on shorter moving averages, like the 20-period, for identifying trends that align with their trading horizon.
2. Spotting Reversals with Crossovers
Crossovers happen when two MAs intersect. A common example is a shorter MA crossing above a longer one, which may indicate a shift towards bullish momentum and vice versa.
3. Dynamic Support and Resistance
MAs act as floating support and resistance levels. MAs serve as a support level in an uptrend, with the price bouncing off it repeatedly. In a downtrend, the same moving average might act as resistance, limiting upward moves.
4. Filtering Market Noise
In choppy markets, MAs can smooth out minor fluctuations, making it easier to focus on the bigger picture. Swing traders often use longer MAs, such as the 50-day or 200-day, to filter out irrelevant short-term movements.
5. Timing Entry and Exit Zones
Many traders use crossovers to time their entries and exits, though it’s worth noting their lagging nature means they can result in untimely trades. They can also provide context. For example, if the price approaches a key moving average after a strong move, it might indicate a consolidation phase or a potential reversal, allowing traders to adapt their analysis.
Common Moving Averages for Swing Trading: The 20, 50, and 200 MAs
Swing traders often turn to the 20-, 50-, and 200-period moving averages as their go-to tools for analysing market trends. Each serves a specific purpose, helping traders gauge short-, medium-, and long-term price movements. These moving averages are often used together.
20-Period Moving Average
The 20-period MA is a favourite for short-term trend analysis. It reacts quickly to price changes; therefore, traders use it to identify recent momentum or potential trend shifts. Traders frequently watch for price “bounces” off the 20-period MA as potential indications of continuation in the current trend.
50-Period Moving Average
The 50-period MA provides a medium-term perspective, offering a smoother look at price trends. It’s slower to react than the 20-period MA but avoids being overly lagging. This balance makes it useful for identifying sustained trends while filtering out minor price noise. When prices interact with the 50-period MA, it often acts as a dynamic support or resistance level.
200-Period Moving Average
The 200-period MA is the benchmark for long-term trend analysis. It’s often used to determine the overall market direction. This MA is also a widely followed indicator for institutional traders, adding weight to its significance. Interactions with the 200-period MA often mark key turning points or areas of consolidation.
Traders also monitor crossovers between the 50- and 200-period MAs, recognised by some as the best moving average crossover for swing trading. For instance:
- Golden Cross: When the 50-period MA crosses above the 200-period MA, it suggests potential bullish momentum.
- Death Cross: When the 50-period MA drops below the 200-period MA, it signals a possible bearish shift.
Using Them Together
Using the 20-, 50-, and 200-period MAs together offers a comprehensive approach to identifying the best moving average crossover setups, allowing traders to see the bigger picture while still tracking short-term shifts. For instance, when the price breaks above the 200-period MA while the 20-period MA crosses above the 50-period MA, it may signal the beginning of a broader bullish trend. Meanwhile, a price drop below all three MAs could suggest broader bearish momentum.
Other Moving Average Combinations for Swing Trading
While the 20, 50, and 200-period MAs are staples in swing trading, exploring other combinations can offer nuanced insights tailored to specific trading strategies. Some alternative moving average setups that traders often employ include:
8-Period and 21-Period Exponential Moving Averages (EMAs)
This pairing is favoured by traders seeking to capture short-term price movements with greater sensitivity. They call this the best EMA crossover strategy. The 8-period EMA responds swiftly to recent price changes, while the 21-period EMA provides a slightly broader perspective.
10-Period and 50-Period Simple Moving Averages (SMAs)
Combining the 10- and 50-period SMAs offers a balance between short-term agility and medium-term trend identification. This combination helps traders filter out minor price fluctuations and focus on more sustained movements.
28-Period and 50-Period HMAs
For traders focused on short-to-medium-term trends, the 28- and 50-period HMAs offer a balanced approach. The 28-period HMA reacts quickly to price changes, while the 50-period HMA provides a steadier view of the broader trend. Crossovers between the two can signal potential bullish or bearish momentum shifts, benefiting from the HMA’s reduced lag.
13-Period and 34-Period WMAs
Rooted in Fibonacci sequences, the 13- and 34-period WMAs are employed by traders who believe in the natural rhythm of the markets. A 55-period WMA can also be included for a longer-term perspective. Crossovers between these WMAs can highlight potential trend reversals or continuations, with the WMA adapting more quickly than other MAs due to its weighted calculation.
Implementing These Combinations
When applying these moving average combinations, it's crucial to consider the following:
- Market Conditions: These combinations often perform better in trending markets versus ranging markets. Moreover, shorter MAs might be more effective in capturing quick price movements during high volatility.
- Timeframes: Traders align MAs with their trading horizon. Shorter periods like the 5-period or 8-period MAs are usually used by traders focusing on brief swings, while longer periods like the 50-period MA cater to those looking at extended trends.
- Confirmation with Other Indicators: Relying solely on moving averages can lead to false signals. Traders corroborate these signals with other technical indicators, such as Bollinger Bands or the Relative Strength Index (RSI).
What Moving Averages Should You Use for Swing Trading?
There is no best moving average for swing trading. The choice of MAs ultimately depends on a trader's strategy and preferences. The combinations discussed provide a framework, but experimenting with different setups can help identify what aligns with individual trading styles and objectives.
The Bottom Line
Moving averages are powerful tools for swing trading, offering insights into trends and potential market turning points. Whatever your unique preference for different types and lengths, understanding their application can refine your strategy.
FAQ
Which Moving Average Is Good for Swing Trading?
The 20-period, 50-period, and 200-period moving averages are widely used in swing trading. However, different combinations, like the 8- and 21-period or 13- and 34-period MAs can offer equally valuable insights; it ultimately comes down to the trader’s preference.
What Is the Most Popular Moving Average to Use?
The most popular moving average depends on a trader’s trading style and goals. Shorter MAs, like the 20-day MA, are popular for quick trend identification, while longer ones, such as the 200-day MA, provide a bigger picture. Many traders combine MAs to cover different timeframes.
Is 200 EMA Good for Swing Trading?
The 200-period EMA is useful for swing traders seeking to understand long-term trends. It reacts faster than the 200-period SMA, making it suitable for traders looking to incorporate a responsive indicator in their analysis.
Which Indicator Is Most Popular for Swing Trading?
There isn’t a single best indicator for swing trading. Moving averages, RSI, MACD, and volume indicators are commonly used. Combining these can provide a more comprehensive analysis.
Which Volume Indicator Is Popular for Swing Trading?
The On-Balance Volume (OBV) and Volume Weighted Average Price (VWAP) are popular volume indicators for swing traders, helping assess market momentum.
Which RSI Indicator Is Popular for Swing Trading?
The standard 14-period RSI is widely used. Swing traders often adjust it to shorter periods (e.g., 7) for faster signals or longer periods (e.g., 21) for smoother trends.
This article represents the opinion of the Companies operating under the FXOpen brand only. It is not to be construed as an offer, solicitation, or recommendation with respect to products and services provided by the Companies operating under the FXOpen brand, nor is it to be considered financial advice.

Is Citigroup (C) the Most Undervalued Big Bank Right Now?🔥Let’s talk numbers:
🧮 P/E: 9.78x
💸 P/S: 0.66x
That’s deep value — Wall Street’s sleeping on this one. While everyone's chasing AI, Citigroup is trading at garage sale prices.
🧠 The Setup:
If you're into swing plays with strong R/R and macro upside, C is worth a look.
🔑 Entry Zones: 1️⃣ Market price — for early bulls
2️⃣ $55 — breakout confirmation
3️⃣ $48 — bargain bin steal
🎯 Targets:
TP1: $70 🟢
TP2: $78 🚀
TP3: $84 💰
💬 Why it matters:
Citi has been lagging behind peers like JPM, but it’s still a beast. If the Fed holds or cuts, banks could catch a serious bid — and this one’s ready to pop from a value base.
📌 Watching volume at $55 and any macro shifts as catalysts.
👀 Don’t ignore this one just because it’s not trending. That’s where smart money hides.
📢 Disclaimer:
This is not financial advice. Just sharing ideas and setups I’m watching. Always do your own research and manage your risk.
#Citigroup #C #Undervalu
#Citigroup #C #UndervaluedStocks #SwingTrade #TradingSetup #DeepValue #Banking #PEratio #SmartMoneyMoves #StockMarket #Financials #Watchlist

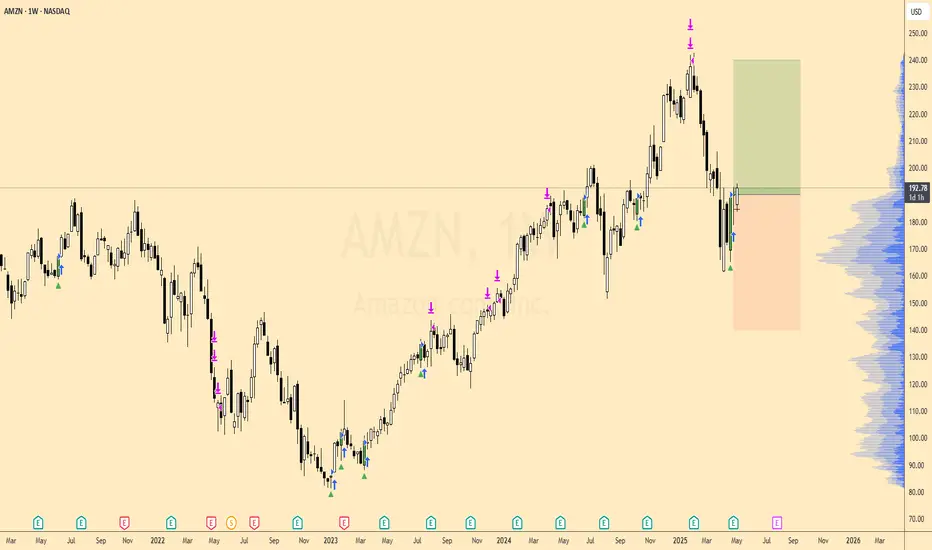
AMZN Weekly Bullish Setup - 91% Historical Win RateI’m looking to go long on Amazon (AMZN) on the weekly chart as the price that has acted this way has been a strong indicator for a swing trade in the past.
Since early 2023, AMZN has climbed from the mid-$70s to a peak above $245, carving out clear impulse moves followed by healthy pullbacks.
The current pullback has returned into the $185–195 region, which on the weekly VP shows the largest volume accumulation (HVN). Historically this zone has marked both places to buy into rallies and logical areas to defend.
We were in a 5 week range. Last week printed a bullish rejection candle (long lower wick), accompanied by my weekly “buy” arrow (green triangle). This mirrors 34 prior occurrences of the same pattern on AMZN’s weekly chart.
Targeting the $240 region, this is a 1:1 trade
Uptrend Stock / Swing and Run Trend / SE (NYSE)Uptrend Stock / Swing and Run Trend
SE (NYSE)
Fundamental
Sea Limited operates in three highly attractive business segments:
Sea Money – The company’s digital financial services arm offers consumer and SME lending, mobile wallets, and payment processing services.
Shopee – The largest e-commerce platform in Southeast Asia and Taiwan, with strong market presence and growth.
Garena – The company’s digital entertainment division, providing access to popular mobile and PC games. It also promotes eSports. Garena has developed its own successful game titles such as Free Fire, a globally popular battle royale game.
Sea Limited's key strength lies in its integrated platform that combines e-commerce, digital finance, and digital entertainment under one umbrella. This synergy allows the company to cross-leverage its customer base—for example, using Shopee users to promote Sea Money's financial services.
Technical
The price has been forming accumulation patterns at the bottom and gradually rallying upwards.
It’s showing a sideways-up structure, where the price bases sideways and then continues to rally upward in steps.
This setup allows for buy-the-dip opportunities using an indicator called Regression Trend to identify the trading channel.
For swing trading, one could buy on dips near the lower support band and sell at resistance on the upper band.
As shown in the chart (with circles marked), I’ve been buying on dips along the way.
In the most recent phase, you can consider buying around $139. If the price breaks out, the next support levels to watch would be around $143 and $147.
Target prices:
First target: $150
Next targets: $160 and $170
Stop Loss:
If the price drops below $120 and breaks the price structure, that would be the stop level.
As the quarterly earnings announcement approaches, the price is rallying in anticipation, and it's showing strong momentum within an uptrend—very positive sign.

Buy Agnico Eagle Mines LimitedShort Term Trading Advice by Naranj Capital
Buy Agnico Eagle Mines Limited
● Buy Range- 116 - 119
● Target- 125 - 126
● StopLoss- 112
● Potential Return- 5-6%
● Duration- 14-15 Trading Days

Equity Research - TATA MOTORS LTD 📈 Buy Zone: ₹670.50 – ₹680.30
🎯 Target: ₹740.00
🛑 Stop Loss: ₹641.70
💹 CMP: ₹680.30
Technical Highlights:
✅ Bullish volume spike
✅ RSI above 60 – strong momentum
✅ Price above 20EMA & 50EMA
✅ Breakout and retest on 15m & 1H chart
✅ Good risk-reward setup
📊 Strategy: Wait for confirmation candle on 15min TF above ₹681 for entry.
📉 Stop loss below recent swing low at ₹641.70.
For Education Purposes Only

XAUUSD ANALYSIS XAUUSD took support from support line,
All long targets are achieved.
this month taking rejection from major resistence,
Let's track the moves to down.
follow for more swing analysis on INDICES - CURRENCY - COMMODITIES

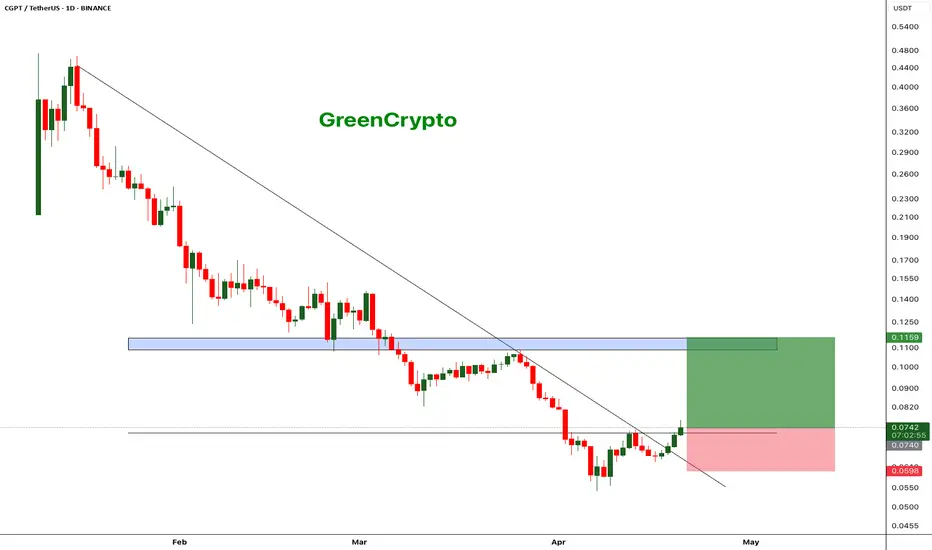
CGPT - Decent Swing Trade Opportunity $BINANCELCGPTUSDT (1D CHART) Technical Analysis Update
CGPT is currently trading at $0.0740 and successfully broke out from the local resistance and heading towards the next resistance. This gives a good opportunity for a quick swing trade with tight stoploss.
Entry level: $ 0.0740
Stop Loss Level: $ 0.0599
TakeProfit 1: $ 0.0818
TakeProfit 2: $ 0.0952
TakeProfit 3: $ 0.1114
Max Leverage: 2x
Position Size: 1% of capital
Remember to set your stop loss.
Follow our TradingView account for more technical analysis updates. | Like, share, and comment your thoughts.
Cheers
GreenCrypto
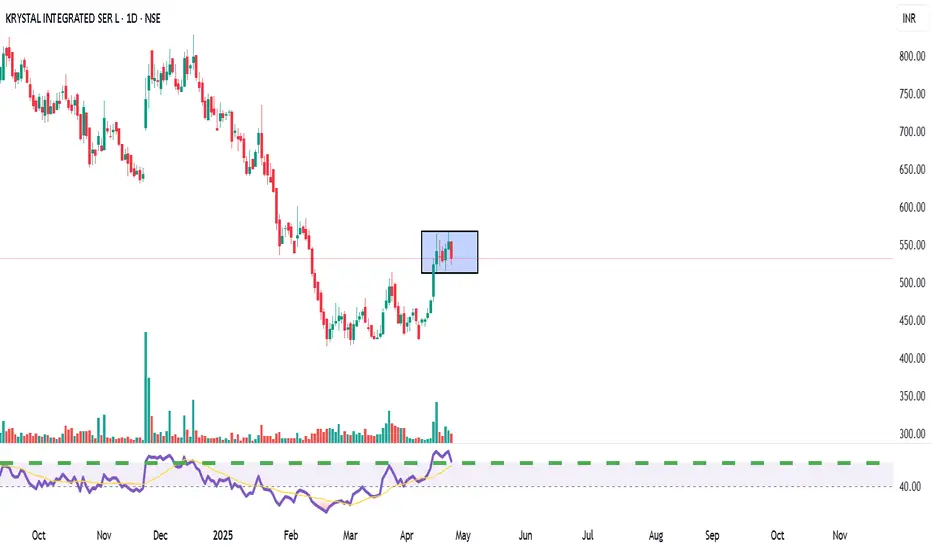
KRYSTAL Integrated Services LtdTechnical View: KRYSTAL is consolidating between ₹520–₹550 after a rally from March lows. A breakout above ₹560 could target ₹600+, while a dip below ₹500 may weaken momentum. RSI shows moderate bullishness.
Fundamental View: FY24 revenue grew ~44% YoY to ₹981 Cr; net profit rose ~26% to ₹48 Cr. ROE ~18%, ROCE ~20%. Recently secured a ₹349 Cr 3-year contract from Tamil Nadu Medical Services.
Action Plan:
Short-term: Buy above ₹560, target ₹600.
Long-term: Attractive valuation; accumulate on dips ₹450–₹500 zone.