$AEI #stockmarket #live #news #business #trading #stocks #stockAlset EHome International Inc., through its subsidiaries, engages in property development, digital transformation technology, and biohealth activities in the United States, Singapore, Hong Kong, and Australia. The company owns, operates, and manages real estate development projects, as well as lease units; and provides consulting, implementation, and development services related to digital transformation of enterprises. It also focuses on the research, development, and sale of Linebacker, a therapeutic drug platform; Laetose, a functional sugar substitute; and 3F, a multi-use fragrance. The company was formerly known as HF Enterprises Inc. and changed its name to Alset EHome International Inc. in February 2021. Alset EHome International Inc. was founded in 2014 and is headquartered in Bethesda, Maryland. Alset EHome International Inc. is a subsidiary of Hancock Fabrics, Inc.
Swingtrader

DOT BUY LIMITCRYPTO SIGNAL:
📊DOT/USDT 📈BUY LIMIT 34,65
📍SL 32,65
✅TP 36,22
✅TP 38,11
✅TP 41,96
Leverage 10x


BTC Bearish Shark Playing Out We have The Harmonic shark playing out on the 1H Btc chart , Just a quick analysis im not in any position atm .
FIB ext pull with potential targets are there to give you an idea of the levels we could go to .
Follow and Like Traders and I follow back

GBP/AUd Swing trading analysisGBP/AUd Swing trading analysis.. Currently we have nice bullish opportunity


PLTR long swing trade ideaOn hourly chart, there is clear bullish falling wedge. Objective entrance when it breaks out of bulling falling wedge. If it gaps up, maybe take a small position in case it rips, but otherwise add on when it back test the wedge. Oversold reading on RSI and divergent low additionally increase odds in favor of bounce here. $31.18 is a solid support. Probably set a stop somewhat below depending on your target.
Have a good trade everyone,
T.

GBPJPY: Bearish Outlook Explained
Different bearish clues and price action analysis on GBPJPY.
Trading recommendations & scenarios.
Potential targets & key levels.


BYND trading perfectly to the technicals. Quick 20% profit.On the January 14th post, it ran into the resistance after breaking out of the wedge. I put out one of the two scenarios. Breaking though the resistance and going up til the next target or quick pull back to the support level and breaking out. It pulled back perfectly and defended the support and today finally advancing to the short term target. Quick 20% profit.
Have a good trade everyone,
T.

CHFJPY: Waiting for Breakout
CHFJPY is currently trading within a wide horizontal trading range on daily.
For intraday trading opportunities, consider its boundaries as safe places to buy/sell.
To catch a new swing, though, we must wait for the breakout first.
In case of a daily violation of its resistance (daily candle close above), bullish continuation will be expected to 118.5
In case of a bearish breakout (daily candle close below its support), bearish wave will be expected and goal will be 115.3.
Wait for the decision of the market participants and then follow!

NZDCAD SHORT Price has bounced off 0.928 resistance level which has been tested multiple times as support and resistance over the years - along with a clear harmonic price pattern with 1.27, 1.618, 0.5 areas all being of harmonic elements and RSI oversold on weekly.

NIO: ON WATCH FOR A BULLISH BREAKNio showing some bullish signals.
Wait for the break to enter the trade. Potential target 70usd.

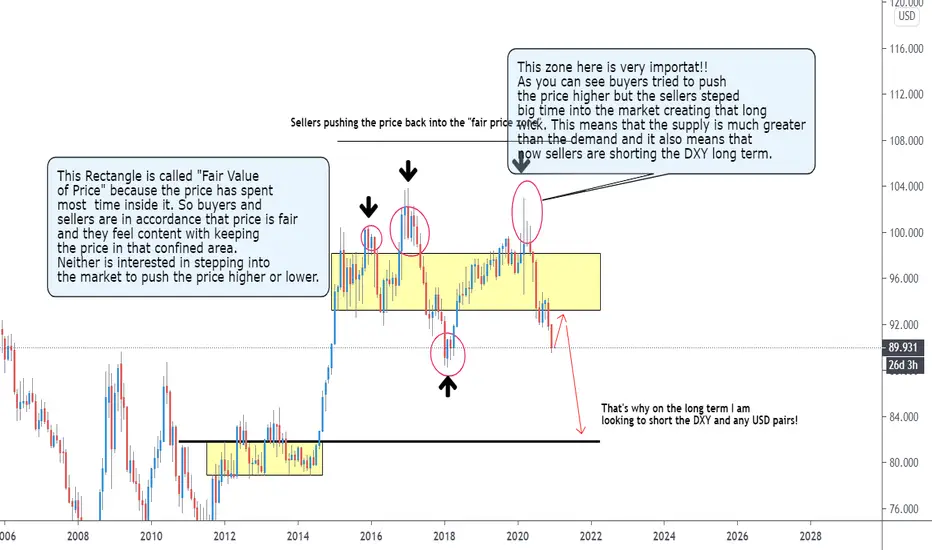
DXY Monthly Chart. Price Action: Fair Vlaue of Price!Please let me know your thoughts. Have a Happy New Year full of Blessings and to achieve all your Goals!!
TQQQ long swing trade entry off- heiken ashi strategyShortly after bouncing off the 21 day moving average, we got a buy signal.
Closing price was 164.74
1st Take Profit (10% of position @ 4%) = $171.33
2nd Take Profit (10% of position @ 8%) = $177.92
Exiting on 1st red heiken ashi or 9th green. No stop loss, chart shows 12.3%, this is max single trade drawdown of this strategy from 2010-2020, in order to show max risk.

#FederalBank Swing Trade #TradingviewIndiaThe views expressed here are for our record purposes only. Please consult your personal financial advisor before investing. We are in no way responsible for your profits/losses what so ever.

SWING TRADE STRONG STOCK AARTI INDUTRIES BUY AARTI INDUSTRIES IN DIPS NOW 1023.30 SL 980 (ON CLOSING BASES ) TARGETS 1200
STRONG STOCKS ON STRONG SUPPORT AS TRENDLINE (LOW RISK HIGH REWARD TRADE)
Over the last 5 years, net income has grown at a yearly rate of 21.09%, vs industry avg of 8.53%
Over the last 5 years, revenue has grown at a yearly rate of 7.54%, vs industry avg of 4.05%
Over the last 5 years, market share increased from 8.4% to 9.31%

GBPCHF SHORT - PRICE HAS REACHED DAILY LEVELPrice has reached key daily level and is moving very correctively on the H4 timeframe showing signs of weakness and a potential reversal and a swing to the downside is becoming more probable. Price has tried to break through this level 2 times before and is now on its 3rd attempt, so if we see price hold we can expect to see a bearish swing to the daily level below which was resistance but will now be acting as support.
Comment below what you think will happen to GBPCHF

AUDNZD LONG - Potential breakout of descending channelPrice has been moving in a descending channel on the H4 time frame on AUDNZD and has recently made a 3rd test of the lower trendline and has had a strong bullish rejection from it. There is a good possibility that we could now get a swing to the upside and finally see AUDNZD breakout of the channel and see a test of the next key level of resistance above it.

CHFJPY LONG - Key H4 level is holding and a reversal is possiblePrice has been moving in a downtrend for the past few weeks and has tested the bearish trend line 3 times with strong rejections each time. However, price is starting to lose momentum in its down trend as price is failing to set new lows and we have just recently had a strong bullish reaction from a key H4 support level. Price has the possibility to reverse and give us a counter trend move and break through the bearish trendline and test the key level of resistance above it.

EURUSD short Watch EURUSD going lower because eur is getting weaker and dollar is gainning strengh beacause the elections result! But as we all know Trump is not taking that easy, lawers now will decide how legal was the results ! So manage your possitions carefully!!
