360 ONE WAM Swing Long SetupEnter with Limit order placed at - 1022.25
Target with Risk to reward 1:2 is 1186
Stoploss only when 1 day candle closes below the price - 940
Note: This is not any financial advice, this is for education purpose only
Swingtradesetup

INOX WIND Swing Long TradeEnter only when 15minute candle closes above the Entry Zone Price - 229.45
Target with Risk to reward 1:2 is 280.35
Stoploss only when 1 day candle closes below the price - 204
Note: This is not any financial advice, this is for education purpose only.

MUTHOOT FINANCE Swing Long TradeEnter only when 15minute candle closes above the Entry Zone Price - 1955
Target with Risk to reward 1:2 is 2129
Stoploss only when 1 day candle closes below the price - 1868.05
Note: This is not any financial advice, this is for education purpose only.

CDSL Swing Long SetupEnter only when 15minute candle closes above the Entry Zone Price - 1484.95
Target with Risk to reward 1:2 is 1765.55
Stoploss only when 1 day candle closes below the price - 1344.60
Note: This is not any financial advice, this is for education purpose only.

TRIVENI TURBINE Swing Long TradeEnter with Stop Limit order placed at - 745.10
Target with Risk to reward 1:2 is 929.9
Stoploss only when 1 day candle closes below the price - 641.75
Note: This is not any financial advice, this is for education purpose only.

TVSMOTOR Swing Long TradeEnter with Limit order placed at - 2776.40
Target with Risk to reward 1:2 is 2999.75
Stoploss only when 1 day candle closes below the price - 2621.15
Note: This is not any financial advice, this is for education purpose only

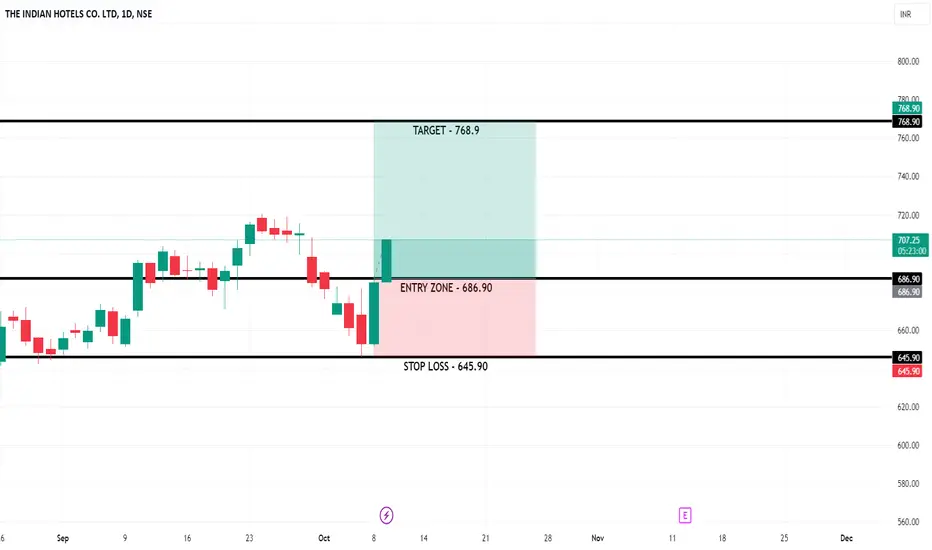
INDIAN HOTELS Swing Long SetupEnter with Limit order placed at - 694
Target with Risk to reward 1:2 is 768.9
Stoploss only when 1 day candle closes below the price - 645.9
Note: This is not any financial advice, this is for education purpose only
CAMS Swing Long SetupEnter only when 15minute candle closes above the Entry Zone Price - 4447.95
Target with Risk to reward 1:2 is 5243.85
Stoploss only when 1 day candle closes below the price - 4050
Note: This is not any financial advice, this is for education purpose only.

Finolex Cables - Swing Long SetupEnter only when 15minute candle closes above the Entry Zone Price - 1559
Target with Risk to reward 1:2 is 1940
Stoploss only when 1 day candle closes below the price - 1369.15
Note: This is not any financial advice, this is for education purpose only.

Karur Vysya Bank - Swing Long SetupEnter only when 15minute candle closes above the Entry Zone Price - 220.79
Target with Risk to reward 1:2 is 250.20
Stoploss only when 1 day candle closes below the price - 206.10
Note: This is not any financial advice, this is for education purpose only.

ALB heating back upAfter breaking down from a falling wedge, ALB undercut a long term support line and things looked precarious. Recent weeks have thrown a lifeline to the beleaguered shares with news of China's CATL cutting lithium production and now Rio Tinto's Arcadium takeover bid .
The Rio Tinto bid could have gone another way, since the bid in ALB's stock late last week centered around speculation they could be the acquisition target. It wouldn't have been surprising to see shares slump this morning, but the rally is in tact.
Featured here is the 4 hour chart, where we can see the price has broken through the 200 period moving average. Next up is a golden cross on the short term chart, and we're also looking for the daily chart to register an overbought reading to further validate the rally. Often times overbought signals a near term pullback, and that would be unsurprising. These cupping patterns can have violent breakthroughs or breakdowns as the price tries to penetrate to the upside.
Be patient. It may take a few weeks for momentum to build, but taking a step back to the montly chart we can gauge the potential of the rally that could well be underway. The $120's gets us back to the range before things broke down recently, that area looks very likely, and for the more patient $140 would take us back to the highs of 2017.

POLICYBZR Swing Long SetupEnter with Stop Limit order placed at - 1740
Target with Risk to reward 1:2 is 2130
Stoploss only when 1 day candle closes below the price - 1545.05
Note: This is not any financial advice, this is for education purpose only.

Vedanta Limited Bullish ( Range breakout daily chart)Vedanta ltd (VEDL) is bullish for next few days or weeks.
Buy on dip will be my favorite condition...but I will wait higher high- higher low creation on smaller time frame.
Price can created 2 conditions-
1. Test previous resistance, which will act as a support then price will bounce.
2. Price will not bounce after consolidation.
I am not SEBI registered and not recommending to buy or sell, this is just my overview as per price action logics.

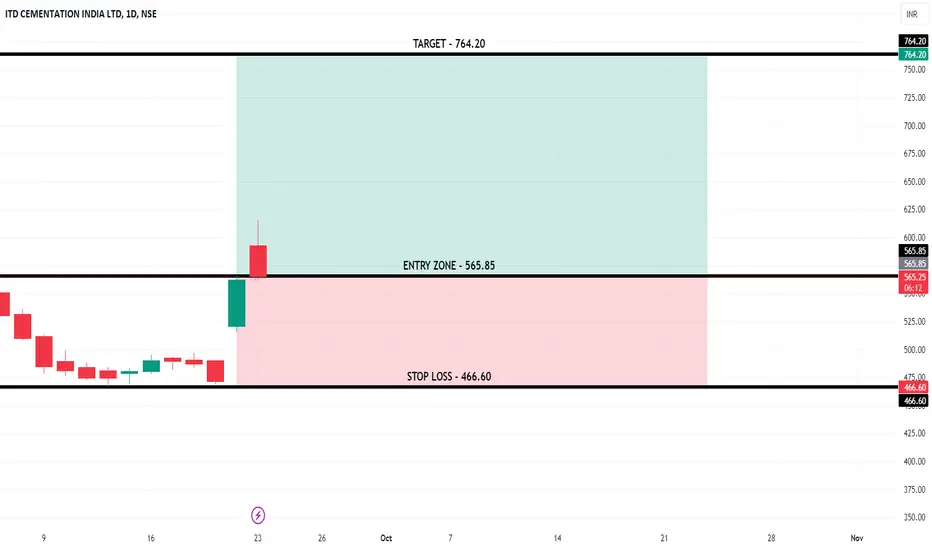
ITDCEM Swing Long SetupEnter with Limit order placed at - 565.85
Target with Risk to reward 1:2 is 764.20
Stoploss only when 1 day candle closes below the price - 466.60
Note: This is not any financial advice, this is for education purpose only
DYM Descending Broadening Wedge Breakout Confirmed!We've just seen a strong breakout of DYM from its descending broadening wedge structure. This is a key bullish reversal signal! 📈
The price action indicates momentum building up, with the next target zone being around $7-$8, representing the top of the broadening wedge structure.
🔸 Key Levels: As the price surges, we’re watching the $7-$8 range for potential resistance.
🔸 Support Re-test?: A possible re-test of the breakout level could present a strong entry point if the momentum holds.
🔸 Volume Confirmation: The breakout is supported by a surge in volume, reinforcing the potential for a strong move upward.
Keep an eye on the market dynamics, and remember to manage your risk, especially as we approach key resistance levels.
#DYM #Breakout #BroadeningWedge #SwingTrade #CryptoTrading #TechnicalAnalysis
🚨 Disclaimer: This is not financial advice. Always conduct your own analysis or consult with a professional.

SWING IDEA - GICREStock has made a MACD Cross this week on the Weekly Chart. This crossover can take the stock easily to its Swing High levels again.
The coming week could take the stock to a good move upward if the Market condition remains to be good.
Take entries only after the Market sentiments are favoring.

#ETHUSDT.P LONG SWING SETUP Ethusdt
Direction long
leverage 5x/8x
ENTRY = 3091.00
STOP LOSS = 2791.00
1.TP = 3366.93
2.TP = 3708.82
3.TP = 3996.16

REAL - Updated analysis as we continue to build liquidityStocks > $5 are extra risky so proceed with caution.
Now I love this company for many fundamental reasons in addition to the obvious technical analysis that I've been showing you all.
This is a longer term hold forsure but I am looking at the bottom of this blue tapered selling channel as a bounce area and an opportunity to add to my existing swing position. Would be best if we can prove green tapering asap for a break out of this magenta selling channel.
Happy Trading :)
- TraderDaddyOG

AUDCHF I Triple bottom and potential bullish continuation Welcome back! Let me know your thoughts in the comments!
** AUDCHF Analysis - Listen to video!
We recommend that you keep this pair on your watchlist and enter when the entry criteria of your strategy is met.
Please support this idea with a LIKE and COMMENT if you find it useful and Click "Follow" on our profile if you'd like these trade ideas delivered straight to your email in the future.
Thanks for your continued support!

Swingtrade ATD.toOver the past two years ATD.to has traded seven times in a range bound in the upper side by the 50ema+8% (confirmed by an RSI of 70) and on the lower side by <50ema (confirmed by RSI below 40). It is again approaching the lower side of the range. A buy entry to the swing trade...
I have been swingtrading 1/3 of my long position

ALL TIME HIGH BREAKOUT STOCKNSE:DCAL
All information on this page is for educational purposes only,
we are not SEBI Registered, Please consult a SEBI registered financial advisor for your financial matters before investing And taking any decision. We are not responsible for any profit/loss you made.

ITDCThis stock breakout nearly 5 years consolidation level so create good opportunity for swing trade and only for educational purpose

MADHAVtook support from major level TGT will be 86,119
and this is only for educational purpose only
