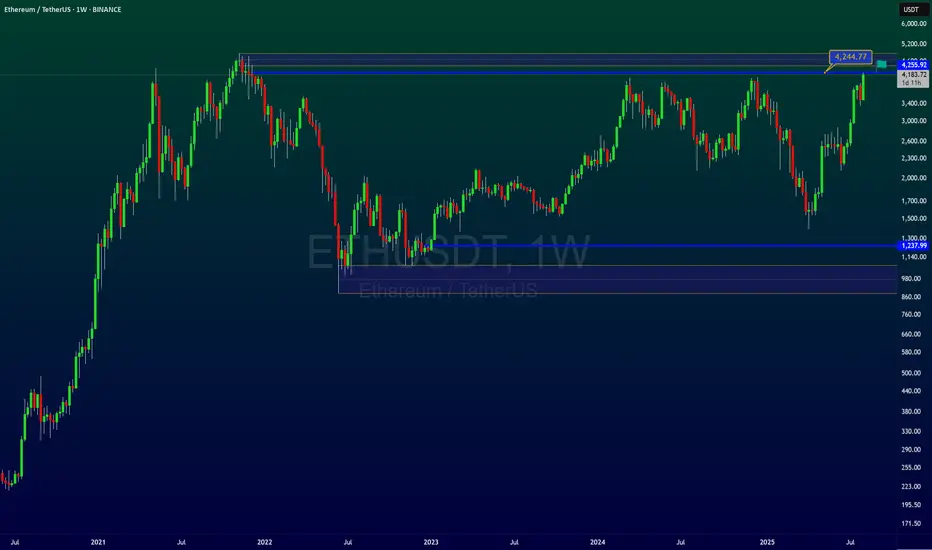
ETH all time high or reverse????Ethereum has returned to the top after a long time and is on the verge of breaking the top, but in my opinion this will not happen. Of course, it is possible to see new prices, but then it will enter a correction and this will happen in the next move that will start in the future.
So we should wait for a very good entry with a cheap and lower price.
Stay with me and boost me after introducing me to your friends.
Swingtrading
TTD crashIn the long term, this stock is in a side cycle and after seeing the top, it starts moving towards the bottom and goes through the natural market cycle, but very fast and intense.
The first support area for this stock is $48-50 and if it encounters strong buyers, it will move towards $69 and after correction to $125-127.
But if the bottom area is broken correctly, the target of this big and fast drop will be a price return to 19.
Be with me to enter and exit on time
Every boost and follow is a double motivation to continue

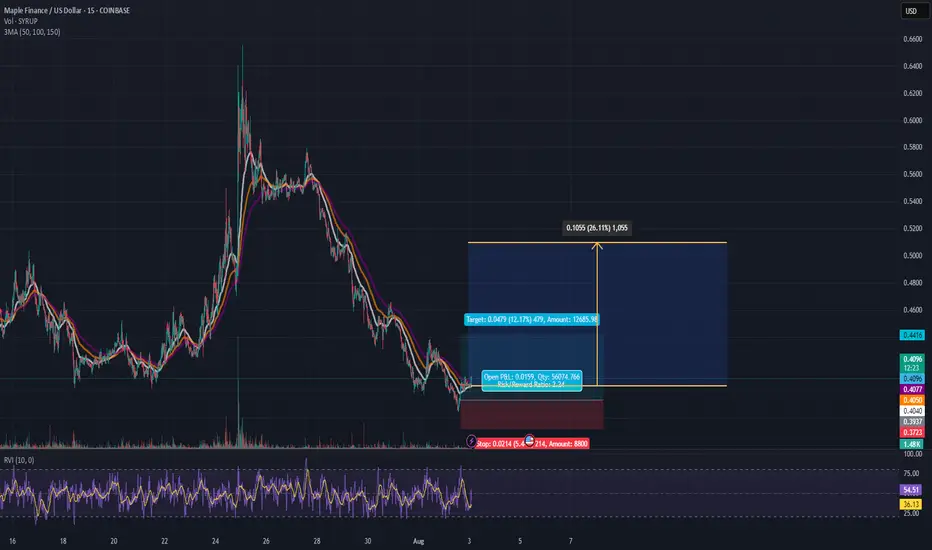
SYRUP Priming for a 12% Pop - Longterm ~20% PotentialHey Guys, My last posts were hidden (Again) ty TV, so I'm back at it and keeping it clean and to the point:
Maple Finance
SYRUPUSD
is forming a base at the $0.40 zone after a steep downtrend. Looks like the bleeding's slowing down and we're seeing signs of accumulation.
🍯 Entry: $0.402 - $0.4045
🛑 Stop: $0.3825 (5.4% risk)
🎯 Target 1: $0.4479 (+12.1%)
🚀 Target 2: $0.5100 (+20.6%)
📐 R/R Ratio: ~2.2
This is a structure-based long setup:
Flattening EMAs
Volume compression
Lower wick absorption (buyer presence showing up quietly)
💡 Target 2 ($0.5100) is not a short-term scalp – that's the stretch target IF this turns into full accumulation. Full exit at T1 is a solid take.
More setups on the way.
GBPUSD: Bullish Continuation Ahead?! 🇬🇧🇺🇸
GBPUSD violated a significant resistance cluster yesterday.
The market broke through that with a high momentum bullish candle.
Chances will be high that the pair will continue rising.
The next goal for the buyers is 1.35 psychological resistance.
❤️Please, support my work with like, thank you!❤️

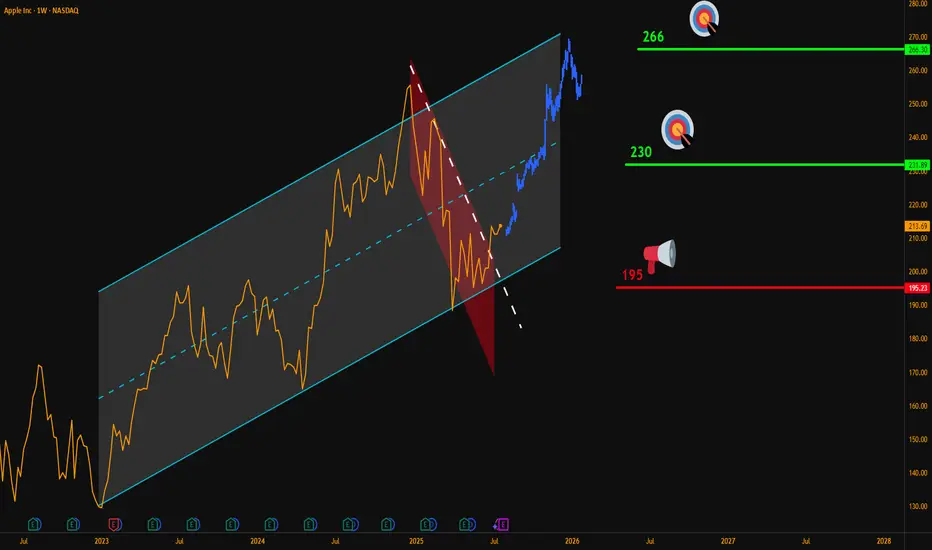
AAPL Weekly Breakout – Targeting $266Hello Traders,
Here’s my latest analysis on Apple (AAPL) based on the weekly chart.
🔍 Chart Breakdown:
Main Uptrend Channel (Blue): Price has respected this channel since 2023.
Red Downtrend Sub-Channel: Recent corrective phase is now broken.
Breakout Signal: Last week, AAPL closed above the sub-channel’s upper line, confirming bullish momentum.
📌 Updated Trade Setup Section:
Entry Zone: Around $215 (current price)
Stop-Loss: Weekly close below $195 (Risk = $20)
Targets:
✅ $230 (Reward = $15 → R:R = 0.75:1)
✅ $266 (Reward = $51 → R:R = 2.55:1)
Always confirm with your own strategy before entering a trade. Position sizing and risk control are key.
💬 Do you think AAPL can reach $266 before Q4 2025? Share your thoughts below!
NASDAQ:AAPL
XRP and 200% proif After a 100% gain in the previous signal, Ripple has a target of more than 200% ahead, and with a good buy, you can make a great profit.

BNBUSDT — Golden cross with a target at 804- 850BNB has broken the descending trendline and formed a clear reversal structure.
A golden cross (EMA 50 crossing EMA 200 from below) confirms bullish intentions. The price is now holding above 783 -a key level that aligns with the 0.618 Fibonacci retracement. A retest of the 778–768 area is expected, followed by a potential rally to 808–810.
If momentum continues, the 860 zone (Fib 3.618) becomes the next target. The uptrend remains intact. RSI supports the move, MACD is in positive territory, and volume remains stable.
On the fundamental side, BNB remains a central token in the Binance ecosystem. With no regulatory pressure in the short term and ongoing development of the platform, institutional and retail interest remains strong. General optimism across the altcoin space also provides momentum.
Holding the 768–778 area is key for further growth. A drop below could test 760 support, but the bullish structure remains valid.

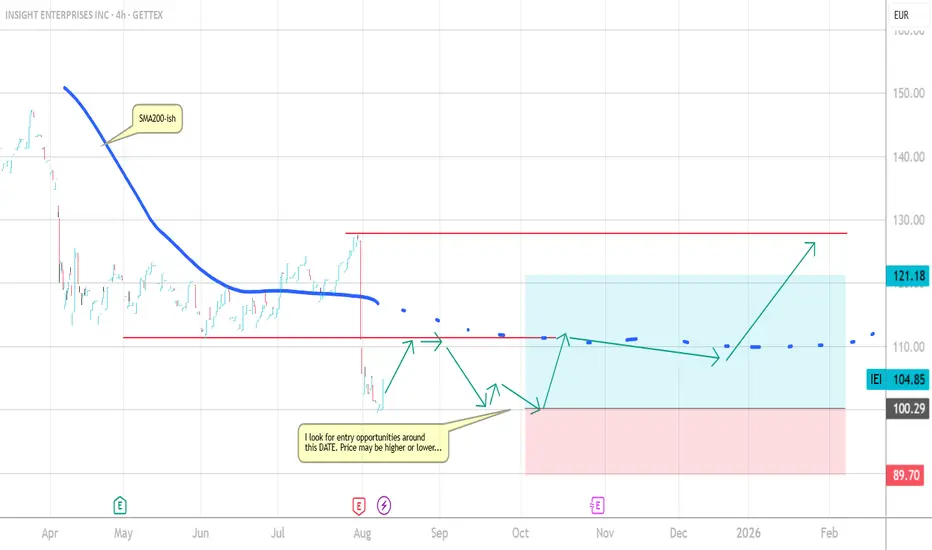
NSIT Insight Enterprises Forecast until early 2026Pretty bad year for NSIT but I see a chance for a rebound coming from early October 2025 with a participation in the x-mas / end of year ralley.
my forecast is shown as arrows in the chart. please feel free to contact me for some
seasonality chat and to get further ideas on that or maybe discuss.
leave a comment. what do you think?
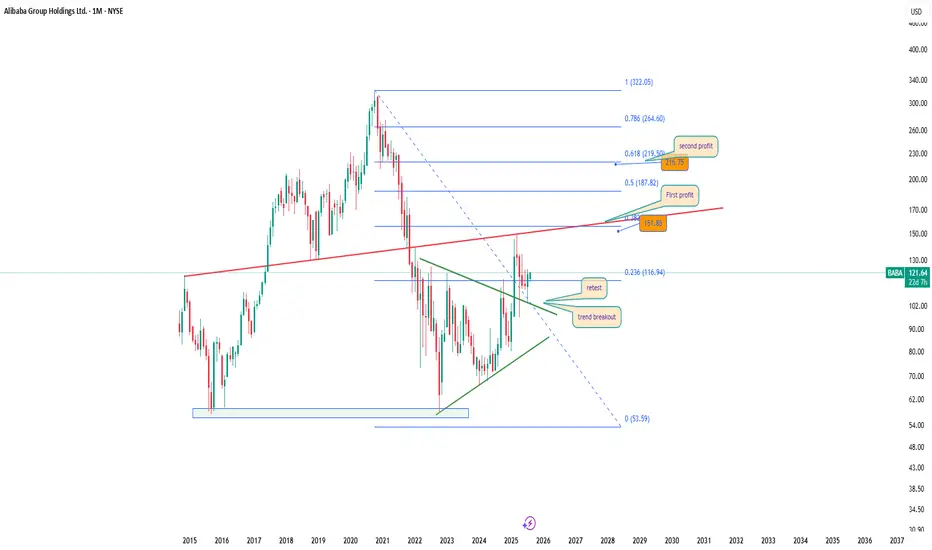
BABA 1M: Chinese favorite rising againTechnical setup:
Breakout from long-term triangle
Retest of trendline confirmed
Price holds above Fibo 0.236 (116.94)
First resistance: 151.85
Fibo targets:
→ 0.5: 187.82
→ 0.618: 219.50
Trade plan:
→ Hold after successful retest
→ Add on dips to 116–118
Targets: 151.85 / 187.82 / 219.50
Fundamentals:
Alibaba is restructuring around cloud and AI. Regulatory pressure from China is easing, and earnings are stabilizing. Buybacks and renewed institutional interest provide strong mid-term support.
Conclusion:
Alibaba may fall seven times, but rise eight — especially when Fibo and price action agree.
Big breakout in tvs motors Tvs motors gives good breakout. By crossing its all tym high tvs motors gives a great opportunity for swing( 8-10 % upside possible).
But tvs motors at 2954-2980
Target 3100 3200 3243 3540
Sl 2890

ADA Correction Nearing Completion — Is It Time to Load Up?After tagging the golden pocket resistance zone between $0.9208–$0.9527, ADA completed a clean 5-wave Elliott impulse right into a major resistance. Since then, price has corrected -25%, and we’re now likely nearing the end of an ABC correction — the final wave C.
🧩 Technical Breakdown
➡️ Wave A: 5-wave drop after the peak
➡️ Wave B: Bounce rejected at yearly open (yOpen) — that was a great short opportunity around $0.845
➡️ Wave C: Now working toward completion
🎯 C Wave Target Zone: $0.69–$0.65
This zone has strong confluence:
0.618 Fib retracement of the entire 5-wave move at $0.6732
1.0 TBFE (Trend-Based Fib Extension) aligns perfectly
Sell-side liquidity (SSL)
0.786 Fib Speed Fan support
Monthly 21 EMA/SMA adding a final confluence layer
🟢 Long Setup
Entry Zone: $0.69–$0.65 (ladder in)
Stop Loss: Below the monthly 21 EMA/SMA ($0.6)
Target 1: mOpen key resistance
Target 4: 0.666 Fib at ~$0.95
Risk:Reward: ~1:4+
💡 Educational Insight
After a 5-wave impulsive move, ABC corrections are common. Using the Trend-Based Fib Extension tool to project wave C, especially when paired with liquidity zones, VWAP, or moving averages, helps pinpoint high-probability reversal zones. It’s about confluence and reaction — not prediction.
🔍 Indicators
For this analysis, I’m using my own indicators
DriftLine – Pivot Open Zones and
MFT MA Support/Resistance Zones
both available for free. You can find them on my profile under “Scripts” and apply them directly to your charts for extra confluence when planning your trades.
_________________________________
💬 If you found this helpful, drop a like and comment!
SOL's Golden Pocket: Is This the Bottom?SOL just tapped into the golden pocket zone and swept sell-side liquidity. Creating a high-probability long opportunity.
🟢 Long Setup:
Entry Zone: $156.67 – $151.50
Stop Loss: Below $150 (clear invalidation)
Target: $172
Risk:Reward: solid R:R setup
Why This Zone? Confluence Breakdown:
Golden Pocket retracement (0.618–0.666)
1.272 Trend-Based Fib Extension
Monthly Order Block
0.5 Fib Speed Fan support
Key Level at $154.81
Anchored VWAP support layer
Pitchfork 0.618/0.666 alignment
SSL (Sell-Side Liquidity) swept
nPOC at ~$152 offers a prime entry if we see another leg down
💡 Tip: Ladder in entries within the zone and size up near nPOC if price dips further. Manage risk carefully and watch how price reacts at the zone.
🧠 Educational Insight
Golden pockets (the 0.618–0.666 Fibonacci zone) are some of the most respected levels in trading often acting as key reversal zones, especially when stacked with other tools. In this case, we’ve got a rare confluence: anchored VWAP, nPOC, monthly OB, SSL sweep etc. all lining up with the golden pocket.
When multiple technical factors align, they don’t just increase probability, they give you a tighter invalidation and a better risk-to-reward setup. That’s how professional traders spot sniper entries.
_________________________________
💬 If you found this helpful, drop a like and comment!

GBPNZD: Another Bullish Wave Coming 🇬🇧🇳🇿
GBPNZD respected a strong rising trend line on a daily.
The price formed a cup & handle pattern on that
and violated its horizontal neckline yesterday.
I think that another up movement is ahead.
Goal - 2.26
❤️Please, support my work with like, thank you!❤️

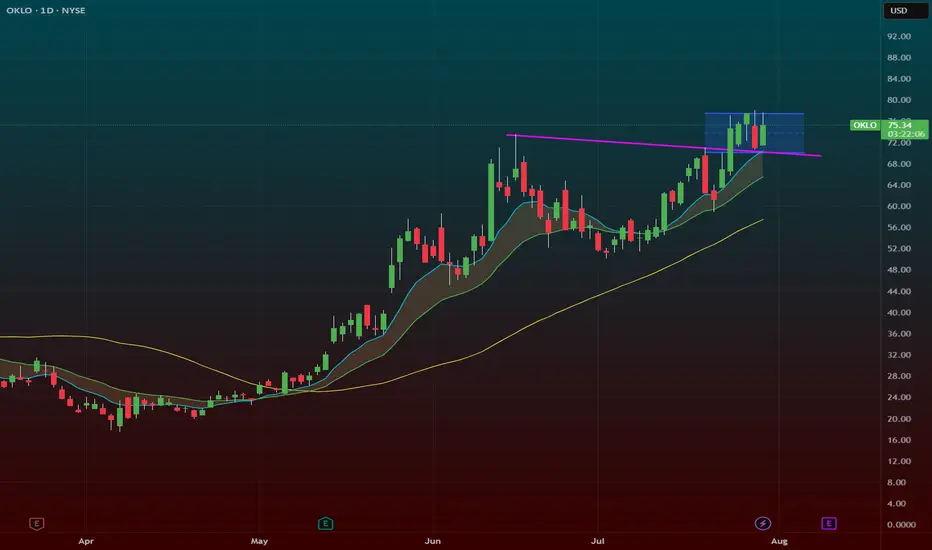
$OKLO – Back to the Moneymaker: HTF + C&H Combo at $77.50NYSE:OKLO – Back to the Moneymaker: HTF + C&H Combo at $77.50
Back to my bread and butter setup — NYSE:OKLO is setting up again, and it’s 🔥. We’ve got a high tight flag forming right above the 9 EMA, and to sweeten the deal, there’s a cup and handle structure layered in too.
🔹 The Setup:
After a strong breakout, NYSE:OKLO has spent the past week consolidating tightly above the 9 EMA.
Price action is coiled, volume has dried up — exactly what I want to see before a power move.
This is a high tight flag + cup and handle combo, one of my favorite high-probability setups.
🔹 Trigger Level:
Watching the $77.50 breakout zone — that’s the line in the sand. If you get a good intraday dip to support you can pre-empt the play i like to often scale in a half in anticipation if the market is in a runup phase
A clean push through with volume, and this can speed up fast.
🔹 My Trade Plan:
1️⃣ Entry: Either starter near 9 EMA support or confirmation on breakout over $77.50.
2️⃣ Stop: Under the 9 EMA — no reason to stay if it breaks down.
3️⃣ Target: Measured move extension if it clears $77.50 with juice.
Why I Love This Setup:
HTF + C&H = momentum fuel
This name has already proven itself — we’ve made money here before
The structure, the consolidation, and the setup are all textbook
LTC Wakes Up — Bullish Adam & Eve Targets $150+LTC is gaining serious momentum, breaking through key resistance levels and printing a clean Adam & Eve bullish reversal pattern. The breakout signals a potential shift in the macro trend — and the chart is offering clear setups.
✅ Breakout Through $100 & Pattern Confirmation
LTC confirmed the Adam & Eve double bottom with a breakout above $100, a major psychological resistance.
The neckline retest around $105 acted as a Market Structure Shift (MSS) confirmation, with upside wicks signaling strong demand and a reversal.
$100–$105 Support Zone: Stacked Confluence
This zone offered a high-probability long setup due to multiple overlapping technical factors:
Yearly Open (via DriftLine - Pivot Open Zones ): $103.28
0.382 Fib Retracement: $104.67 (from $76.17 low to $122.29 high)
Anchored VWAP from the $76.17 low
POC of 1-Year Trading Range: ~$102
233 EMA & SMA (4H TF): Both moving averages aligned between $103–$100, acting as dynamic support
✍️ A clean, high-confluence demand zone between $100–$105 — ideal for long setups.
Upside Structure & Next Long Opportunity
➡️ Current Price: ~$127
A fresh long setup may present itself around $120 on a pullback
➡️ Pattern Target: $150
🌀 1.0 TBFE: $149.28
🌀 1.618 TBFE: $147.31
🔺 Key Swing High / Liquidity Pool (BSL): $147–$150 — an area to watch for possible rejection
🔴 Short Setup Consideration
➡️ Short zone: $147–$151
Only short on clear confirmation: SFPs, rejections, or bearish order flow
➡️ Downside target: $135 (1:2 R:R potential)
Macro Bullish Target: $198–$200
If LTC breaks and holds above $150, the next macro target becomes:
🌀 0.618 Fib Retracement (from $295.7 high to $40.3 low): $198.14
$200 Psychological Resistance: Major round number, likely to act as magnet and profit-taking zone
🛠 Indicators Used:
DriftLine — Pivot Open Zones
↳ For key levels like the Yearly Open, crucial in confluence stacking
📚 Educational Insight: Understanding the Adam & Eve Pattern
The Adam & Eve pattern is a classic bullish reversal formation that often marks the end of a downtrend or a major correction phase.
Adam forms first: a sharp, V-shaped low — often panic-driven or capitulation.
Eve follows: a rounded, more gradual bottom, showing accumulation and stabilisation.
Once price breaks above the neckline, the pattern is considered confirmed.
A retest of the neckline (like LTC at ~$105) is often the best entry point, especially when supported by confluence like Fib levels, VWAP, or key levels.
In LTC’s case, the breakout above $100 and successful retest at $100–$105 validates the pattern — with a measured move pointing toward $150, and a macro Fib target at $198.14 aligning with the $200 psychological level.
Summary:
With a confirmed breakout, strong technical confluence, and clearly defined targets, LTC is setting up for continuation. Watch $120 for long entries and monitor $150 for potential rejection.
_________________________________
💬 If you found this helpful, drop a like and comment!

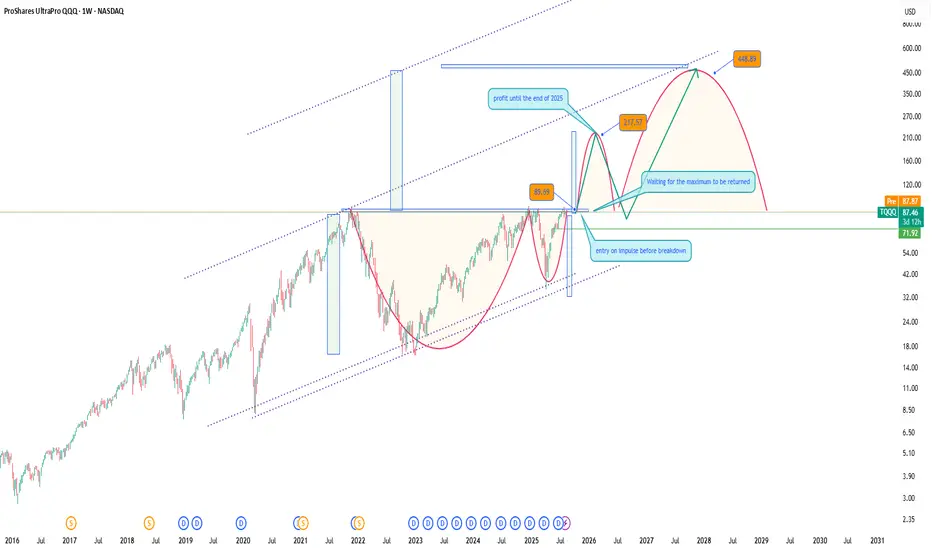
ProShares UltraPro QQQ (TQQQ) LONGThe Technology Sector Continues to Break Records
The tech sector keeps setting new highs, and alongside individual stocks, it's a great idea to consider investing in an ETF that mirrors the profits of the NASDAQ 100 index. One of the most attractive options is TQQQ - it’s more affordable than the index itself, yet offers similar growth potential aligned with the entire tech sector.
I expect continued growth through the end of the year, assuming the geopolitical landscape remains relatively stable.
From a technical standpoint, those looking to minimize risk might prefer to wait for a retest of previous highs. However, my approach is to gradually build a position both before the breakout and after the retest of the highs.
A classic technical analysis pattern -the cup formation, also supports the bullish case for entry. As George Soros wrote in his book: “What moves the market : our expectations or the events themselves?” I’d say it’s both. The key is not to miss the wave.
P.S. Don’t forget: with TQQQ, you also receive dividends - a nice bonus while riding the trend.
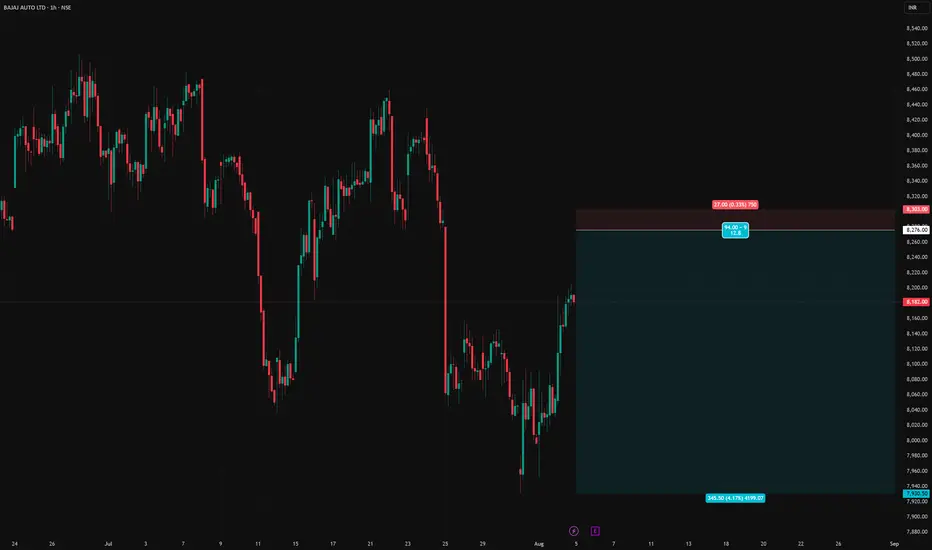
BAJAJ-AUTO short setupBAJAJ-AUTO short setup
Entry price - 8276
Stop Loss - 8303
Target - 7391
Risk Reward - 1:12.8 (Approx 1:13)
A potential break and retest on MS.OptionsMastery:
🔉Sound on!🔉
📣Make sure to watch fullscreen!📣
Thank you as always for watching my videos. I hope that you learned something very educational! Please feel free to like, share, and comment on this post. Remember only risk what you are willing to lose. Trading is very risky but it can change your life!

A potential Swing Trade soon on SPY!?OptionsMastery:
🔉Sound on!🔉
📣Make sure to watch fullscreen!📣
Thank you as always for watching my videos. I hope that you learned something very educational! Please feel free to like, share, and comment on this post. Remember only risk what you are willing to lose. Trading is very risky but it can change your life!

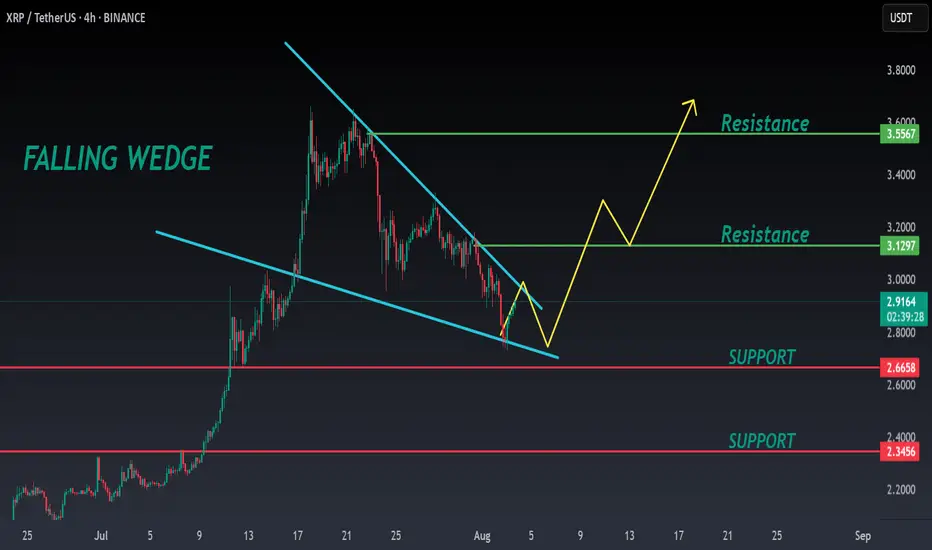
XRP ANALYSIS🔮 #XRP Analysis - Update 🚀🚀
💲 We can see that there is a formation of Falling Wedge Wedge Pattern in #XRP and we can see a bullish movement after a good breakout. Before that we would see a little retest and and then a bullish movement.
💸Current Price -- $2.9130
📈Target Price -- $3.1290
⁉️ What to do?
- We have marked crucial levels in the chart . We can trade according to the chart and make some profits. 🚀💸
#XRP #Cryptocurrency #Breakout #DYOR
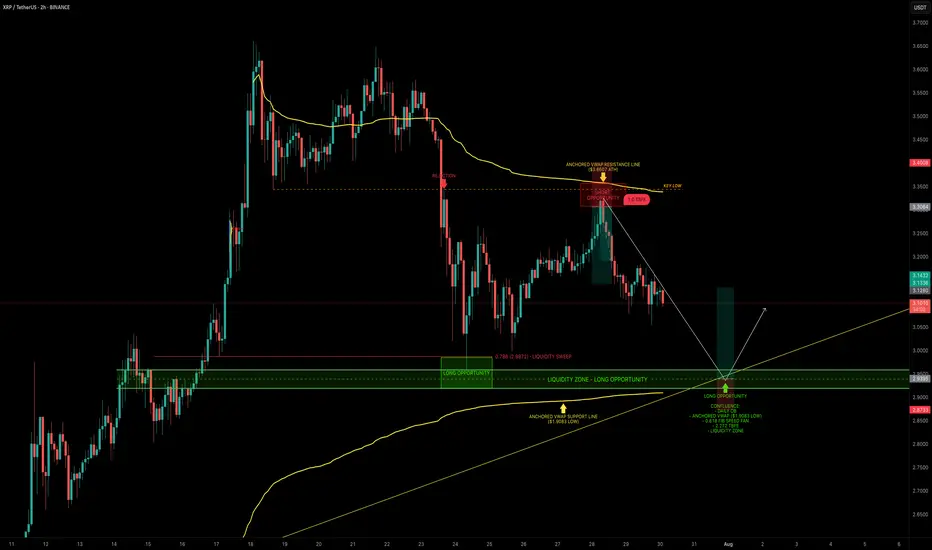
XRP — Mapping Out the Next High-Probability Long SetupXRP continues to respect key levels, delivering clean setups and strong technical reactions.
📉 Recent Price Action Recap
After the flush from $3.65 into the $3.00 support zone, XRP printed a solid bounce back toward the $3.30 resistance area, forming a clean short setup between $3.30–$3.35.
Price is now trading mid-range within the 6-day consolidation.
🟢 Next High-Probability Long Setup
A prime long opportunity lies between $2.96 and $2.9175 sitting within a key daily order block.
Confluence at this zone includes:
Liquidity pool just below the $2.9555 swing low
Anchored VWAP from the $1.9083 swing low resting just under the block
0.618 Fib Speed Fan lining up as dynamic support (July 30 – Aug 2)
2.272 Trend-Based Fib Extension at $2.9297
📈 Long Trade Setup
Entry Zone: $2.96 – $2.9175
Stop Loss: Below anchored VWAP (clear invalidation)
Target: $3.1/$3.13+
R:R: ~1:3+
💡 Educational Insight
This setup is a great example of how multiple tools layered together (like Fibonacci levels, VWAPs, order blocks and liquidity zones) can significantly increase the probability of a trade playing out.
When structure, volume-based tools and time alignment all point to the same area, it creates a high-confluence trade zone. These are the areas where risk is most defined and reward is most favourable, a principle every technical trader should anchor their strategy around.
_________________________________
💬 If you found this helpful, drop a like and comment!
Want breakdowns of other charts? Leave your requests below.
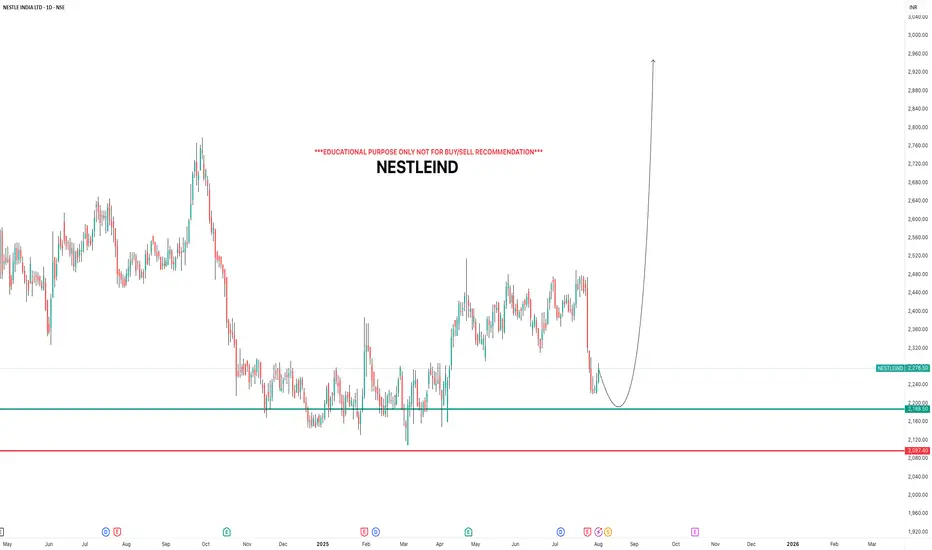
NESTLEINDIAi Observed these Levels based on Price Action and Demand & Supply which is my own Concept "PENDAM CONCEPTS"... Please don't take any trades based on this chart/post... Because this chart is for educational purpose only not for Buy or Sell Recommendation... Thank Q
Bitcoin: New All-Time High — What’s Next?Bitcoin had an incredible run, breaking the old all-time high ($111,980) with strong bullish momentum and setting a fresh ATH at $123,218 (Binance). We just witnessed the first major corrective move of ~6% and a decent bounce so far — but the big question is:
What’s next? Will Bitcoin break higher over the summer or form a trading range here?
Let’s dive into the technicals.
🧩 Higher Timeframe Structure
May–June Range:
BTC was stuck between $110K–$100K, forming an ABC corrective pattern. Using trend-based Fib extension (TBFE) from A–B–C:
✅ C wave completed at $98,922 (1.0 TBFE)
✅ Upside target hit at $122,137 (-1 TBFE)
Full Bull Market TBFE:
➡️ 1.0 → $107,301 → previously rejected
➡️ 1.272 → $123,158 → recent rejection zone
Pitchfork (log scale):
➡️ Tapped the upper resistance edge before rejecting.
Previous Bear Market Fib Extension:
➡️ 2.0 extension at $122,524 hit.
2018–2022 Cycle TBFE:
➡️ 1.618 at $122,011 tapped.
Macro Fibonacci Channel:
➡️ Connecting 2018 low ($3,782), 2021 ATH ($69K), 2022 low ($15,476) →
1.618–1.666 resistance band: $121K–$123.5K.
✅ Conclusion: Multiple fib confluences mark the $122K–$123K zone as critical resistance.
Daily Timeframe
➡️ FVG / Imbalance:
Big daily Fair Value Gap between the prior ATH and $115,222 swing low.
BTC broke the prior ATH (pATH) without retest → a pullback to this zone is likely.
Lower Timeframe / Short-Term Outlook
We likely saw a completed 5-wave impulse up → now correcting.
The -6% move was probably wave A, current bounce = wave B, next leg = wave C.
➡ Wave B short zone: $120K–$121K
➡ Wave C target (1.0 TBFE projection): ~$113,326
➡ Confluence at mid-FVG + nPOC
Trade Setups
🔴 Short Setup:
Entry: $120,300–$121,000
Stop: Above current ATH (~$123,300)
Target: $113,500
R:R ≈ 1:2.3
🟢 Long Setup:
Entry: Between Prior ATH and $113,000
Stop: Below anchored VWAP (~$110,500)
Target: Higher, depending on bounce confirmation.
🧠 Educational Insight: Why Fibs Matter at Market Extremes
When markets push into new all-time highs, most classic support/resistance levels disappear — there’s simply no historical price action to lean on. That’s where Fibonacci extensions, channels, and projections become powerful tools.
Here’s why:
➡ Fibonacci extensions (like the 1.272, 1.618, 2.0) help estimate where trend exhaustion or profit-taking zones may appear. They are based on the psychology of crowd behavior, as traders anchor expectations to proportional moves from previous swings.
➡ Trend-Based Fib Extensions (TBFE) project potential reversal or continuation zones using not just price levels, but also the symmetry of prior wave moves.
➡ Fibonacci channels align trend angles across multiple market cycles, giving macro context — like how the 2018 low, 2021 ATH, and 2022 low project the current 1.618–1.666 resistance zone.
In short:
When you don’t have left-hand price history, you lean on right-hand geometry.
That’s why the $122K–123K zone wasn’t just random — it’s a convergence of multiple fib levels, cycle projections, and technical structures across timeframes.
⚡ Final Thoughts
Bitcoin faces major resistance around $122K–$123K backed by multiple fib and structural levels. A retest of the prior ATH zone (~$112K–$113K) looks probable before the next big directional move. Watch lower timeframe structure for signs of completion in this corrective phase.
_________________________________
💬 If you found this helpful, drop a like and comment!
Want breakdowns of other charts? Leave your requests below.
