NFLX Great Long Term but Risky Shorter Term NASDAQ:NFLX
Looks riskier shorter term due to confluence resistance, but not impossible to see larger breakout here.
Longer term (2027-2028) $5,000 price target.
Swingtrading

TBO TEK LTD – 19 May Trendline Resistance Test Incoming 📌 Trade Plan (Aggressive Swing Setup):
Buy above: ₹1,250 (on breakout + volume confirmation)
Stoploss: ₹1,195
Target 1: ₹1,310
Target 2: ₹1,385
Sell Below: ₹1,180 (if price rejects the trendline with high volume)
🔎 Technical Insights:
Strong volume buildup near resistance
RSI trending upwards with bullish momentum
Trendline acting as dynamic resistance since Nov 2024
For Education Purposes Only

GBP/USD 4H Analysis – Bearish Bias in PlayThe market never lies, it simply reflects behaviour. And right now, the behaviour around GBP/USD suggests one thing: bearish momentum.
As seen in this clean 4H chart, price failed to hold above the key horizontal resistance zone and now showing signs of weakness after a retest. I’ve marked a potential bearish projection (red arrow) based on:
Key Technical Factors:
Rejection from a prior structure zone
Clean lower highs forming
Breakdown and retest of minor support
Room below toward - near 1.30300 (next yellow line)
This setup aligns with a potential swing move down toward the next area. If price follows through, we could see a solid continuation to the downside in the coming sessions.
Patience and discipline over prediction. Let price confirm the story it’s telling.

EURCAD: Another Bearish Pattern 🇪🇺🇨🇦
Earlier, we spotted a head & shoulder pattern on EURCAD on a daily
and a confirmed breakout of its neckline.
Analysing a price action, I spotted another bearish formation today.
The price formed a bearish flag pattern, and it is retesting a broken
trend line at the moment.
I think that the pair may drop lower soon.
Next support - 1.5503
❤️Please, support my work with like, thank you!❤️
I am part of Trade Nation's Influencer program and receive a monthly fee for using their TradingView charts in my analysis.

PEL | Breakout Setup | Short-Term Buy | Target ₹1100🟩 Trade Plan:
Buy Zone: ₹1059 – ₹1060
Target: ₹1100 (approx. 3.77% upside)
Stop Loss: ₹1037
Risk-Reward Ratio: ~2:1
Setup Type: Breakout above resistance zone (marked on chart)
Volume Confirmation: Strong bullish candle with high volume
RSI Confirmation: RSI bouncing above 60, momentum building
📈 Chart Annotations (TradingView Tips):
Draw resistance zone on 1H around ₹1060 – ₹1070 (breakout zone)
Plot EMA (9 & 21) or EMA crossover to confirm short-term bullish trend
Use RSI (14) to highlight momentum breakout
Highlight entry point, stoploss, and target with labels
Use TradingView’s “Long Position Tool” to visually display RR
For Education Purposes only

OIL – Oil India Ltd | Target: ₹429.00🟢 Trade Details:
LTP: ₹417.30
Recommended Buy Range: ₹415.50 – ₹416.00
🎯 Target: ₹429.00
🛑 Stop Loss: ₹408.70
🔍 Technical Snapshot:
✅ Strong bullish candle with volume confirmation
✅ EMA crossover supports the uptrend (9 EMA > 13 EMA)
✅ RSI at 62.22 shows healthy momentum
✅ Breakout above previous range box visible on Daily & 1H TF
📊 BB %B at 0.82 – still room before overbought levels
💼 Strategy:
Suitable for short-term MTF holding (2–5 days)
Risk-Reward ~1:1.5
Trail SL to cost once ₹424+ is breached
Use smaller timeframes (15m / 1H) to confirm entry with volume
For Education Purposes Only

GBPUSD SWING: +1000 Pips Later, GU Is Still Climbing in Stealth 🧠 Last Idea Recap from Early Feb 2025:
- We previously caught a multi-leg upside off the bottom channel (~1.2550) with over 350 pips in structured recovery.
- Price is now grinding within upper consolidation, testing the 1.3315–1.3350 supply shelf.
Note: Check out the previous Idea from related publications to verify.
Update: GBPUSD has now delivered over 1000+ pips in swing structure from the bottom breakout (1.2550s), with even more gains harvested through intra-day and scalp setups inside this multi-week ascending channel.
Recent UK macro strength (GDP beat across MoM, QoQ, YoY) injected new life into price action, adding fundamental confluence to the clean bullish technicals already building. Price continues to respect the rising structure with higher lows and controlled consolidation near a breakout shelf at 1.3350–1.3375.
🔍 Current Structure :
- Bullish flag forming near key supply zone
- No sign of distribution or exhaustion
- Channel still intact, buyers defending every dip
Next Leg:
- Break and hold above 1.3375 could fuel another 100–150 pip run toward 1.3470 and eventually 1.3550+
- Short-term traders: watch for a stop-hunt sweep before the real move
Entry Notes:
- Use lower timeframes (4H/1H) for confirmation wicks, volume spikes, or engulfing candles
- Avoid getting trapped on the first breakout candle—look for retest/reclaim plays
Whether you’re swinging or scalping, this pair has remained one of the cleanest GBP structures in months, and this ride might not be over yet.

ENDURANCE – Breakout from Supply Zone | Target ₹2136 ⚙️ ENDURANCE TECH LTD (NSE:ENDURANCE)
Time Frame: 15min / 1 Hour
📊 Trade Type: Positional / Intraday Momentum
📌 Buy Zone: ₹2042 (Above supply zone breakout)
🎯 Target 1: ₹2136
🎯 Target 2: ₹2287
🛑 Stop Loss: ₹1915
📈 CMP: ₹2022.60
📌 Chart Insights:
✅ Strong volume breakout from horizontal resistance
✅ Cleared EMA 9/13/26 crossover
✅ RSI > 60 indicates bullish momentum
✅ Bollinger Band breakout (BB %B > 1.00)
✅ Breaking above pivot R2 zone (₹2042) opens room to R3
⚠️ Strategy:
Enter on confirmation above ₹2042 with volume support on 15min or 1H timeframe.
Stop loss below breakout candle or EMA cluster around ₹1915.
Trailing stop as it approaches targets.
For Education Purposes Only

S&P500 - The bottom we have been waiting for!The S&P500 - TVC:SPX - officially created the bottom:
(click chart above to see the in depth analysis👆🏻)
This month we officially saw one of the craziest stock market fakeouts of the past decade. With a drop and reversal rally of about +15%, the S&P500 is about to even close with a green monthly candle, which then indicates that the stock market bottom was created.
Levels to watch: $120, $250
Keep your long term vision!
Philip (BasicTrading)

HIMS – Pullback Opportunity After Massive RunHIMS has been one of the hottest stocks in the market recently, with a massive run fueled by strong earnings. But now we’re seeing the first meaningful pullback — and this could be a golden opportunity:
🔹 Earnings Gap Reversal (Bullish Signal)
Despite an earnings gap down, buyers stepped in aggressively, pushing the stock higher.
This is a classic earnings gap down reversal — a strong sign of demand.
🔹 First Pullback Opportunity
Historically, the first pullback after a major run tends to get bought.
I’m watching two key levels for a potential buy:
The shaded zone between the 9 EMA and 20 EMA (dynamic support).
The 0.38 - 0.50 Fibonacci retracement for added confirmation.
🔹 My Trading Plan:
1️⃣ Initial Entry: Starter position in the shaded EMA zone (9 EMA - 20 EMA).
2️⃣ Confirmation Add: If price bounces off the Fib zone (0.38 - 0.50) with strength.
3️⃣ Stop Loss: Below the 20 EMA for any initial position — keeping risk tight.
🔹 Why This Setup is Compelling:
Strong run + earnings reversal shows real buyer interest.
First pullback after a big run is typically a strong buying opportunity.
The dual confluence of EMAs + Fibonacci enhances this setup.
⚠️ Risk Management: Tight stop below 20 EMA — always control risk.

MKVENTURES CAPITAL – Positional Breakout Setup📈 Buy Above: ₹1,700 (Breakout Zone)
Stoploss: ₹1,630
Target 1: ₹1,790
Target 2: ₹1,880
🔹 RSI is bullish, above 60
🔹 Strong volume build-up
🔹 Near resistance zone – breakout likely
📉 Sell Below: ₹1,630 (Trend Reversal)
Stoploss: ₹1,700
Target: ₹1,550
📊 Chart: Daily
📌 Strategy: Resistance Breakout with RSI & Volume Confirmation
💡 Risk-Reward: 1:2 (Good for swing trade)
For Education Purposes Only

Bitcoin - The Bottom Is In!Bitcoin ( CRYPTO:BTCUSD ) is reversing right now:
Click chart above to see the detailed analysis👆🏻
It was really just a matter of time until Bitcoin actually manages to create a potential short term and longer term bottom. With this monthly candle, bulls are taking over again and starting to buy cryptos quite heavily. The chart just tells us that this is not the end, but rather the continuation.
Levels to watch: $70.000, $300.000
Keep your long term vision,
Philip (BasicTrading)

Nifty back to bull controllhi Traders,
Weekly the swing had a correction of 38%.
The daily time frame's Inverted H&S pattern is a confirmation of the trend change(from correction to impulse wave)
Nifty 50 will make a move from 500 to 1500 points till the previous high of the weekly swing.
The targets are mentioned in the chat.
As we have 14days to expiry, there is enough time to hit target 1. Interested traders buy ATM CALL option or FUTURES
sbull.co

ADITYA BIRLA CAPITAL LTD – Trend Reversal Breakout Trade🧠 Technical Highlights:
Downtrend Channel Breakout: Clear breakout from a falling channel pattern
Resistance Break: Strong breakout above supply zone of ₹204–₹210
Volume: Massive volume spike validates bullish strength
RSI: Above 70, indicating strong momentum but not overbought yet
🟢 Buy Setup
Buy Above: ₹219 (today's close confirms breakout)
Stoploss: ₹204 (below the previous resistance/new support)
Target 1: ₹235
Target 2: ₹248
Target 3: ₹260+ (swing/high-risk high-reward)
🔻 Sell/Short Setup (only if reversal)
Sell Below: ₹203
Stoploss: ₹210
Target: ₹190, ₹178
📅 Timeframe: Short-to-Medium Term (2–6 weeks)
📊 Risk-Reward: ~1:2.5
For Education Purposes Only

AAPL Trade Plan – 2025 Outlook📊With global markets reacting to renewed tariff talk from Trump, Apple (AAPL) NASDAQ:AAPL could face short-term volatility—but that’s also opportunity. As fears of a trade war ripple across Asia and Europe, AAPL may temporarily dip, especially with supply chain exposure in China.🍏📉📈
📌 Entry Zones (Buy the fear, not the panic):
1️⃣ 194 – Light entry as weakness sets in
2️⃣ 180 – Strong support historically
3️⃣ 166 – High-conviction zone if macro panic escalates
🎯 Profit Targets (Scale out as strength returns):
✅ 209 – Quick recovery zone
✅ 230 – Pre-fear valuation
✅ 260+ – Full macro recovery with bullish momentum
📈 Strategy: Let the news create emotion. You trade the levels.
⚠️ DISCLAIMER: This is not financial advice. Just sharing my personal trading plan based on current macro trends and technicals. Always do your own research and manage your risk.

RKLB Gap Down Earnings Reversal Play + Flag BreakoutTwo powerful setups are in play here, and both are primed for action:
🔹 Setup 1: Earnings Gap Down Reversal (Kicker Candle)
Post-earnings flush, buyers stepped in hard — this has been a relentless pattern in this market.
Even on earnings misses, buyers are aggressive. We saw the same setup work beautifully on NASDAQ:TEM and NYSE:HIMS recently.
This is a kicker candle setup — strong reversal signal after a gap down flush.
🔹 Setup 2: Flag Breakout at $23.50
Price is coiling into a tight flag, with a breakout level at $23.50.
Risk is defined, with stops at $22, keeping the trade tight.
🔹 My Trading Plan:
1️⃣ Initial Position: Buying May 30th $25 Calls today.
2️⃣ Risk Management: Stop at $22 for the calls and underlying stock.
3️⃣ Add Size: On a clean breakout over $23.50.
🔹 Why This Setup is Hot:
The earnings gap down reversal has been a killer setup in this market — buyers are dominating.
Dual setup means two chances to win: Reversal + Flag Breakout.
Tight risk, with a clear invalidation at $22.
⚠️ Risk Management: Tight stop at $22 — this is a LOW-risk, high-reward setup.

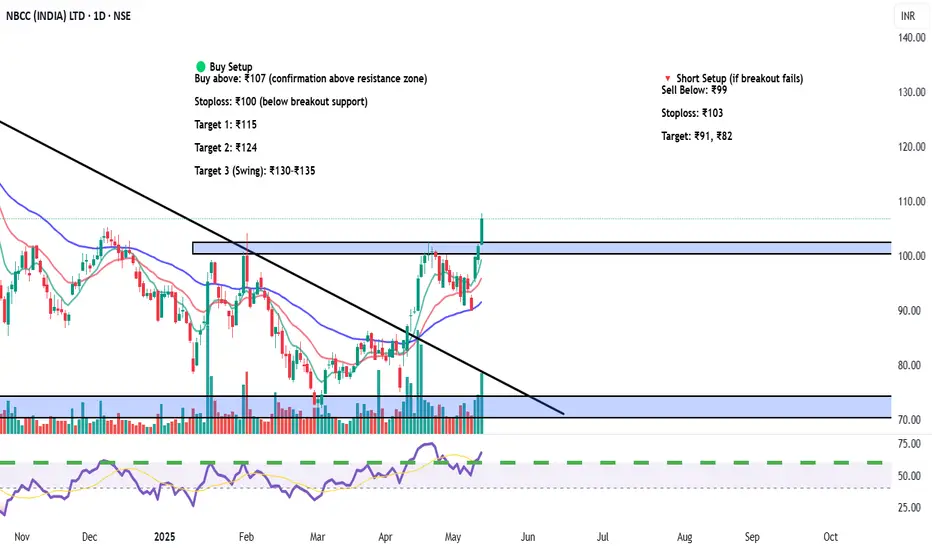
NBCC (India) Ltd (NSE: NBCC) – Breakout Trade Setup🧾 Equity Research Summary – NBCC (India) Ltd.
Sector: Construction & Infrastructure – Government PSU
Technical Setup: Trendline breakout + Base retest + Volume surge
Support Zone: ₹68–₹75
Breakout Zone: ₹100–₹103
Upside Potential: Strong move expected due to order book + infra push
Catalyst:
Government infrastructure spending
Order wins from CPWD, NBCC contracts, redevelopment projects
📅 Timeframe: Short-to-Medium Term (2–4 weeks)
📊 Risk-Reward: 1:2.5
🟢 Buy Setup
Buy above: ₹107 (confirmation above resistance zone)
Stoploss: ₹100 (below breakout support)
Target 1: ₹115
Target 2: ₹124
Target 3 (Swing): ₹130–₹135
🔻 Short Setup (if breakout fails)
Sell Below: ₹99
Stoploss: ₹103
Target: ₹91, ₹82
For Education Purposes Only
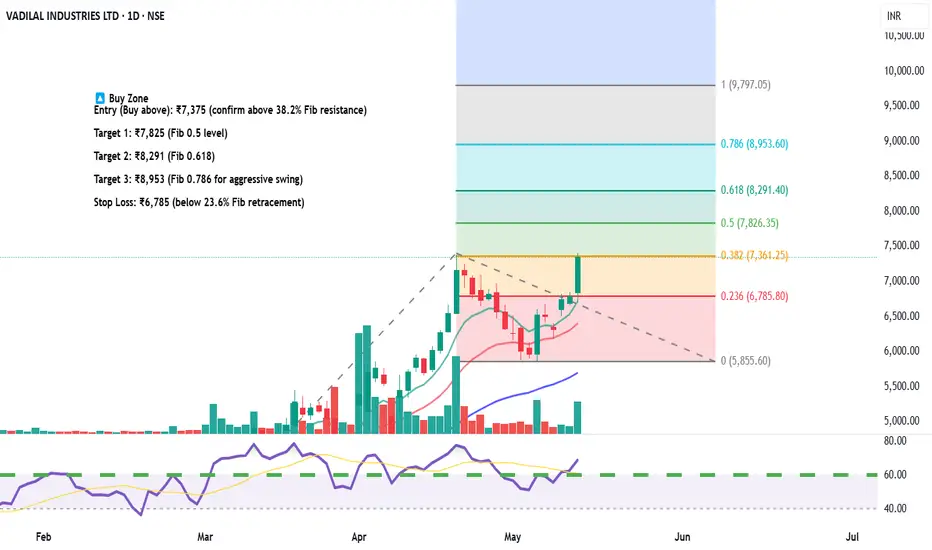
Vadilal Industries – Equity Trade Setup & Research View🟢 Long Trade Setup (Bullish Reversal Play)
Current Price: ₹7,346.50
Fibonacci Level Tested: 38.2% at ₹7,361 — a crucial breakout level
Trendline Breakout: Price has broken above falling trendline with volume confirmation
RSI: Near 60 – bullish momentum building
🔼 Buy Zone
Entry (Buy above): ₹7,375 (confirm above 38.2% Fib resistance)
Target 1: ₹7,825 (Fib 0.5 level)
Target 2: ₹8,291 (Fib 0.618)
Target 3: ₹8,953 (Fib 0.786 for aggressive swing)
Stop Loss: ₹6,785 (below 23.6% Fib retracement)
🔻 Short Trade Setup (if rejection happens)
Sell Below: ₹7,200
Target: ₹6,785
Stoploss: ₹7,375
📅 Timeframe: Daily (1D)
📊 Risk/Reward Ratio: 1:2.5+
🔁 Valid for: Next 2–4 weeks
For Education Purposes Only
GBPJPY: Important Breakout 🇬🇧🇯🇵
GBPJPY successfully violated and closed above a major
daily resistance cluster.
It opens a potential for more growth now.
Next resistance - 197.3
❤️Please, support my work with like, thank you!❤️
I am part of Trade Nation's Influencer program and receive a monthly fee for using their TradingView charts in my analysis.

OptionsMastery: Looking for a breakout on HOOD!🔉Sound on!🔉
📣Make sure to watch fullscreen!📣
Thank you as always for watching my videos. I hope that you learned something very educational! Please feel free to like, share, and comment on this post. Remember only risk what you are willing to lose. Trading is very risky but it can change your life!

Gabriel India Ltd (GABRIEL) – Weekly Resistance Breakout Setup✅ Trade Idea:
Price has reclaimed the 0.618 retracement at ₹608.25
Breakout above the ₹612 horizontal level (weekly closing basis)
Volume is rising and RSI shows strong uptrend
💰 Buy Zone:
Entry: ₹610 – ₹613
(preferably above ₹612 on strong 15min or 1H candle close)
🎯 Targets:
T1: ₹630 (previous minor supply zone)
T2: ₹646.65 (Fib 0.786 level)
T3: ₹695.55 (Fib 1.0 extension)
T4: ₹836.85 (1.618 extension for swing positional)
🛑 Stop Loss:
Intraday SL: ₹598 (below 9 EMA on 1H)
Swing SL: ₹581 (Fib 0.5 retracement support)
🔁 Strategy:
Wait for confirmation via volume + RSI > 60
Trail SL to ₹610 once ₹630 is hit
Lock partial profit near ₹646 if market sentiment weakens
For Education Purposes Only

EDUCATION: Why I’m Still in the GBPJPY TradeWhy I’m Still in the GBPJPY Trade—Even After Hitting the Target
Most traders hit a target and run. And honestly? That’s fine.
But this time, we’re doing something different.
Our GBPJPY trade—entered at 188.813 with a target at 195.170—just did what many doubted: it hit the target. That’s over 630 pips of calculated risk, patience, and pure follow-through. But instead of closing the position and patting ourselves on the back, we’re letting it run.
Here’s why:
1. Momentum Isn’t Slowing Down
Price action is bullish. Higher highs, clean structure, and no major signs of reversal yet. When the market is walking in your favor, don’t interrupt it just to feel “right.”
2. Smart Traders Let Their Winners Run
It’s not just a quote—it’s a survival skill in trading. Letting profits develop is how you avoid the trap of small wins and big losses. This trade is still showing strength, and we’re adapting with it.
3. The Higher Timeframe Story Still Has Room
On the daily and weekly charts, GBPJPY could still reach into extended zones. With fundamentals aligning and technicals confirming, why leave early?
A Quick Recap:
Entry: 188.813
Original Target: 195.170 ✅
Current Action: Letting it ride 🚀
Lessons from This Trade:
A plan should include the possibility of more than just your first target.
Exit strategy matters just as much as entry.
Emotional discipline separates reactive traders from real ones.
Would you stay in the trade or take the money and bounce? Let me know—because this is the part where traders split into two camps: the ones who close too early... and the ones who play the full game.
Watch the full trade update and analysis now on YouTube.

Solana - This just faked out literally everybody!Solana - CRYPTO:SOLUSD - just faked out literally everybody:
(click chart above to see the in depth analysis👆🏻)
Over the course of the past 25 days, Solana dropped a significant -30% and wiped out a ton of bulls before creating a complete reversal. Especially with the current horizontal support level, bulls are taking over again, offering us another major crypto trading opportunity.
Levels to watch: $120, $250
Keep your long term vision!
Philip (BasicTrading)
