CADCHF: Still Bullish 🇨🇦🇨🇭
Last week, I shared a very bullish outlook for CADCHF
based on a breakout and a retest of a key daily structure.
I keep holding a long trade on the pair and still expect growth.
Goal - 0.602
❤️Please, support my work with like, thank you!❤️
I am part of Trade Nation's Influencer program and receive a monthly fee for using their TradingView charts in my analysis.
Swingtrading

BAT ANALYSIS🚀#BAT Analysis :
🔮As we can see in the chart of #BAT that there is a formation of "Falling Wedge Pattern". In a daily timeframe #BAT broke out the pattern. Expecting a bullish move in few days if #BAT retest the levels
⚡️What to do ?
👀Keep an eye on #BAT price action. We can trade according to the chart and make some profits⚡️⚡️
#BAT #Cryptocurrency #TechnicalAnalysis #DYOR

BTC ANALYSIS (update)📊 #BTC Analysis : Update
✅As we said earlier, #BTC performed same. Around 22% bullish move done after the analysis. Now we can see that #BTC is trading around a mmajor resistance. We could expect around 10% bullish move if it sustain above its major resistance area
👀Current Price: $94,590
🚀 Target Price: $1,04,476
⚡️What to do ?
👀Keep an eye on #BTC price action and volume. We can trade according to the chart and make some profits⚡️⚡️
#BTC #Cryptocurrency #TechnicalAnalysis #DYOR

Xrp - Don't Underestimate The Bulls!Xrp ( CRYPTO:XRPUSD ) is bullish despite the recent drop:
Click chart above to see the detailed analysis👆🏻
Yes, we have been seeing a quite strong correction of about -50% on Xrp over the past couple of months. But no, this bullrun doesn't seem to be over yet but instead Xrp is creating a significant bullish break and retest formation. So if we get the bullish confirmation, we might see new highs.
Levels to watch: $1.8, $3.0
Keep your long term vision,
Philip (BasicTrading)

Chevron: The Chart’s Reaching a Critical PointChevron is starting to look very interesting again — but let’s be clear from the start: Chevron, like every oil giant, lives and dies by the price of oil. If oil rips higher or collapses due to global politics, supply shocks, or economic chaos, Chevron NYSE:CVX follows. No exceptions.
That said, what we’re seeing on the chart right now is increasingly pointing toward a deeper correction — specifically down to the $113–$100 zone. That would make sense structurally as a Wave 4 retracement.
But there’s a technical nuance here. Wave 1’s high sits at $103 — and depending on how strict your Elliott Wave rules are, Wave 4 dipping into Wave 1 is bad territory. Personally, I’m okay with a brief touch into that range, but I don’t want to see price hanging around below $103 for long.
From a trend perspective, we’re clearly in a downward channel. We just saw a textbook bull trap:
Chevron broke out with a solid +7% move over two weeks,
Followed immediately by a massive 22% drop,
One of the sharpest two-week declines since — yeah — March 2020, pandemic levels.
Now, price is hovering around $130, and the setup is simple:
If this level holds, great — maybe we’re bottoming.
If it breaks, I’m looking to buy between $113 and $100. That’s where the structure aligns, the volume kicks in, and risk/reward starts to make sense again.
So here’s the real question:
Do we see $200 first — or $100?
I’m leaning $100 first.
Not because I’m bearish long-term— but because that level would clean up the chart, shake out the noise, and give us a real shot at riding the next strong leg higher with conviction.
Would love to hear what you think — where’s your bet?

Tesla: At a Crossroads – Accumulation or Breakdown?One of the most talked-about stocks right now — Tesla NASDAQ:TSLA . And for good reason. Between the constant media buzz around Elon Musk and the recent surge in vandalism against Tesla vehicles, it’s been getting plenty of attention. But I’m not here to talk politics or headlines — I’m here for the chart.
And honestly? It’s looking better than you’d think. Despite all the noise, price has held steady in the $225 to $270 range, showing signs of a sideways accumulation phase — right at the Point of Control (POC) since 2021. That’s a pretty strong area, technically speaking.
Over the next few weeks, we’re likely to get clarity:
Either we break above $350, which opens up serious upside potential,
Or we break down toward the Volume Area Low — specifically the 2024 VAL at $161.18.
The real danger zone? Below $138. If price breaks that level, we have to assume that Wave 2 isn’t done yet — even though it was originally considered complete in 2023.
Until then, the structure actually looks constructive: we’ve been putting in higher lows and higher highs since 2023, which signals a potential uptrend.
How far that uptrend goes is hard to call. But if we break and hold above $325, then a pullback toward $300–$270 could offer a clean entry opportunity.
On the flip side, yes — if the market collapses and Wave II is still unfolding, we could be staring at $175, $125, or even as low as $75–$50 in an extreme scenario. And that would be wild for a stock that once touched $485.
But that’s why it’s crucial to zoom out. Ask yourself:
What do I want from Tesla — long-term conviction or short-term plays?
Then build your view. If the macro fits, dial into the lower time frames to find your edge. The setup is building — and it’s looking like Tesla is prepping for a big move.
Question is: which direction are you positioned for?

LONG APP / Swing tradingPrice just above SMA200d, previous relevant support.
Bullish wedge for a fast and explosive rally, possible short squezze.
Target: $270.

THETA at Rock Bottom? The Bounce Could Be LegendaryFor the past 136 days, THETA has been in a strong downtrend, shedding an incredible -82% from its high at $3.351. Recently, it tapped into a major support level at $0.617, interesting that it's like the golden ratio 0.618. And it bounced off it beautifully. Over the last few days, we’ve seen a notable surge in volume, hinting at potential accumulation. Could this be one of the best times to scale in? It might just be. An 82% discount is no joke.
🔑 Key Levels to Watch
The $1 level is the key psychological and technical resistance everyone’s eyeing. Longing from current levels to $1 offers a solid +40% gain, not bad at all. But let’s zoom out and get the bigger picture with some Fibonacci levels.
Using Fib retracement on the full 136-day move down:
0.236 Fib = $1.252 → Approx. +75% from current price
0.382 Fib = $1.653 → Roughly +135% gain
These are solid mid- to long-term upside targets if bullish momentum builds.
📈 Trade Setup & R:R
Invalidation: Current low at $0.600
Monthly Open: $0.804. Reclaiming and flipping this level into support would be a bullish sign.
Current Resistance: Around $0.71, where the anchored VWAP (yellow line) aligns with a yearly level. This needs to be broken and ideally retested as support.
We might also be seeing the early formation of an inverse head and shoulders pattern. While the “head” is still developing, if this setup plays out, the target sits at $1.5.
And here’s the kicker:
That $1.5 region lines up with multiple higher timeframe moving averages, adding significant weight to the level:
Monthly 21 EMA: $1.52
Monthly 21 SMA: $1.47
Weekly 21 SMA: $1.514
This confluence makes $1.47–$1.52 a major magnet for price and a likely take-profit or reaction zone if momentum continues.
👉 Feel free to use this indicator—just head over to my profile and under the Scripts section, add it to your favorites. Enjoy.
🎯 Risk to Reward Potential
These setups have excellent R:R potentials, ranging from 3:1 to over 60:1, depending on entry, stop-loss placement, and target selection. These are the kinds of high-probability setups that traders dream of. Clean structure, strong support, major upside, and clear invalidation.
If we see a breakout above $1 with strong volume, it could act as a catalyst for an even faster move toward higher Fib levels and MA targets.
Didn’t want to go too deep, but this lays out a clear roadmap with levels to monitor and possibilities to consider. The rest depends on how new data unfolds in the coming weeks. As always... plan your trade, manage your risk, and let the market come to you. Keep monitoring volume, structure, and key levels. The opportunities are here, now it's about execution.
____________________________________
If you found this helpful, leave a like and comment below! Got requests for the next technical analysis? Let me know.

Tesla - This Is Actually Not Gambling!Tesla ( NASDAQ:TSLA ) still looks quite bullish:
Click chart above to see the detailed analysis👆🏻
Just a couple of weeks ago I published a bunch of analysis, explaining all the reasons for a potential -40% drop on Tesla. However on the higher timeframe, Tesla still looks quite strong and with the bullish break and retest playing out so far, we could even see new all time highs soon.
Levels to watch: $260, $400
Keep your long term vision,
Philip (BasicTrading)

OFSS Weekly | Bullish Harmonic Reversal & RSI Breakout | Short-T📈 Swing Trade Recommendation (Short-Term):
Buy Zone: ₹8,600–₹8,750 (on dips or on strength)
Target 1: ₹9,300 (initial resistance and round number)
Target 2: ₹10,200–₹10,500 (next harmonic resistance zone)
Stoploss: ₹8,050 (below recent swing low)
🔍 Technical Highlights:
Bullish Harmonic Structure forming with strong reversal from "C" to "D".
Volume breakout supports the current leg of momentum.
RSI bullish divergence and breakout confirms potential trend reversal.
For Education purpose only

BANARISUG Weekly | Bullish Breakout from Retracement | Short-Ter📈 Swing Trade Recommendation (Short-Term):
Buy Zone: ₹4,000–₹4,030 (on dips or closing above ₹4,100)
Target 1: ₹4,400 (Fibo 0.786 level)
Target 2: ₹4,750–₹4,800 (swing high near 1.0 Fibo)
Stoploss: ₹3,825 (below 0.5 Fibo support zone)
🔍 Technical Highlights:
Volume surge confirms strong buying interest (see blue arrow).
RSI breakout suggests new momentum leg forming.
0.618 Fib level reclaimed after long consolidation → bullish bias.
for educational purposes only

Inverse Head-and-Shoulders FormingI see SPY, QQQ, & SMH forming inverse H&S pattern on the 4 hour chart. The Inverse Head and Shoulders pattern has a higher success rate than the regular Head and Shoulders pattern, with a success/failure ratio of 68.2% compared to 59% for the Head and Shoulders. In 98% of cases, the pattern exits upwards. Additionally, in 74% of cases, the price reaches the pattern's objective once the neckline is broken.

ASX 200 Rallies into Resistance ClusterIt can be useful to monitor several renditions of the same market, in order to identify higher probability support and resistance levels. And I would personally argue this becomes the more important if one trades CFDs exclusively.
Today I am comparing the ASX 200 cash market (XJO) and ASX 200 futures market (SPI 200, or AP1!) alongside the forem.com AUS200 CFD.
All three markets are approaching a key resistance cluster around 8,000. Neither the cash market nor futures market has broken above 8,000 yet and have several resistance levels (including a 61.8% Fibonacci ratio while the March low and December high) remain unbreached. Also note that futures volumes have been declining while prices rise, which shows a lack of bullish initiation (and also points to a short-covering rally).
Therefore, my bias is to fade into moves on the AUS200 should it breach its own 8,000, with the short bias becoming invalidated with a break above the 61.8% Fib level.
Matt Simpson, Market Analyst at City Index and Forex.com

Nvidia - The Chart Just Told Us So!Nvidia ( NASDAQ:NVDA ) might just still head a little lower:
Click chart above to see the detailed analysis👆🏻
After Nvidia perfectly retested the previous rising channel resistance just a couple of months ago, it was quite expected that we'll see a retracement. The overall trend however still remains bullish and if Nvidia drops a little more, the overall bullrun continuation rally might just follow.
Levels to watch: $80
Keep your long term vision,
Philip (BasicTrading)

AUDNZD: Bearish Trend Continuation 🇦🇺🇳🇿
AUDNZD violated a significant support cluster on a daily.
Because the pair is trading in a long-term bearish trend,
such a violation signifies a highly probable bearish continuation.
Next support - 1.06
❤️Please, support my work with like, thank you!❤️
I am part of Trade Nation's Influencer program and receive a monthly fee for using their TradingView charts in my analysis.

Ethereum Hits Support – Time to Load Up?🎢 The Great 112‑Day Drop
What happened? Over the past 112 days, ETH tumbled –66%, sliding from $4109 down to $1383 and oh yeah, it even poked its nose below the January 2018 all-time high. 7 years ago!
Support Zone: 0.786 + Volume Profile
0.786 Fib: $1,570.85 (drawn from the 2022 low $870.80 to that $4109 high).
5‑Year POC: $1565
Hold Tight: For 2 weeks, the 0.786 level has acted as support, bouncing price right back up.
Sell in May and go away? Rather buy in May and grab some gains on the way?
Trade Blueprint: Your Ethereum Game Plan
Entry Zone: $1570.85
Stop Loss: Below $1369.79
Profit Targets: $1800, $2000 ,$2500, $3000
Risk/Reward: Risk ≈13%, Reward ≈91%, a solid 7:1 R:R
DCA
Missed the perfect entry? No drama... dollar‑cost average between $1700 and $1500.
Keep an eye on the monthly open at $1822. Bulls need to break this resistance zone.
Bottom Line
Ethereum’s –66% dive has handed us a golden ticket at the 0.786 fib and 5‑year POC. This is one of those “buy the dip” moments.
________________________________
💬 Found this helpful? Drop a like and comment below. Want TA on another coin? Let me know and I’ll break it down for you.
Happy trading everyone! 💪

Bitcoin - This Is Just Unbelievable!Bitcoin ( CRYPTO:BTCUSD ) is not dropping at all:
Click chart above to see the detailed analysis👆🏻
After we have been seeing one of the craziest weekly drops which I have experienced in my entire trading history, all major cryptos and especially Bitcoin are strongly holding their levels. Since bullish strength continues quite often, I do expect new all time highs on Bitcoin soon.
Levels to watch: $70.000, $300.000
Keep your long term vision,
Philip (BasicTrading)

IO/USDT Weekly Trend Analysis and Reversal OpportunitiesThis analysis offers a detailed review of the IO/USDT weekly chart with a focus on identifying potential reversal zones that may provide attractive trading opportunities. The current market trend is bearish; however, two notable price levels—approximately 0.366 and 0.163—have been identified as potential support zones, suggesting a possibility for trend reversal.
Key observations: • Reversal Zones: These levels, clearly marked on the chart, could represent areas where buyers may step in and reverse the price decline. • Consolidation Areas: Horizontal areas of consolidation indicate periods where the price may pause before resuming its movement. • Current Price Dynamics: The asset is trading at 0.664, with a modest weekly increase of +1.68%, offering an intriguing counterpoint to the prevailing downtrend.
This organized analysis is intended to provide traders with clear, actionable insights for identifying potential entry points and refining their overall technical evaluation of IO/USDT.

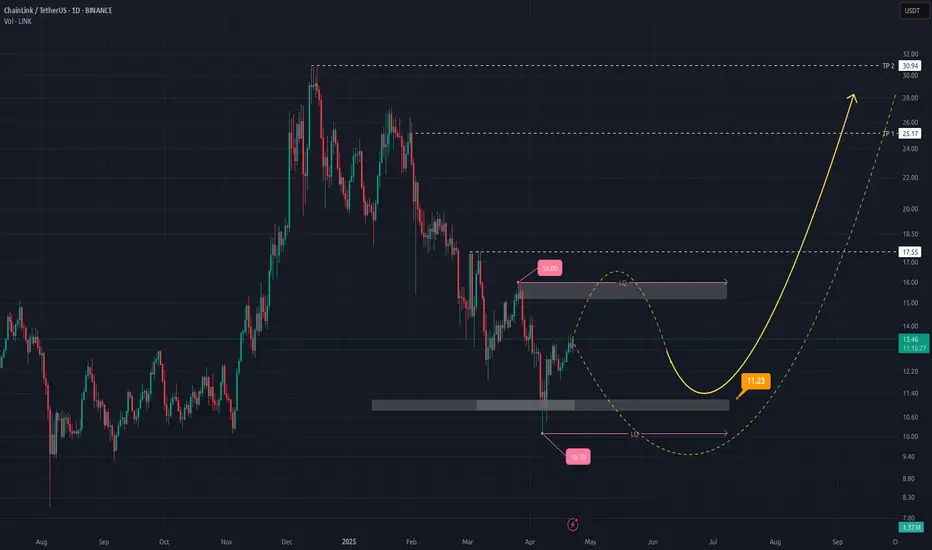
ChainLink (LINK/USD): A Bullish Breakout on the Horizon?Hey there, traders! Let’s take a closer look at ChainLink (LINK/USD) on the daily chart. There’s some interesting action that might point to a bullish move, but let’s break it down with a bit of caution to see if the stars are truly aligning.
Price Action
After a consistent downtrend, we’re seeing a potential shift at $11.23. There’s a bullish reversal candle showing up here, which could suggest buyers are stepping in at this key support level. It looks promising, but we’ll need more confirmation to be sure this is a real trend change.
Volume
The volume at this reversal point is picking up, which is a good sign—those bars are taller than the recent average. This might mean stronger buying interest, but it’s not a massive spike, so I’d keep an eye on whether this volume trend continues to support the move.
Pattern
Looking at the bigger picture, it seems like a cup-and-handle pattern could be forming. The price has rounded out (the “cup”) and is now consolidating (the “handle”). If LINK can break above the $16.00 resistance, we might see a bullish breakout—but this pattern isn’t fully confirmed yet, so let’s stay alert.
Potential Targets
If we do get that breakout, here’s what we might aim for:
TP1: $24.17 – A possible first target.
TP2: $30.04 – Could happen if momentum builds.
TP3: $32.00 – A stretch goal, but only if the bulls really take charge.
Key Support
The $11.23 support is our critical level to watch. If the price drops below this, the bullish setup could be in trouble, so let’s not get too ahead of ourselves.
Wrap-Up
We’ve got a reversal candle, some increased volume, and what might be a cup-and-handle pattern forming, so LINK could be setting up for a bullish move. But it’s not a done deal yet—breaking above $16.00 will be the real test. If you’re thinking of jumping in, set a stop-loss below $11.23 and manage your risk carefully. What do you think—could this be the start of something big? Let’s watch and see! Happy trading! 🚀
COTI WAVE 3 is coming COTI has completed its initial phases, Wave 1, 2 of Elliot waves and is preparing for Wave 3📈.
Also COTI V2, released recently, aims to revolutionize web3 privacy.
COTI’s market capitalization is $96 million, suggesting substantial potential gains during the upcoming bull market🚀.
This information is not financial advice. Conduct thorough research before making investment decisions.

New Setup: ATROATRO : I have a swing trade setup signal. I'm looking to ENTER long if the stock can manage to cross above the last candle high. If triggered, I will then place a STOP below the previous candle, and a price TARGET at around 21.80. **Note: This setups will remain valid until the stock CLOSES BELOW my STOP.

S&P500 - The Correction Is Over Now!S&P500 ( TVC:SPX ) is retesting massive support:
Click chart above to see the detailed analysis👆🏻
Over the past couple of days, we have been seeing a quite harsh stock market "crash" with an overall correction of about -20%. However, as we are speaking the S&P500 is already retesting a major confluence of support and if we see bullish confirmation, this drop might be over soon.
Levels to watch: $4.900
Keep your long term vision,
Philip (BasicTrading)

$3.90 to $18.00 Swing Pick in 1 Day $SBEVNews hit and stock into 300% gain in just 1 trading day after purchase on Thursday end of day. It doesn't even give you a chance for exit at planned target but much higher
