Swingtradingsignals
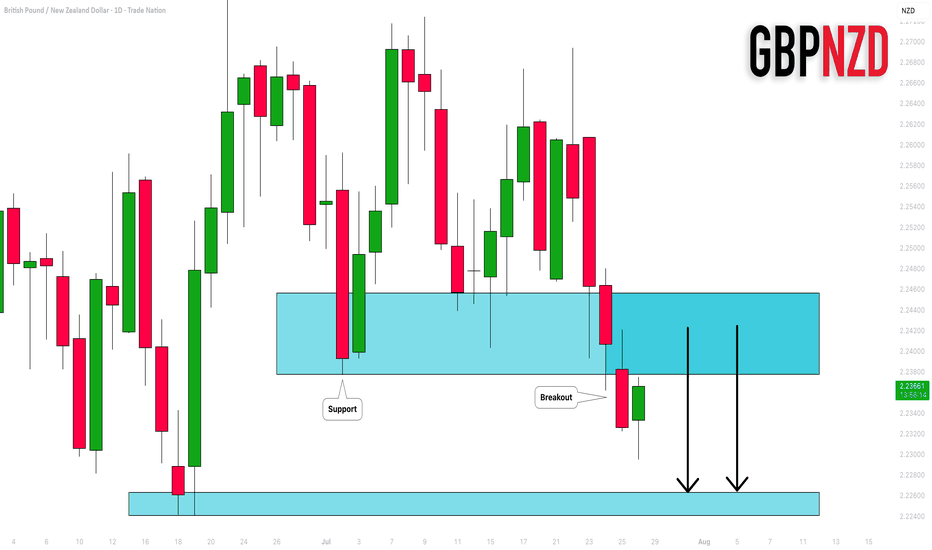
GBPNZD: Important Breakout 🇬🇧🇳🇿
GBPNZD broke and closed below a significant support cluster on a daily.
The broken structure turned into a strong resistance.
I will expect a bearish move from that.
Next support - 2.2264
❤️Please, support my work with like, thank you!❤️
I am part of Trade Nation's Influencer program and receive a monthly fee for using their TradingView charts in my analysis.
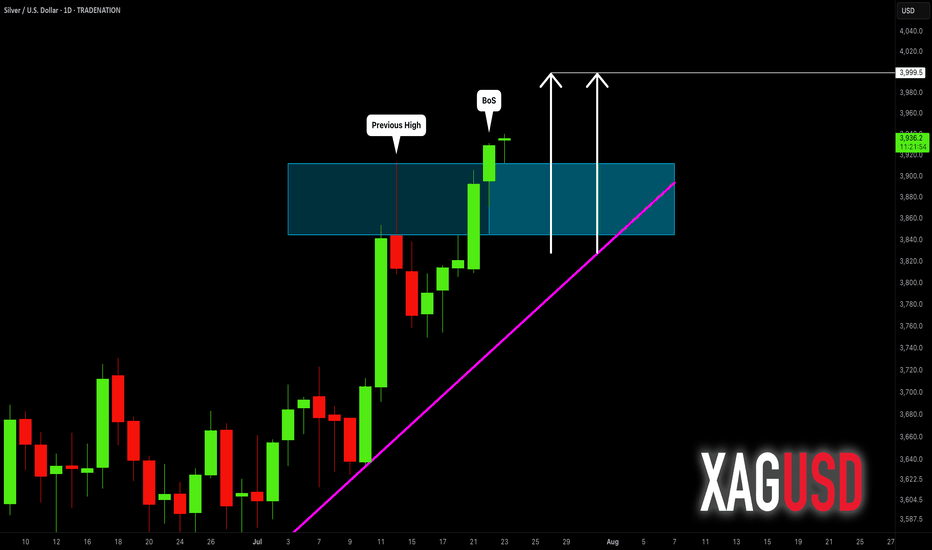
SILVER (XAGUSD): Confirmed Break of Structure
Silver updated a year's high yesterday, breaking a strong daily resistance.
With a confirmed Break of Structure BoS, we can expect that
the market will rise even more.
The next strong resistance is 40.
It is a round number based psychological level.
It can be the next goal for the buyers.
❤️Please, support my work with like, thank you!❤️
I am part of Trade Nation's Influencer program and receive a monthly fee for using their TradingView charts in my analysis
EURGBP: Strong Bullish Confirmation 🇪🇺🇬🇧
EURGBP is going to continue rising in an uptrend
that the pair established at the end of May.
A completion of a consolidation and a formation of a new local Higher High
indicate a highly probable bullish continuation soon.
Next resistance - 0.8605
❤️Please, support my work with like, thank you!❤️
I am part of Trade Nation's Influencer program and receive a monthly fee for using their TradingView charts in my analysis.
GBPJPY: Important New High 🇬🇧🇯🇵
GBPJPY set a new higher high higher close on a daily,
violating a key horizontal resistance cluster.
I think that it opens a potential for more growth.
Next strong resistance is 195.15
❤️Please, support my work with like, thank you!❤️
I am part of Trade Nation's Influencer program and receive a monthly fee for using their TradingView charts in my analysis.
AUDCHF: Completed Consolidation 🇦🇺🇨🇭
AUDCHF completed a consolidation within a horizontal range
on a daily, breaking and closing above its resistance.
I believe that the pair may rise more and reach a historically
significant falling trend line.
Goal - 0.5386
❤️Please, support my work with like, thank you!❤️
I am part of Trade Nation's Influencer program and receive a monthly fee for using their TradingView charts in my analysis.
USDCHF: Important Breakout 🇺🇸🇨🇭
USDCHF broke and closed below a neckline of a huge
head and shoulders pattern on a daily time frame.
It turned into a strong resistance cluster now.
I believe that the price will drop to that at least to 0.81 support.
❤️Please, support my work with like, thank you!❤️
I am part of Trade Nation's Influencer program and receive a monthly fee for using their TradingView charts in my analysis.
USDCAD: Will It Drop Lower? 🇺🇸🇨🇦
I successfully predicted a bearish move on USDCAD on Friday.
Because the trend is bearish, I think that the pair may drop
even below a current structure low.
Next strong support that I see is 1.3652.
It might be the next goal for the bears.
❤️Please, support my work with like, thank you!❤️
I am part of Trade Nation's Influencer program and receive a monthly fee for using their TradingView charts in my analysis.
GBPAUD: Bullish Bias Remains 🇬🇧🇦🇺
I already shared a confirmed bullish breakout of a falling trend line on a daily.
Though the price went a bit lower, below that after its retest,
we have a significant horizontal support cluster that strongly holds.
I think that the price may start rising from that and reach
2.1 level this week.
❤️Please, support my work with like, thank you!❤️
I am part of Trade Nation's Influencer program and receive a monthly fee for using their TradingView charts in my analysis.
USDCAD: Bearish Outlook For This Week Explained 🇺🇸🇨🇦
USDCAD will likely continue a bearish trend that the market
established in February.
A bearish breakout of a support line of a horizontal parallel
channel on a daily provides a strong confirmation.
Next goal - 1.3655
❤️Please, support my work with like, thank you!❤️
I am part of Trade Nation's Influencer program and receive a monthly fee for using their TradingView charts in my analysis.
EURCAD: Another Bearish Pattern 🇪🇺🇨🇦
Earlier, we spotted a head & shoulder pattern on EURCAD on a daily
and a confirmed breakout of its neckline.
Analysing a price action, I spotted another bearish formation today.
The price formed a bearish flag pattern, and it is retesting a broken
trend line at the moment.
I think that the pair may drop lower soon.
Next support - 1.5503
❤️Please, support my work with like, thank you!❤️
I am part of Trade Nation's Influencer program and receive a monthly fee for using their TradingView charts in my analysis.
GBPJPY: Important Breakout 🇬🇧🇯🇵
GBPJPY successfully violated and closed above a major
daily resistance cluster.
It opens a potential for more growth now.
Next resistance - 197.3
❤️Please, support my work with like, thank you!❤️
I am part of Trade Nation's Influencer program and receive a monthly fee for using their TradingView charts in my analysis.
TWT ANALYSIS🚀#TWT Analysis :
🔮As we can see in the chart of #TWT that there is a formation of "Falling Wedge Pattern". Some time ago the same structure was made and it performed well and this time also the same is happening with a perfect breakout
🔰Current Price: $0.8464
🎯 Target Price: $1.0865
⚡️What to do ?
👀Keep an eye on #TWT price action. We can trade according to the chart and make some profits⚡️⚡️
#TWT #Cryptocurrency #TechnicalAnalysis #DYOR
USDCAD: Important Breakout 🇺🇸🇨🇦
USDCAD broke and closed above a significant daily resistance cluster.
The broken structure turns into a solid demand zone now.
The next strong resistance is 1.3957.
It will most likely be the next goal for the buyers.
❤️Please, support my work with like, thank you!❤️
I am part of Trade Nation's Influencer program and receive a monthly fee for using their TradingView charts in my analysis.
GBPJPY: More Growth Ahead?! 🇬🇧🇯🇵
For some unknown reason, I received a lot of requests from
the members of my free channels to share my thoughts about GBPJPY.
Well, from a daily time frame perspective, the pair still looks bullish to me.
I do believe that the market has unrealized potential to go higher.
A bullish breakout of a neckline of a huge inverted head & shoulders pattern
was a very bullish event. It now turned into a strong support from where
I will look for buying.
The closest resistance is 191.95.
It will most likely be the next goal for the buyers.
❤️Please, support my work with like, thank you!❤️
I am part of Trade Nation's Influencer program and receive a monthly fee for using their TradingView charts in my analysis.
USDCHF: Important Breakout & Bullish Outlook Explained
USDCHF broke and closed above a key daily horizontal resistance area.
The broken structure most likely turned in a strong support.
I expect a bullish continuation from that next week.
Goal - 0.8356
❤️Please, support my work with like, thank you!❤️
I am part of Trade Nation's Influencer program and receive a monthly fee for using their TradingView charts in my analysis.
EURCHF: Important Breakout 🇪🇺🇨🇭
One more CHF pair that looks strongly bullish to me is EURCHF.
The market successfully broke and closed above a key daily horizontal resistance.
The next strong resistance is 0.948.
It will most likely be the next goal for the buyers.
❤️Please, support my work with like, thank you!❤️
I am part of Trade Nation's Influencer program and receive a monthly fee for using their TradingView charts in my analysis.
CADCHF: Bullish Continuation After Consolidation 🇨🇦🇨🇭
CADCHF was accumulating for more than a week within a horizontal
range on a daily time frame.
With a strong bullish movement, its resistance was violated yesterday.
The price may grow much more now.
The closest resistance - 0.608
❤️Please, support my work with like, thank you!❤️
I am part of Trade Nation's Influencer program and receive a monthly fee for using their TradingView charts in my analysis.
GBPJPY: Breakout & Bullish Continuation 🇬🇧🇯🇵
I see a confirmed breakout of a significant daily resistance on GBPJPY.
The price will most likely continue rising within a wedge pattern.
The next goal for the buyers is 197.0.
❤️Please, support my work with like, thank you!❤️
I am part of Trade Nation's Influencer program and receive a monthly fee for using their TradingView charts in my analysis.
AUDCAD: Important Zone Detected 🇦🇺🇨🇦
I see a test of a significant supply zone on AUDCAD.
It is based on a recently broken horizontal support cluster
and a rising trend line.
I believe that the selling orders will accumulate within that area.
Chances will be high that the price will drop from that at least to 0.898 support.
❤️Please, support my work with like, thank you!❤️
I am part of Trade Nation's Influencer program and receive a monthly fee for using their TradingView charts in my analysis.
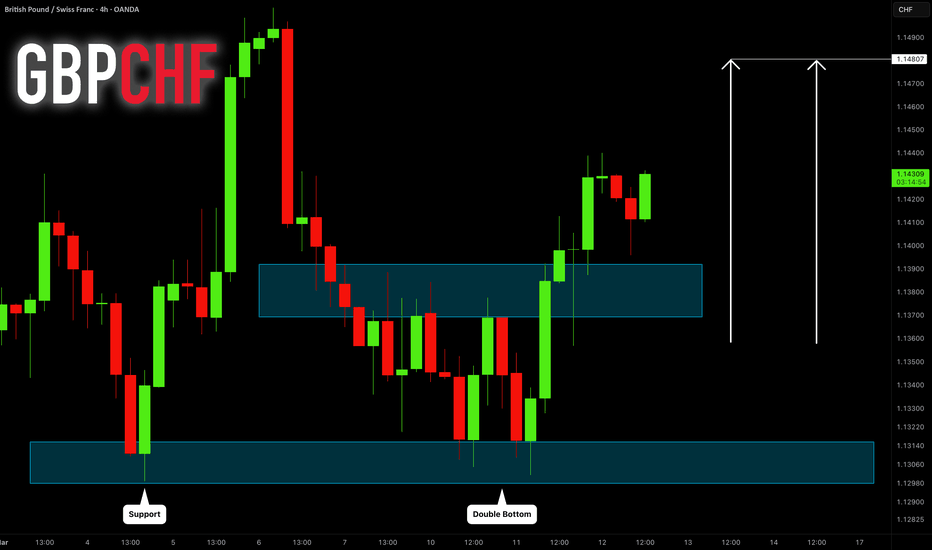
GBPCHF: Bullish Wave Continues 🇬🇧🇨🇭
As I predicted yesterday, GBPCHF went up from support.
I see one more bullish pattern today:
this time we have a confirmed breakout of a neckline of a double bottom.
The market is going to rise and reach 1.148 level soon.
❤️Please, support my work with like, thank you!❤️
AUDUSD: Bearish Outlook For Next Week Explained 🇦🇺🇺🇸
AUDUSD broke and closed below a significant daily horizontal support on Friday.
It feels like the pair is returning to a global bearish trend.
The market will most likely continue falling.
Next support - 0.61725
❤️Please, support my work with like, thank you!❤️


