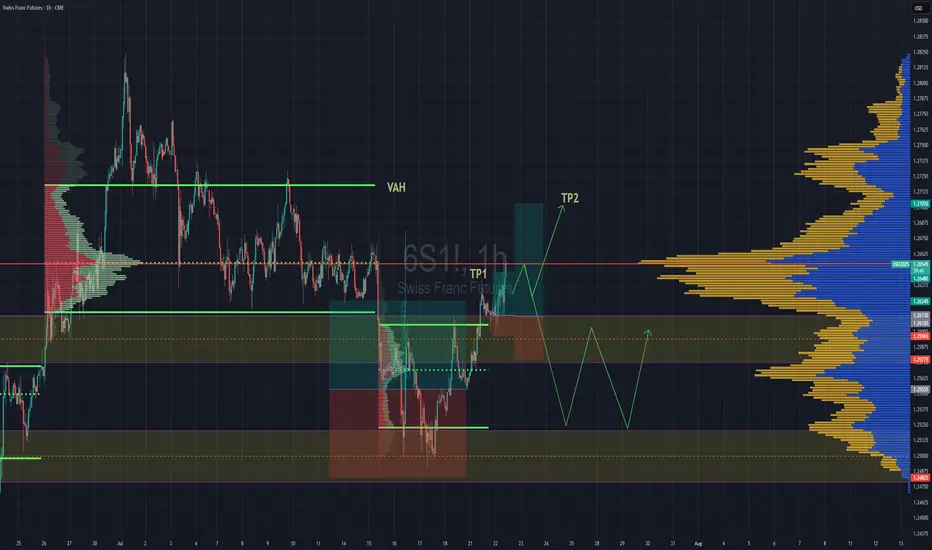
Swiss Gaining Momentum Against The DollarSwiss futures gaining strength against the dollar. We have broken back into previous rotation that was somewhat balanced, but still leaning towards a "b" style volume profile . If we are able to get above the POC, then we''ll go straight for TP2 close to Value are high.
If the POC is really strong and we reject hard from the POC then we might lose the value area and fall back down to previous value area to continue consolidation there until further notice.
Swissfranc
Bullish CHF/JPY Heist! Risk vs. Reward Setup💰 SWISS-YEN BANK HEIST! 🚨 CHF/JPY Bullish Raid Plan (Risk & Reward Setup)
🌟 Attention Market Pirates & Profit Raiders! 🌟
"The vault is unlocked—time to loot!"
🔎 THIEF TRADING ANALYSIS (CHF/JPY)
Entry (📈): "The Bullish Loot is LIVE!"
Buy limit orders within 15-30min pullbacks (recent swing lows/highs).
Aggressive? Enter anywhere—heist mode activated!
Stop Loss (🛑): Recent swing low (wick) – adjust based on your risk & lot size!
🎯 Target: 186.300 (High-risk Red Zone – Police Resistance!)
Overbought? Reversal risk? Bears lurking? Yes. But thieves play smart!
🏴☠️ SCALPERS & SWING RAIDERS:
Scalp ONLY Long (Use trailing SL to lock profits).
Low on ammo? Join swing traders for the big heist!
📡 FUNDAMENTAL BACKUP (Why This Heist?)
Bullish momentum in play (check COT, Macro, Sentiment).
News Alert (⚠️): Avoid new trades during high-impact news—trail your SL!
💥 BOOST THE HEIST!
Hit 👍 LIKE & 🔄 SHARE to strengthen our robbery squad!
More heists coming—stay tuned! 🚀
⚠️ DISCLAIMER:
Not financial advice. Risk = Reward. Adjust SL/targets based on your strategy. Market conditions change—adapt or get caught!

CHF is the new gold? Safe-haven flows keep pressure on USDCHFBank of America argues that the Swiss franc has reasserted itself as the true safe-haven hedge.
BofA says the trend of the CHF being used more like gold, and a hedge against problems like rising US debt, could continue. Unlike the yen, which has lost much of its appeal as a pure haven.
Technically, recent candles might indicate buyers are attempting to build a base, but there’s no decisive reversal yet.
Should price fail to reclaim the 0.8030–0.8050 region soon, the broader bearish structure could resume - possibly testing fresh lows. Meanwhile, rallies in USD/CHF may face pressure as the franc’s macro backdrop continues to attract inflows.

USD/CHF SWISSY Forex Heist Plan | Thief-Style Buy Setup🔥💰 "Forex Bank Heist: Thief Trading Blueprint for USD/CHF SWISSY 💵💸" 💣🚨
"Steal Pips, Not Dreams. Trade Like a Robber, Think Like a Mastermind." 🕶️💼
🌟 Hello World! Bonjour! Ola! Hallo! Marhaba! 🌟
Welcome, all Money Makers, Market Hustlers & Chart Robbers 🕵️♂️🤑🚁
Let’s gear up for our latest USD/CHF "Swissy" Forex Bank Heist, crafted using our high-level Thief Trading Style—a bold fusion of technical know-how, street-smart price action, and strategic risk maneuvers.
💎 HEIST PLAN SUMMARY
This trade is locked, loaded, and ready to target the vault using a Bullish Breakout / Pullback strategy.
We are eyeing the SWISSY with laser focus, watching closely for price action to retest key support zones, then blast through resistance to secure our escape route.
Let’s not get caught in the police trap zone (aka overbought resistance with fakeouts and bearish ambushes). Keep those trailing stops tight and your loot tighter. 🏃♂️💨
🎯 ENTRY STRATEGY — “The Vault is Open!” 📈
💰 Buy Limit Orders near recent swing low or pullback zone (15M–30M timeframe).
💣 Use DCA (Dollar-Cost Averaging) or Layered Entry strategy to spread risk and improve entry points.
🏹 Entry range: Monitor consolidation for the perfect dip-snatch setup.
🛑 STOP LOSS — “Fallback Safe House” 🚨
📍 Place SL just below recent swing low using 2H timeframe (e.g., 0.79200).
💡 Adjust based on position size, number of entries, and personal risk.
🏴☠️ TARGET ZONE — “The Getaway” 🎯
🎯 TP Level: 0.80700
🚁 Or escape early if momentum weakens—profit is profit.
💹 Scalpers: Ride only the bullish getaway car. Use Trailing SLs to ride and protect gains.
📊 MARKET STATUS — "SWISSY Watchtower" 🕵️
The market is currently neutral, but pressure is building. Expect a bullish breakout if macro & technicals align.
💡 Smart Robbers read the full blueprint:
→ Macro Outlook
→ COT Reports
→ Sentiment Analysis
→ Intermarket Trends
→ Seasonality & Institutional Flow
📰 TRADING ALERT — “Dodge the Sirens” 🚓
🚨 Avoid opening new trades during high-impact news events
💼 Use Trailing Stop-Loss to lock in profits
🧠 Plan your risk and exit BEFORE the bullets (candles) start flying
❤️ BOOST THE CREW! 💥
If this plan helps you pull clean profits, show love and Boost the chart 🔥📈
Your support fuels more strategies and keeps the crew funded 💼💵
Stay sharp, stay ruthless, and always trade like a Thief in the Charts 🎩🕶️
📌 Disclaimer
This strategy is educational and should not be considered investment advice.
Always trade based on your own analysis, risk profile, and market research.
🗓️ Stay tuned for the next Forex Heist Blueprint — we rob charts, not wallets.
📡 Tap follow. Boost the crew. Profit like a pro.

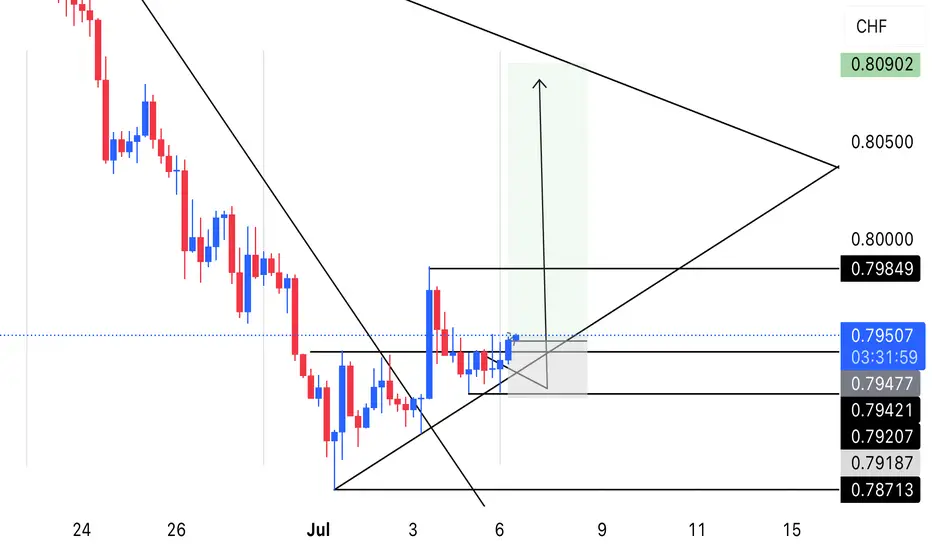
USDCHF LONG READY!usdchf printed a good bullish signal for potential long setup I posted earlier. Full analysis details in related ideas below.
July 7 - 11th: Sell The RIPs, Buy The DIPs! (PART 2)Welcome back to the Weekly Forex Forecast!
This is Part 2 of the FOREX futures outlook for the week of July 7 - 11th.
In this video, we will analyze the following FX markets:
CHF and JPY
Last Friday was a bank holiday, so the price action is discounted. This Monday has no red folders on the calendar, so the environment is set for a day of misdirection. Be careful to take only trades that confirm your directional bias!
USD is still weak, and analyst have determined the FED will put off cutting rates until September. Tariffs wars may start up again July 9th. And Trumps Bill can add 3+ trillion to the debt.
None of this supports the USD!
Look to buy the dips xxx USD, and look to sell the rips vs USD xxx.
Enjoy!
May profits be upon you.
Leave any questions or comments in the comment section.
I appreciate any feedback from my viewers!
Like and/or subscribe if you want more accurate analysis.
Thank you so much!
Disclaimer:
I do not provide personal investment advice and I am not a qualified licensed investment advisor.
All information found here, including any ideas, opinions, views, predictions, forecasts, commentaries, suggestions, expressed or implied herein, are for informational, entertainment or educational purposes only and should not be construed as personal investment advice. While the information provided is believed to be accurate, it may include errors or inaccuracies.
I will not and cannot be held liable for any actions you take as a result of anything you read here.
Conduct your own due diligence, or consult a licensed financial advisor or broker before making any and all investment decisions. Any investments, trades, speculations, or decisions made on the basis of any information found on this channel, expressed or implied herein, are committed at your own risk, financial or otherwise.

USD/CHF Slips LowerUSD/CHF Slips Lower
USD/CHF declined and now struggling below the 0.8000 resistance.
Important Takeaways for USD/CHF Analysis Today
- USD/CHF declined below the 0.8000 and 0.7950 support levels.
- There is a key bearish trend line forming with resistance near 0.7920 on the hourly chart at FXOpen.
USD/CHF Technical Analysis
On the hourly chart of USD/CHF at FXOpen, the pair started a fresh decline from well above the 0.8080 zone. The US Dollar dropped below the 0.8000 support to move into a negative zone against the Swiss Franc.
The bears pushed the pair below the 50-hour simple moving average and 0.7940. Finally, the bulls appeared near the 0.7870 level. A low was formed near 0.7872 and the pair is now consolidating losses.
There was a minor increase above the 23.6% Fib retracement level of the downward move from the 0.8080 swing high to the 0.7872 low. On the upside, the pair could face resistance near the 0.7920 level. There is also a key bearish trend line forming with resistance near 0.7920.
The next major resistance is near the 0.7940 level, above which the pair could test the 0.7975 level. It is close to the 50% Fib retracement level of the downward move from the 0.8080 swing high to the 0.7872 low.
If there is a clear break above the 0.7975 resistance zone, the pair could start another increase. In the stated case, it could even surpass 0.8030.
On the downside, immediate support on the USD/CHF chart is 0.7870. The first major support is near the 0.7850 level. The next major support is near 0.7800. Any more losses may possibly open the doors for a move toward the 0.7720 level in the coming days.
This article represents the opinion of the Companies operating under the FXOpen brand only. It is not to be construed as an offer, solicitation, or recommendation with respect to products and services provided by the Companies operating under the FXOpen brand, nor is it to be considered financial advice.

FOREX USD/CHF🥇 CHF The Silent Assassin
While the world screamed about inflation, recession, and banana peels on the geopolitical stage, the Swiss Franc just stood there sipping Rivella and quietly murdered the competition.
+14.10% vs EUR?
+19.34% vs USD?
CHF walked into the forex party, didn’t say anything, and left with everyone’s respect.
🥈 USD – The Gym Bro on a Sugar Crash
Big muscles, loud talk, but oh no, look at those gains over time:
-4.41% vs EUR
-19.34% vs CHF
The USD resembles the guy who used to bench 250 and still talks about it while eating Doritos.
Rate hikes gave it a short-lived boost, but now it's just aired—trillions in debt and a lack of direction.
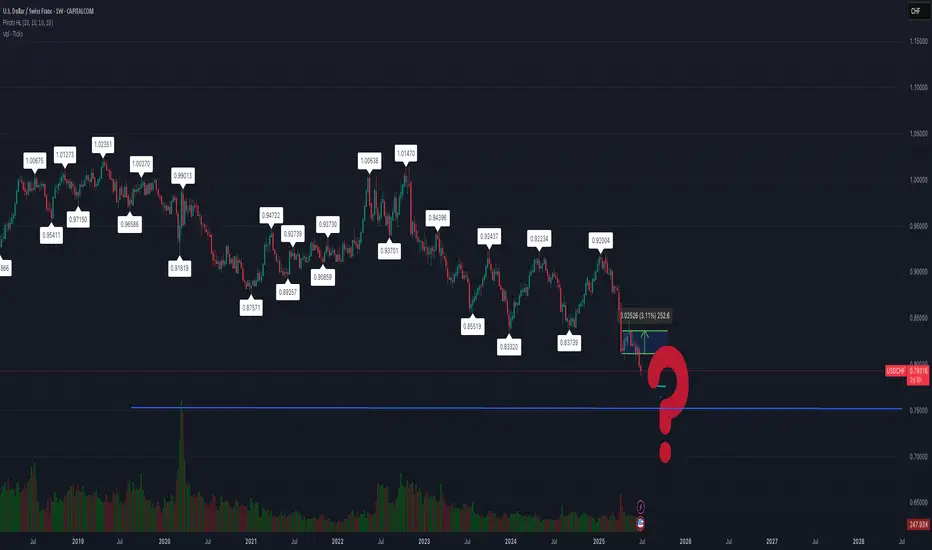
USD/CHF Exchange Rate Falls to Multi-Year LowUSD/CHF Exchange Rate Falls to Multi-Year Low
According to the chart, the USD/CHF exchange rate has settled below the key psychological level of 0.8000. The rate hasn’t been this low since the financial crisis of 2008.
On one hand, the drop in USD/CHF is driven by weakness in the US dollar. The US dollar index has fallen to its lowest level in over three years, largely due to the conflicting trade policies pursued by the Trump administration. On the other hand, geopolitical instability has increased the appeal of the Swiss franc as a so-called safe-haven asset.
Technical Analysis of the USD/CHF Chart
Since mid-May, price fluctuations have formed a downward channel (marked in red), and by the end of June the rate had stabilised around the psychological threshold of 0.8000 (indicated by an arrow) — right at the median of the channel.
However, this balance between supply and demand proved temporary, tipping in favour of sellers. As a result, we now see a decline in USD/CHF along a steep trajectory (marked in black), potentially targeting the lower boundary of the red channel — which suggests a possible move down to 0.7800 USD per franc. Along this path, support may come from the 1.618 Fibonacci extension level (0.7875); note how the 0.8055 level previously acted as support (marked with a blue arrow).
The RSI indicator confirms strong selling pressure — but will the bearish trend continue?
Much will depend on the broader fundamental context. As reported by the Wall Street Journal, the sharp strengthening of the franc against the dollar is causing growing concern at the Swiss National Bank (SNB), as an overly strong franc harms Swiss exporters. This suggests that the current market sentiment could shift dramatically if the SNB issues any relevant statements.
This article represents the opinion of the Companies operating under the FXOpen brand only. It is not to be construed as an offer, solicitation, or recommendation with respect to products and services provided by the Companies operating under the FXOpen brand, nor is it to be considered financial advice.

NZD/CHF Heist Blueprint: Snag the Kiwi vs. Franc Profits!Ultimate NZD/CHF Heist Plan: Snag the Kiwi vs. Franc Loot! 🚀💰
🌍 Greetings, Wealth Raiders! Hola! Ciao! Bonjour! 🌟
Fellow money chasers and market bandits, 🤑💸 let’s dive into the NZD/CHF "Kiwi vs. Franc" Forex heist with our 🔥Thief Trading Style🔥, blending sharp technicals and solid fundamentals. Follow the charted strategy for a long entry, aiming to cash out near the high-risk ATR zone. Watch out for overbought signals, consolidation, or a trend reversal trap where bearish robbers lurk. 🏴☠️💪 Seize your profits and treat yourself—you’ve earned it! 🎉
Entry 📈
The vault’s open wide! 🏦 Grab the bullish loot at the current price—the heist is live! For precision, set Buy Limit orders on a 15 or 30-minute timeframe, targeting a retest of the nearest high or low.
Stop Loss 🛑
📍 Place your Thief SL at the recent swing low on a 4H timeframe for day trades.
📍 Adjust SL based on your risk tolerance, lot size, and number of orders.
Target 🎯
Aim for 0.50400 or slip out early to secure your loot! 💰
Scalpers, Listen Up! 👀
Stick to long-side scalps. Got big capital? Jump in now! Smaller stacks? Join swing traders for the robbery. Use a trailing SL to lock in your gains. 🧲💵
NZD/CHF Market Intel 📊
The Kiwi vs. Franc is riding a bullish wave, fueled by key drivers. Dig into the fundamentals, macro trends, COT reports, sentiment, intermarket analysis, and future targets for the full scoop. 🔗👇
⚠️ Trading Alert: News & Position Safety 📰
News drops can shake the market! To protect your loot:
Skip new trades during news releases.
Use trailing stops to secure profits and limit losses. 🚫
Join the Heist! 💥
Support our robbery plan—hit the Boost Button! 🚀 Let’s stack cash with ease using the Thief Trading Style. 💪🤝 Stay sharp for the next heist plan, bandits! 🤑🐱👤🎉

CHFJPY: Massive bullish breakout taking place.CHFJPY is highly overbought on its 1D technical outlook (RSI = 77.325, MACD = 1.496, ADX = 39.317), having crossed above its 1 year High (R1), staging a bullish breakout much like April 28th 2023. This is a direct outcome of the 1D Golden Cross, following also 1 year of accumulation. A 1W closing over the R1 validates a bullish extension to the 2.0 Fibonacci (TP = 194.000).
See how our prior idea has worked out:
## If you like our free content follow our profile to get more daily ideas. ##
## Comments and likes are greatly appreciated. ##

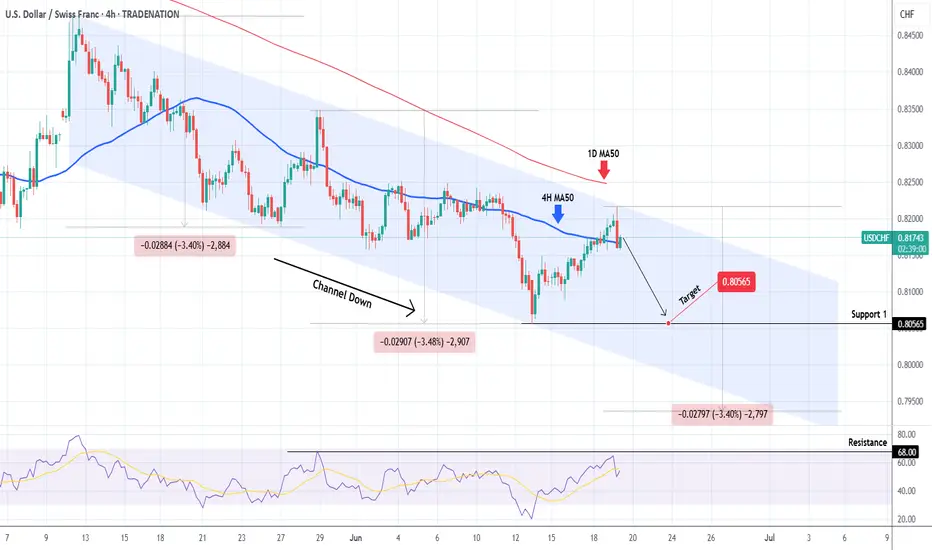
USDCHF Channel Down reached its top. Sell signal.The USDCHF pair has been trading within a Channel Down pattern since the May 12 High and today the price hit its top again. Trading above its 4H MA50 (blue trend-line) but still below the 1D MA50 (red trend-line), that maintains the medium-term bearish trend.
This is a strong bearish signal as it technically indicates that the new Bearish Leg is about to start. Support 1 at 0.80565 is a low risk Target. The previous 2 Bearish Legs have both gone for -3.40% declines, so technically the downside can be extended beyond Support 1.
-------------------------------------------------------------------------------
** Please LIKE 👍, FOLLOW ✅, SHARE 🙌 and COMMENT ✍ if you enjoy this idea! Also share your ideas and charts in the comments section below! This is best way to keep it relevant, support us, keep the content here free and allow the idea to reach as many people as possible. **
-------------------------------------------------------------------------------
Disclosure: I am part of Trade Nation's Influencer program and receive a monthly fee for using their TradingView charts in my analysis.
💸💸💸💸💸💸
👇 👇 👇 👇 👇 👇
CHFJPY - Warm up in ScalpingSo, with this beautiful structure,
We can just scalp! Our Scalp Position:
Entry: 176.168
TP: 175.251
SL: 177.083
Ratio 1.00
Good Luck!

EURCHF Bullish break-out signal above the 1W MA50.The EURCHF pair has rebounded on its 1.5-year Support Zone. A break above its 1W MA50 (blue trend-line) is a bullish break-out signal that would target Resistance 1 at 0.96650. That is where it can potentially make contact with the 1W MA200 (orange trend-line) for the first time since March 01 2021.
-------------------------------------------------------------------------------
** Please LIKE 👍, FOLLOW ✅, SHARE 🙌 and COMMENT ✍ if you enjoy this idea! Also share your ideas and charts in the comments section below! This is best way to keep it relevant, support us, keep the content here free and allow the idea to reach as many people as possible. **
-------------------------------------------------------------------------------
💸💸💸💸💸💸
👇 👇 👇 👇 👇 👇

EURCHF: Fierce consolidation prompts to a bullish breakoutEURCHF is neutral on its 1D technical outlook (RSI = 52.253, MACD = 0.000, ADX = 26.091) as it has been consolidating since the April 25th high. Since then it has failed to close a 1D candle above the 1D MA200. Given the strong presence of the S1 Zone, if we get that closing above the 1D MA200, we will turn bullish, aiming for the 0.618 Fibonacci retracement level (TP = 0.94900), like the March 14th high did.
## If you like our free content follow our profile to get more daily ideas. ##
## Comments and likes are greatly appreciated. ##

CHFJPY - BULLISH MOVE !Hello Traders !
The CHFJPY price formed a descending triangle pattern.
At the moment, The resistance line is broken !
So, I expect a bullish move🚀
________________
TARGET: 176.145🎯

CHFJPY - NEW BREAKDOWN !Hello Traders !
The CHJPY failed to create a new higher high.
Currently, The higher low is broken (change of character).
So, I expect a bearish move📉
________________
TARGET: 173.280🎯

USD/CHF Head and Shoulders Breakdown in FocusUSD/CHF has carved out a head and shoulders top on the daily chart, setting up a potential move lower. If this bearish pattern plays out, the downside target sits around 0.7895. But keep an eye on the April low (0.8040) and the 0.80 handle — both could act as support if price keeps falling.
Matt Simpson, Market Analyst at City Index and Forex.com

Weekly FOREX Forecast Jun 2 - 6th: CHF & JPY FuturesThis is the FOREX futures outlook for the week of Jun 2 - 6th.
In this video, we will analyze the following FX markets:
CHF JPY
It's been a consolidative week, but the USD is still weak. Look for valid breakdowns of consolidations before buying against the USD.
NFP week ahead! Mon-Wed will be the best days to trade.
Enjoy!
May profits be upon you.
Leave any questions or comments in the comment section.
I appreciate any feedback from my viewers!
Like and/or subscribe if you want more accurate analysis.
Thank you so much!
Disclaimer:
I do not provide personal investment advice and I am not a qualified licensed investment advisor.
All information found here, including any ideas, opinions, views, predictions, forecasts, commentaries, suggestions, expressed or implied herein, are for informational, entertainment or educational purposes only and should not be construed as personal investment advice. While the information provided is believed to be accurate, it may include errors or inaccuracies.
I will not and cannot be held liable for any actions you take as a result of anything you read here.
Conduct your own due diligence, or consult a licensed financial advisor or broker before making any and all investment decisions. Any investments, trades, speculations, or decisions made on the basis of any information found on this channel, expressed or implied herein, are committed at your own risk, financial or otherwise.

USDCHF: Weekly analysisThe 0.8191 zone a little tricky! Any breaks over it could active the long trade only if it perfectly breaks over the trend line.
The indicated levels are determined based on the most reaction points and the assumption of approximately equal distance between the zones.
Some of these points can also be confirmed by the mathematical intervals of Murray.
You can enter with/without confirmation. IF you want to take confirmation you can use LTF analysis, Spike move confirmation, Trend Strength confrimation and ETC.
SL could be placed below the zone or regarding the LTF swings.
TP is the next zone or the nearest moving S&R, which are median and borders of the drawn channels.
*******************************************************************
Role of different zones:
GREEN: Just long trades allowed on them.
RED: Just Short trades allowed on them.
BLUE: both long and short trades allowed on them.
WHITE: No trades allowed on them! just use them as TP points

SWISS FRANC INDEX-SXYOn the monthly chart, the Swiss Franc index, SXY is pushing higher to mitigate a supply zone. The price rally caused an aggressive bearish move across all CHF pairs. Presently, we are in a period of minor correction. The slide is expected to continue, thereafter we will look to trade the bullish correction once we have a shift in order flow and market structure.

CHFJPY - BEARISH MOVEHello Traders !
On Tuesday 13 May, The CHFJPY reached a strong resistance level (176.482 - 176.010).
The price broke the higher low (change of character).
So, I expect a bearish move📉
________________
TARGET: 173.280🎯

CHFZAR - Swiss Franc / S A Rand (Daily chart, OANDA) - LongCHFZAR - Swiss Franc / South African Rand (Daily chart, OANDA) - Long Position; Mid-term research idea.
Risk assessment: Medium {Volatility risk}
Risk/Reward ratio ~ 5
Current Market Price (CMP) ~ 21.81000
Entry limit ~ 21.65000 on May 12, 2025
Target limit ~ 22.65000 (+4.62%)
Stop order limit ~ 21.45000 (-0.92%)
Disclaimer: Investments in securities markets are subject to market risks. All information presented in this group is strictly for reference and personal study purposes only and is not a recommendation and/or a solicitation to act upon under any interpretation of the letter.
LEGEND:
{curly brackets} = observations
= important updates
(parentheses) = information
~ tilde/approximation = variable value
-hyphen = fixed value
