$CHF - It's brewing!$CHF - It's brewing!
I adore trades like this, it's brewing and waiting for break out!
TJ
Swissie

USDCHF is reaching for parity againThe USDCHF can be relatively slow-moving compared to other major forex pairs. However, we have seen some significant moves since March this year. In fact, the most recent April monthly candle was the largest bodied candle in almost seven years. Albeit April’s candle moved in the USD’s favour rather than the francs. In April, The USDCHF opened at 0.922 and closed at 0.973.
As of writing, the USD is again approaching parity with the Swiss franc, trading at 0.998. Last month, the pair was rejected at 1.001 and closed lower on the month (0.959). This movement occurred after inflation in Switzerland rose faster than expected and landed further outside the Swiss Central Bank’s (SNB) target of 0-2% per annum. With inflation in Switzerland at a 14-year high of 2.9%, the Swiss Central Bank’s rhetoric concerning interest rate hikes has ramped up. But, Switzerland still has the lowest interest rate in the world (-0.75%), and the SNB’s rhetoric has been mild and equivocal, especially compared to the US Federal Reserve. Thus the USDCHF has forced its way into parity territory in June.
A monthly time-frame analysis indicates that the pair may be able to sustain a push through this zone of resistance at parity for June and beyond.
The Coppock Curve indicator, found on the graph above, helps gauge long-term trends. When we see the Coppock Curve move above zero, it is to be interpreted as a continuing uptrend. It is not typically used on the smaller time frames because it doesn’t show accurate divergence signals.
The Coppock Curve is just below 10 on the monthly time frame, which is the highest it has been since January 2015. After which, the curve plummeted. Those familiar with forex history may know of the SMB’s decision that day. After that event, the Coppock Curve still indicated rising prices with this pair, which ultimately came true for almost the next two years.

AUDCHF 'Short' Trade IdeaThe AUDCHF currency pair recently rejected the 0.70766 daily horizontal resistance level (according to the bearish harami candlestick pattern below the level), thereby presenting a 'sell' opportunity.
A reward-to-risk ratio of 4.97 is possible as follows:
Entry Price: 0.70437.
Stop Price: 0.70806 (36.9 PIPS).
Target Price: 0.68603 (183.4 PIPS).

GBPCHF Trade IdeaThere's a "buy" opportunity as recently shown by the bullish harami candlestick pattern on the 1.21017 daily horizontal support level which signals a fakeout. Your stop could be at the 1.20512 price level and target at 1.23077 to give a 3.08 reward-to-risk ratio.

USD/CHF possible short position (1:6.3)Always remember to manage your risk.
Note: DXY has rejected nicely from supply zone according to the our prediction, and it could be another confirmation for this trade.

Swissy got me DizzyUp or Down I don't really know.
Personally I think up.
But technically looks like H&S.
We must wait and see.

Symmetrical Triangle on USD/CHF @ W1A symmetrical triangle pattern has formed on the weekly chart of the USD/CHF currency pair. This long-term formation offers an opportunity to go short in case of a bearish breakout. The triangle's borders are marked with the yellow lines. The potential entry level is shown with the cyan line. The potential take-profit level is where the green line is. The stop-loss can be set to the opposite border begins at the base of the triangle - at 0.95947.

Bearish Franc?The strength of the dollar may wreck the franc. I think it might correct heavily against both the dollar and the yen. While this was not as per my expectations, it seems like price action has its own plan. What interesting times we live in.

USDCHF Short Scalp Opportunity Hey if you can get a price at the top of this candle look for a short. Could turn into a daily short here. Stay tuned.

USDCHF Short Scalp Opportunity Day TradeHey its a few hours late on this one but if you can get a price around 0.92630-40 area you might get a nice short opportunity here for a day trade.

USD/CHF Signal - USD Initial Jobless Claims - 18 Nov 2021USD/CHF is trending to the upside prior to the USD Initial Jobless Claims data, which measures the number of people applying for unemployment benefits for the first time. Technically the pair is holding 50 moving average and structure support, and we're looking for continued upside into the 0.9350 level.

USD/CHF Signal - USD NY Empire State Manufacturing - 15 Nov 2021USD/CHF has traded to structure support prior to the USD NY Empire State Manufacturing data, which gauges business conditions for New York manufacturers. Generally speaking, a positive result indicates bullish for US Dollar, while a negative result shows poor growth of US Dollar. Technically the pair traded above the moving average ribbon, which is now dynamic support in a bullish cross. We anticipate continued upside into the 0.92700 level.

USD/CHF To Fall Like A Bag Of BricksPrice has made a bounce from trendline support, however has moved back to the downside from moving average resistances. If price is able to break below the support trendline we may see a continued push below the 0.900 level.
We anticipate that this trendline support will break, as long term the USDCHF is in a bearish structure and has been correcting for a prolonged period.

USD/CHF Signal - USD 3 Month Bill Auction - 1 Nov 2021USDCHF has traded into the fibonacci golden pocket resistance zone prior to the USD 3 Month Bill auction, which reveals the yields on the US Government backed security. Technically the pair is trading in the fibo golden pocket, and the RSI has recently given an overextened signal. We are also seeing bearish divergence form on the USDCHF 1h RSI, another bearish indicator.

USD/CHF Signal - USD Continuing Jobless Claims - 14 Oct 2021USDCHF is trending to the downside proir to the USD Continuing Jobless claims, which measure the number of people applying for jobless claims on an ongoing basis. Technically the pair has broken the ascending trendline and we are anticipating downside into the 161.8% fibo extension.

USDCHF Downside !Price has formed a head and shoulders pattern, and has retested the neckline as resistance. The RSI has broken below the 50% level, and we anticipate a bearish move to continue.
On the 1H chart price is clearly cycling to the downside, and we are looking for the -61.8% fibo to be hit. Recent highs are our violation level.

USD/CHF Signal - 11 Oct 2021USDCHF has broken the ascending trendline and is now correcting in a bearish structure. We have formed a double top pattern and are looking for downside to continue into the significant figure of 0.9200. The RSI is bearish and the ADX is increasing, showing that the downtrend is gathering momentum.

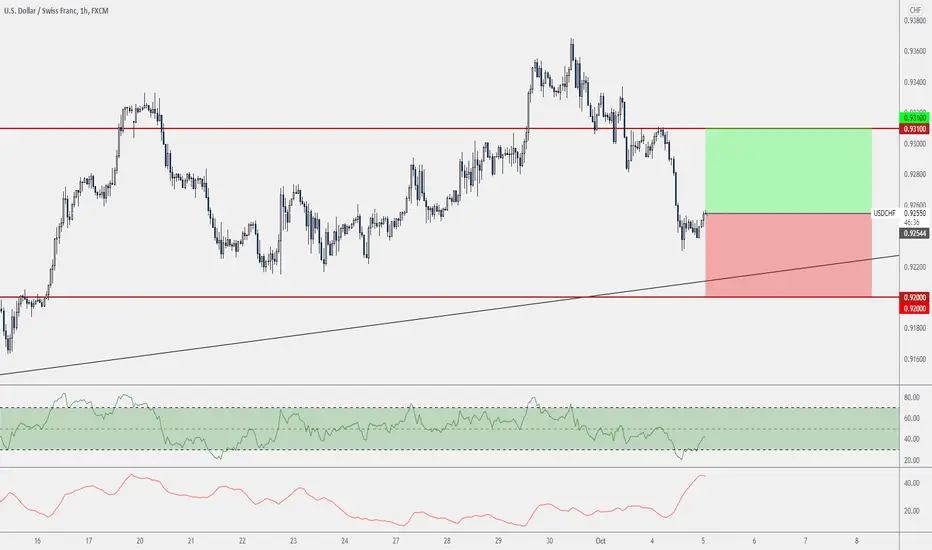
USD/CHF Signal - USD Redbook Index - 5 Oct 2021USDCHF has bounced at support prior to the USD Redbook Index data, which is a sales weighted retail index that measures 9000+ stores. Technically the pair is holding above the daily trendline and we anticipate the midterm bull market to continue.
USD/CHF Signal - USD Personal Income - 1 Oct 2021USDCHF is trading to the downside today prior to the USD personal income data which measures the total income for US citizens. Technically the pair has broken support and we anticipate continued downside into the next key support zone.

USD/CHF Signal - USD Fed Rate Decision - 22 Sep 2021USDCHF has traded into support prior to the US Fed Rate decision, which decides the rates in the USA. Technically the pair is at 61.8% fibo support and previous structure, and we anticipate a bounce from this level back into recent highs at the 0.9330 level. The RSI has given an overextended signal, and the bullish structure remains intact.

USD/CHF Signal - USD Redbook Index - 21 Sep 2021USDCHF is trending to the upside prior to the USD Redbook Index data, which is a sales weighted measurement of over 9000+ retail stores. Technically the pair has pulled back into structure and fibonacci support at the 0.382% level and we anticipate a bounce from here into recent highs.

USD/CHF Signal - 13 Sep 2021USDCHF has traded into resistance today. Technically the pair has struggled to break to the upside of its current range, and we anticipate a move back into support.

USD/CHF Signal - USD 4 Week Bill Auction - 2 Sep 2021USDCHF is trending to the upside today prior to the USD 4 week bill auction data, which reveals the yield on the US Government backed security. Technically the pair is pushing to the upside, and the RSI is indicating potential bullish action.
