SXP


SXP/BTCThis looks like accumulation cylinder on SXP , look at the massive volumes.
currently sitting on support , as long as it holds i expect a bounce & pump hard

SXP USD - Next Support at 2.56BTC's retest of the broken trendline failed. Unfortunately for the bulls this is bearish imo.
We are into support but expecting further downside on SXP
B, HF

SXP Drago Dance ;)This is my favourite pattern
I call it sleeping dragon, soon will wake up and will surprise you,,,
If you like my ideas , please support me with LIKE and comments and visit my channel


Swipe should turn up - SXP chartI see this structure for Swipe SXP and I believe it was still correcting and completing the 4th larger wave. The RSI bullish divergence is very convincing. If thats the case we will turn up more bullish from here with a more impulsive 5th wave. This is in line with a missing smaller 5th wave for BTC as well, and that the market will turn now again bullish. The previous ath fits perfectly to the 0.618 of the w3 extension.

$ftm sxp and kava looks really good waiting for a confirmationThe Ftm sxp and kava coin compression is getting over slowly. It is breaking out in the usdt pair as well. I have marked the target. Let's see how it goes.
thank you
Crypto by Ksquare

SXP/USDT-A cup with a handle or a potential head and shoulders?Hello everyone, analyzed the SXP/USDT pair
In addition, I attach the SXP chart in a pair to the dollar to the recent forecast, which was paired with BTC
It is worth noting that the open interest in this coin is very high, this can be seen both in the volume and in the news background
It makes sense to look at it in the medium term.
Here, too, a huge pattern is almost formed for the continuation of the uptrend " Cup & Handle"
Now there is a final stage of formation in the form of the final element "Handle", the philosophy of this action is to accumulate positions, that is, accumulation, before entering the " price liberty zone"
The green block on the chart 3.26-2.8$ is the buyer's block, the red block on the chart 5-4.32$ is the seller's block and the final resistance.
The chart also shows hypothetical options for further price movement, the meaning of which is the same in the end, just with a different structure of the final accumulation.
Why I do this analysis, and point to a possible "head and shoulders" pattern, is because many traders see the "cup and handle" formation.
Expectations of a breakout of the level or a payoff from the green block are seen by everyone, so be careful and open a position only when you see a confirmation for yourself, in a particular position.
Trade wisely, do not overestimate the risks in trading.
Trade with your trading system, do not overestimate the lot in the position and do not overestimate the risk management.
Join our free, open community - share your thoughts, schedules, and knowledge with everyone. There are no VIP channels, no premium groups, no annoying ads. Free society and free crypto trading.
LINK IN BIO

BTC PAIR LOOKS EQUALLY BULLISHif USDT pair looks bullish, in BTC looks even more bullish, having reclaim that key support, plenty of distance from the highs that will push the usd value even higher imo. I see no resistance till 16k sats area, just more confluence for my USDT pair position.

SXP takeoff?Looks strong on btc pair
can see that usd pair has flipped the HTF levels, flipped the resistance
hold above here should give a decent run

SXP - BUY - SXPUSDT Long 1HAlert :
Disclaimer
Trading currencies (or any other financial market) involves substantial risk, and there is always the potential for loss. Your trading results may vary. No representation is being made that any associated advice or training will guarantee profits, or not result in losses from trading.
BARAKAT BARAYE HAME

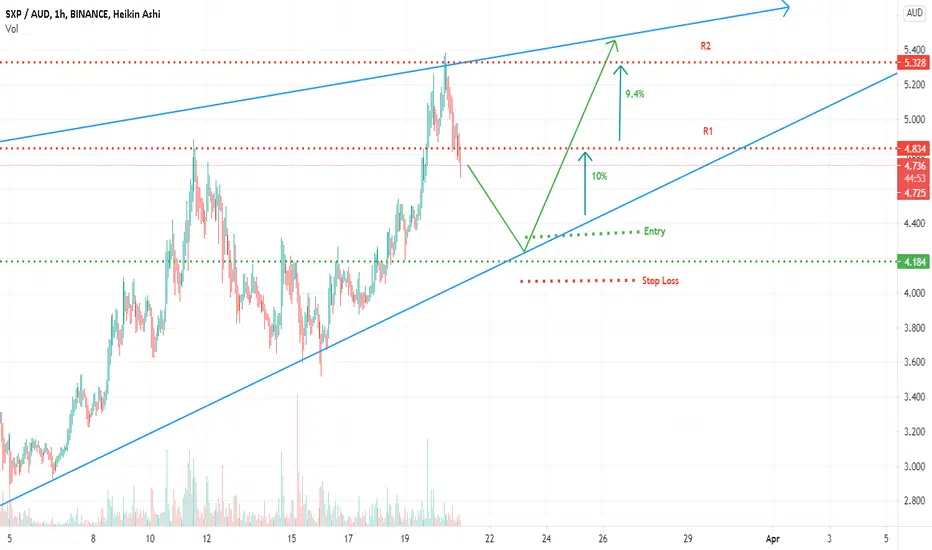
SXP AUD heading towards its Support lineOn an hourly chart, SXP shows an upward trend. It has already touched its Resistance point at 5.3 and now moving down. Mostly it will come down to its usual support level close to 4.18. If it does, then my entry will be close to 4.3 with stop loss at 4.083.
At its first Resistance level look for a profit of 10% and if breaks R1, then get ready to bank additional 9.4%. Overall potential profit range is 10 - 19%. Expecting it to come closer to its support line in 1-2 days.
Note: These are my personal notes and in no way financial advice. Do your own research before trading
🎯SXP UPDATE- CZ's Secret Weapon Hiding in Plan Sight??🚀So turns out binance partnering with Swipe (by buying them out essentially) but keeping them a separate entity did have a long term play.
SXP looks to be shaping up as a serious competitor in the DEX space, with backing from Binance.
I expect this to continue this insane v-shaped recovery it's seen since my last buy signals
And likely get close to the $10 mark before we see some pull back.

[SXP] is on track to track the FIB - it was on trackis on track to track the FIB - it was on track - supported by the standard handle cup model

sxp analizimdirgereksiz süslemelere gerek yok teknik ve temel analize baktım herkesin anlayabilecegi dilde sadeleştirdim SXP yön yukarı


$SXP wants new ATH this weekend and explore price discovery mode#SXP looks lit here! A huge cup and handle pattern is ready to send the price to $5 and higher!
The volumes on $SXP are running insane. Let's see where this leads to but expect it to break its 4$ resistance now, An eventual breakthrough this resistance may take this all the way to $6-8$ & beyond.
$SXP wants a new ATH this weekend and explores price discovery territory. Squared up with exclamation markChart with upwards trend

SXP Buy tradeSxp trying to reach previous high point. once it reaches, it wont stop there. cup and handle pattern shows the mid term target.
First target: 3.6
Second target: 4.15
Third target: 4.75
Final short term target: 5.499

SXP/USDT 1hr - Confirmed Cup/Handle - Breakout IdeaSXP has broken out of the confirmed Cup and Handle idea - looking to enter at retest, always the safest entry. SXP has had a lot of news lately and more coming at end of the month.
Set your alerts and DYOR.
Cheers
