SXP


SXP/BTC - Cup and HandleLove the look of SXPBTC and SXPSUDT here. Cup and handle chart pattern on both pairs, coupled with some strong fundamental news coming out.
The longer the accumulation, the bigger the pump. Excited to see where this one goes.
Good luck!
Hit the LIKE button if you find my analysis valuable and want to support my channel. Follow to make sure you don't miss any future trade ideas.

SXP 12h Where will the price move next: by $5 or by 1.30I n the previous idea, we warned or even wrote directly that it was time to take profits for longs.
Literally after that, the price of SXPUSDT dropped from $3.70 to $1.70 in a few days, which is a hard -50%
Now the SXPUSD price has again approached the $3.60-4 zone
Again, you need to closely monitor the price behavior.
A 1-2 day consolidation above the $3.60 level will give a chance for an impulse up to $5 per SXP
However, if we see false breakouts of the level on the chart again, like last time, then the price of SXPUSDT will first go down to $3.00-3.10
And below this level, a way will open for a fall to $1.3
_____________________
Since 2016, we have been analyzing and trading the cryptocurrency market.
We transform our knowledge, trading moods and experience into ideas. Each "like under the idea" boosts the level of our happiness by 0.05%. If we help you to be calmer and richer - help us to be happier :)

SXP about to explodeSXP just made an iH&S as well as a higher low and got the EMA50 supporting as a result of breaking a long-time resistance. A potential %100 pump in pair with bitcoin is expected


Elliott wave 15 minute looks like a corrective wave, futures up!Even with futures up, this so far looks like a 3 wave structure on 1H chart.

SXP Short-TermHello,
SXP/USDT looks like it bounced from re-test support.
Next target is $3,53.
Enjoy

SXP BUY / SELL ZONES 1 HOURSXP BUY / SELL ZONES 1 HOUR
Forget #DOGE #DOGECOIN Try #SXP add us to your like / watch list
We hope you find our charts of use, please hit the like button if you found this chart useful.
Safe trading everyone
Check today's analysis below⠀

SXP/USDT TRIANGLEHi guys
so i see a triangle for sxp/usdt on binance chart witch i think it needs more confirmations to be sure of it
but its enought for me to belive if btc dont make it fail
ass you see the ressistance and suppurt lines are in the chart and
just be careful the most important thing is to save your money not to make profit
wish you the best
bb

SXP/BTC - ascending TRIANGLE ( UPTREND ?)Hello everyone, analyzed the SXP/BTC pair
an ascending triangle is visible on the trading chart. Possibly - not excluded - this is an expanding rising wedge.
To understand this and take the correct position, you need to wait for the breakdown of one of the levels (red line) - support
Or resistance and support levels - if a flat range is formed.
View position, only after confirmation + Volume
RSI indicator - Looks very bullish.
Go to my free channel and chat with other traders. Link in the description
"This is just my opinion, trade with your trading system
Have a nice day and come back again."
Write your opinion, whether there is a place to buy here, and open a long position


SXPUSDT broken trendline and tested!! It is moon time for SXP to get on the flight. But should look at the moves BTC it is not sure that we are going up it can go around 47,5 so trade according to it.


$SXP/BTC 4h (Binance Spot) Trendline BreakoutSwipe at Support and about to Breakout of the Downward Trend Line
Current Price= 0.00004657
Buy Entry= 0.00004389 - 0.00004570
Take Profit= 0.00005342 | 0.00005914 | 0.00006887
Stop Loss= 0.00004122
Risk/Reward= 1:2.12 | 1:3.58 | 1:6.07
Expected Profit= +18.37% | +31.04% | +52.61%
Possible Loss= -8.66%
Estimated Gain-time= 1 month
use Maximum 10 % of the Account

SXP/BTC Mid term analysis Swipe Swap will be launching soon and I believe that this one will be huge like venus. Hold it and the result will be very big.

SXPDOWN - Bear Run IdeaThis is my first graph. Obviously done not inappropriate way but the idea is that during the bear run, all these Down's tokens will gain value.
DOWN Token is a representation of - Bear Market.
UP Token is a representation of - Bull Market.
If we look at the UP's Tokens, we'll see that these tokens had a value between 0.31$ and 2$, during the bull run, these tokens increased all the way to 500$. Meanwhile, DOWN's tokens from 15 - 18$ dropped all the way down to almost near 0$. Some of Down token costs 0.07 - 0.008 and others just about 0.000004$.
I think, that during the bear market these Down's tokens will gain their value, and we should see UP's tokens decrease since a 1% change in the underlying asset is about a 3% change in DOWN or UP token.
However, here matter two important aspects:
1. BTC condition:
1.1 When BTC drops or starts correcting itself, all ALTCOINS will decrease as well, meaning that all DOWNS tokens are gaining value. (100 probability).
1.2 When BTC starts to grow/smashing new ATH, then all ALTCOINS also starts to decrease in their value and almost all DOWNS tokens are gaining their value (100 probability).
1.3 When BTC stops growing, stays in the new zone which is near the new ATH then either Altcoins drops or increases (50 / 50 probability).
2. Overall market condition - if it's a bull market - there will be a lot of difficulties to gain profit when there is a bear market - then it should be dead easy.
P.S This is not trading advice, do your own research before investing!!!

SXPUSDTLooks like an interesting coin for now.
It does have the potential to see new highs... I might get into it myself,
but before that, we have to wait and see if it can breakout that resistance (as shown on chart).
After the breakout was confirmed above the resistance, its good to go!
⚠️ NOTE: This usually happens when a coin gets hot on crypto platforms: it might go down by a little and then get back up to a new high.
Good Luck 🎲
Tell me your ideas. Like and Share 🗣✅
Comment if you need a chart 💬

SXP on the RunGood entry level incase someone missed. Binance Project. Uniswap Mcap 8 Billion. Swipe Mcap 200 M. Huge potential 40X from here.


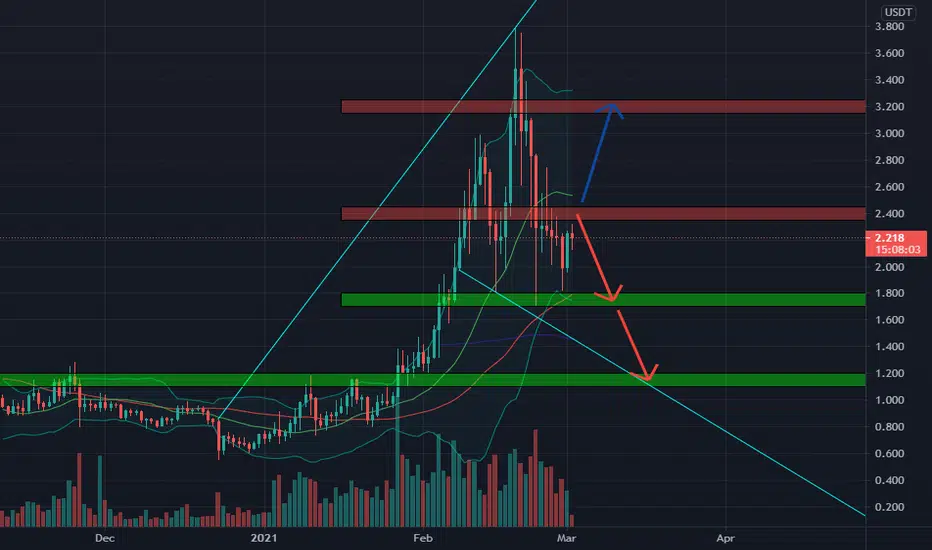
🆓Swipe/USDT Analysis (2/3) #SXP $SXPThe selling force is still strong and dominated, so we should follow the downtrend by selling SXP at 2.4$ zone for the targets at 1.8$ and 1.2$
Only if SXP conquers 2.4$ zone, we will expect a recovery to 3.2$ zone
📅NEWS
👉Apr 30 : V2 Wallet App
👉Jun 30 : Burn & Stealth Releases
👉Jun 30 : DeFi Integrations
👉Dec 31 : Swipe Financial
📈BUY
-Buy: 1.7-1.8$. SL if B
-Buy: 1.1-1.2$. SL if B
📉SELL
-Sell: 2.35-2.45$. SL if A
♻️BACK-UP
-Buy: 2.35-2.45$ if A. SL if B
-Sell: 3.15-3.25$. SL if A
❓Details
Condition A : "If 1D candle closes ABOVE this zone"
Condition B : "If 1D candle closes BELOW this zone"