SXP final pumpI think we should see the final pump where the big players sell. I think 20%+ movement is possible
SXP

Riding the Upward Trend with CautionSXP, a cryptocurrency currently trading at $0.8500, seems to be on the rise. The Relative Strength Index (RSI) is at a comfortable 64, indicating a slightly overbought state but with the potential for further gains.
The Fibonacci retracement levels show that SXP is currently in an upward trend, having surpassed the 0.5 Fibonacci level. The 4-hour timeframe upper Bollinger band sits at 0.9345, while the lower Bollinger band is at 0.5335, with the current price of SXP falling within these limits. This suggests that SXP is currently experiencing a period of relatively low volatility, which can be a good thing for investors.
The Moving Average Convergence Divergence (MACD) indicator is currently at 0.0895, indicating a bullish phase for SXP. However, the stochastic oscillator is at 73.71, suggesting that the cryptocurrency is currently overbought and may potentially experience a price correction soon.
SXP rallied 223% after announcing a partnership with Chainlink. This announcement could potentially increase demand for SXP, resulting in a price increase.
In conclusion, based on the technical analysis and recent news, SXP appears to be in an upward trend with the potential for further gains. However, given the current overbought state and potential price correction indicated by the stochastic oscillator, it may be advisable to exercise caution while investing in SXP at its current price level. Overall, it seems like an exciting time for SXP and investors should keep an eye on its price movements.

SXPUSDT 1$ ?To be honest, there is no resistance for SXP up to $1. Maybe it will go up and down a little in the middle of the road, but the target is 1 dollar


SXP : TARGET VIEWSXP is still on the range since the start of the march
We will follow if SXP can gain the important target of $1.77 in the coming time.

Swipe (SXP) to Solar (SXP) = explosive price growthAnnounced on 28.03.2023 the Swipe (SXP) Mainnet Swap & Rebranding Plan to Solar (SXP) finally managed to interest buyers and the SXPUSDT price began to grow rapidly.
Now is the time for SXP arbitrageurs, because you can catch a price difference between exchanges of 7-8%
For example, at the time of writing, the price of SXP on WhiteBIT is $0.75, and on Binance is $0.81
Earnings - done, trading turnover is growing rapidly, and demand is pushing the price up.
When can this hype come to an end?
We assume that in the price zone of $1.10-2.10, you should at least be careful with your purchases.
After all, in this price zone, increased sales of SXP from the "happy owners" of this token, who bought it at this price 2 years ago, may begin)
In the meantime, you can and should make money on cryptocurrency speculation)
_____________________
Did you like our analysis? Leave a comment, like, and follow to get more

Bitcoin Detailed Expalnation Like Beginner GuideBitcoin Short Overview:
As of 3rd April 2023, the current price of Bitcoin against USDT is $28,380. On 17th March 2023, the price entered the $26,592 zone and has been trading within this X-Zone for the last 17 days. The top zone of this channel is $29,185.
It is important to note that the price needs to break out of the X-zone for the next big move. The X-Zone channel support is at $26,592, and the resistance is at $29,186. The trend line support is at $27,700. These parameters should be taken into consideration before entering any trade.
In my opinion, we can see a price of $29,000 today if the price tests the X-Zone channel resistance again. However, it is crucial to keep in mind that if the price fails to break and gets rejected at $29,186, there is a high probability that it will hit $26,592 and $23,887. Therefore, it is essential to set stop-loss accordingly.
A breakout upwards means that Bitcoin is ready for $35,000.
This is a brief explanation about BTC/USDT price analysis. If you find this information helpful, please like, share and appreciate. For more upcoming quality updates, please follow me.
Thank you.

Should rise above 0.5810...Hello?
Traders, welcome.
If you "Follow", you can always get new information quickly.
Please also click "Boost".
Have a good day.
-------------------------------------
(SXPBTC 1W chart)
The key is whether the price can sustain the rise above 0.0000 3071 to 0.0000 4386.
Trading in the BTC market is not easy.
Therefore, what you need to check on the BTC market chart is the strength of this coin (token) against BTC.
Whether the BTC price rises or falls, if the BTC market chart of this coin (token) is showing an upward trend, it can be interpreted that as many people want to buy this coin (token).
This is because the price of the stablecoin market chart (USDT, BUSD, USDC) will fluctuate according to these movements.
However, it is not necessary to look at all coins (tokens) because the BTC market chart or USDT market chart moves almost the same for coins (tokens) with a low market cap.
Therefore, there is no need to check the BTC market chart for SXP coins.
-------------------------------------------
(SXPUSDT chart)
As it rises above 0.4110, it appears to be trying to break away from the bottom.
However, in order to completely break out of the bottom, the price needs to rise above 0.5810 to maintain the price.
why? Did the price rise...
why? Could the price have gone down...
It may be natural to want to know this.
However, volatility happens and knowing why doesn't help you in trading.
On the contrary, as you learn the reason, your subjective thoughts will become stronger, and the possibility of making an erroneous transaction will only increase.
So, when you see a chart where prices have surged or fallen like this, it's good to see how the next wave forms.
It is not a good idea to create a trading strategy after volatility has occurred.
-------------------------------------------------- -------------------------------------------
** All descriptions are for reference only and do not guarantee profit or loss in investment.
** Even if you know other people's know-how, it takes a considerable period of time to make it your own.
** This is a chart created with my know-how.
---------------------------------

✴️ Swipe Higher Highs, 5-Steps Pattern, Bullish ConfirmationThere is a 5-Steps pattern that we looked at together last week, if you follow me daily, you understand and this works as confirmation, bullish confirmation.
#1, A low hit December 2022.
#2, A bullish breakout in January 2023.
#3, A correction that ends mid-March.
#4, Resumption of the initial bullish move.
#5, New high.
This is the first pair that already hits a new high and completes the 5-Step pattern.
All the other charts that I showed you with this pattern will do the exact same thing.
High volume and current price action confirms what I've been sharing with you.
We can only enjoy the ride up, nothing more.
Check my latest Bitcoin article, there will be a medium sized bull-run and go for longer than expected ('Related Ideas' below).
Thank you for reading.
Thank you for your trust.
Thanks a lot for your amazing and continued support.
Namaste.

✳️ Swipe Grows 125% In 3 Days And... Double ConfirmationWhat to expect from the other Altcoins vs Bitcoin pairs?
Have a look at Swipe (SXPBTC), this one went ahead.
Today this pair hit its highest level since August 2022, growing by125% and recovering more than 5 months of correction in less than a week, honestly... Patience is key.
I guess technical analysis does work, if you know where or what to look for.
Now, the confirmation only happens if Bitcoin really enters a correction and the ALTSBTC will continue to grow... Looking at the evidence so far, I would say you are safe if you followed my calls.
Namaste.

SXP Bulls in Town!Alright, let's dive into the world of SXP!
Currently priced at $0.4800, SXP is showing some promising signs in the 4-hour timeframe. The Relative Strength Index (RSI) is at a relatively high 76, indicating an overbought condition. However, don't let that scare you away just yet, because the volume oscillator is at a bullish +6.74%. That's right, the bulls are in town!
Looking at the Fibonacci retracement levels, we have 0.3048, 0.2769, and 0.2490. Keep an eye out for a potential correction toward the 0.3048 level before considering a long position. But wait, there's more! The Moving Average Convergence Divergence (MACD) is showing a bullish trend with a reading of 0.0595, and the Stochastic oscillators are at 65.5, indicating that the current uptrend may continue.
Now, let's talk about those Bollinger bands. On the 4-hour timeframe, the upper band is at 0.5389, the lower band is at 0.1560, and the middle band is at 0.3474. If SXP manages to break out above the upper band, that could be a strong signal for a continuation of the current uptrend.
Last but not least, we have the Hourly Exponential Moving Average (EMA) of 50, which is currently at 0.3249. This indicator can help us identify potential support levels, so keep it in mind when considering your entry and exit points.
Overall, the technical analysis is looking pretty bullish for SXP. While the RSI is indicating an overbought condition, the volume oscillator, MACD, and Stochastic oscillators are all pointing towards a continuation of the current uptrend. Keep an eye out for a potential correction towards the 0.3048 Fibonacci level, and watch for a breakout above the upper Bollinger band as a potential entry signal. Good luck!

SXP COIN NEXT EXPECTED MOVE
•SXP Coin almost pump upto 137% under this week.
• I did not see any strong news or update behind this pump.
• Fundamentaly weak project.
• If you buy it few days ago then book profite.
• in comming days possible we see its price again at 0.40$.
• Strong resistance 0.60$.
if you are looking for open position in short then don't use upto 2% fund
follow me for more update about crypto

Sxp getting ready for Massive Breakout seems Like Sxp Has already Bottomed Out
Formed descending Channel In 2day Timeframe Trying to Break Descending Channel Once Channel Got cleared Bounce Will Be epic
Incase Of Successful breakout expecting 240 to 260% bullish Move

SXP at supply zoneHello traders, SXP is currently at high supply zone, and it had rejection couple times at the same current zone on Daily time frame... and it has room to 0.20$...
I am looking to short at 0.48 - 0.50 and stop loss above the red box (supply zone)...
manage your risk, and tight stop loss & happy trading <3

SXPUSDT(SXP) Daily tf Range Updated till 30-03-23SXPUSDT(SXP) Daily timeframe range. a massive daily green candle broke through #0.3673 and trying to reach out #0.5103 clearing that out can open a easy space till #0.6159.failing here will get it back to #3673 or below.

Unlocking the Trading Potential of SXPSXP is currently trading at $0.2895 with an RSI of 53. The daily timeframe Fibonacci retracements show SXP has room to retrace further. The upper Bollinger band may provide resistance while the lower band is a support level. The volume is high, but the trend may be weak and SXP may be overbought. The hourly EMA 50 indicates a bullish short-term trend. Traders should consider these factors before making any decisions about buying, selling, or holding SXP.

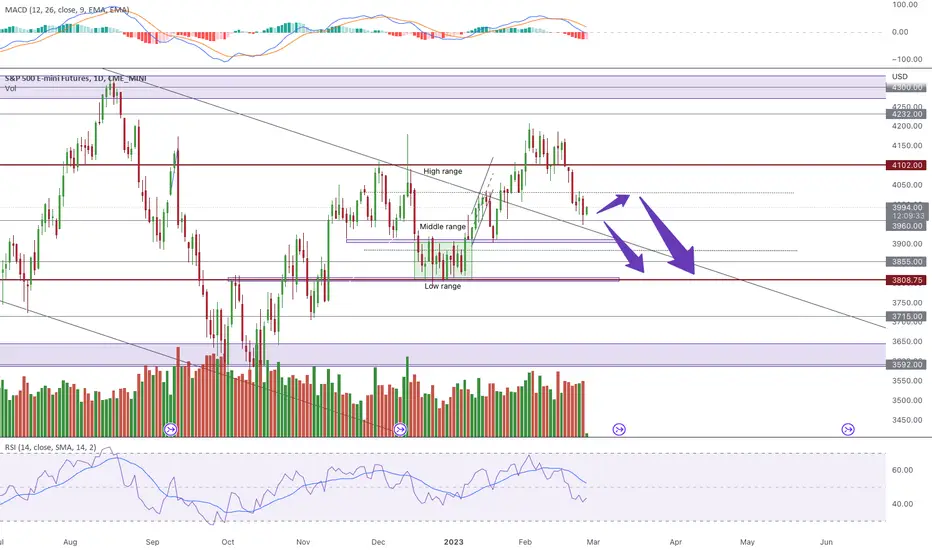
spx500 as i wrote before, for me its really important to see that we are above 4022 price to say we are kind of Bullish. right now its a roller coaster ) lets see whats gonna Powell say tomorrow))

I HAVE SEEN THIS PATTERN BEFOREBitcoin is forming a head and shoulders pattern on weekly time frame.
The larger the time frame, the more positive probability it is.
But, this will play out when BTC breaks the heavy resistance on it's current price at ($24.4k - ish).
But don't forget to anticipate the consolidation inside the demand and supply zone. Let's just follow and ride the trend.
But over all, $BTC is freaking bullish. Bullish bullish bullish!!

Fundamental and Technical Analysis | FebuaryTable of Content:
1. Eurozone Inflation Data
2. US Economics Growth
3. NVDA
4. Commodities
5. Technical Analysis
1. Eurozone Inflation Data
The Eurozone's inflation for the month of January has exceeded the previously estimated figures, as reported by MarketWatch on February 23. It has been emphasized by policymakers that the economy is undergoing a disinflation process, and a soft landing has been achieved. However, the recent surge in inflation within the European Union implies a substantial escalation in interest rates.
2. US Economic Growth
The US economy experienced a less robust economic expansion than previously estimated in the fourth quarter, as evidenced by a downward revision in consumer spending. This adjustment has resulted in weaker economic growth (Bloomberg).
The total amount of outstanding credit card debt in the United States has reached $986 billion, with an average interest rate of 20%. This marks the highest level of credit card debt since the 1980s and translates into an interest payment of $200 billion per year. These figures do not include other forms of debt such as mortgages, student loans, and car loans, which are likely to exacerbate the situation. At the same time, the US government is paying over $200 billion in interest payments
The Personal Consumption Expenditures Price Index has risen from 5.3% to 5.4%, however, this data alone is insufficient to support the notion of disinflation. The Gross Domestic Product (GDP) has been revised downwards from 2.9% to 2.7% (a decrease of 0.2%) from the preceding quarter. According to Bloomberg, the US economy experienced a weaker expansion than originally projected.
Revised fourth-quarter inflation figures have been adjusted upward.
Additionally, JP Morgan's Jamie Dimon stated that "The Federal Reserve has lost a little bit of control of inflation". He has been warning about the economy for a while and I believe that he knows something is cracking as we speak.
3. NVDA
The stock price of $NVDA experienced double-digit growth. The stock price has risen by 100% since the beginning of the year. Revenues and profits have both decreased by 21% and 52% respectively on a year-over-year basis, and every segment of the business has exhibited a decline over the same period. The CEO placed significant emphasis on the importance of Artificial Intelligence, yet he sold stocks worth over $100 million prior to the market's significant downturn and may presently be engaged in additional sales.
4. Commodities
The statement suggests an anticipated appreciation in the value of the US dollar, which is reflected in the downward movements of gold, silver, platinum, copper, and various grains such as corn, rice, and soybean. Conversely, energy commodities are experiencing an upward trend, with natural gas exhibiting a significant increase.
5. Technical Analysis
The 21-day weighted ratio of equity-only put-to-call options is suggestive of a preponderance of puts in the market and indicates a significant degree of buying pressure. This metric has demonstrated a high degree of efficacy in identifying market highs and lows by suggesting a move in the opposite direction to the put/call ratio. Notably, during the present bear market, the ratio has achieved a 100% success rate. Furthermore, the current volume of call options is the highest on record, and retail investors are contributing $1.1 billion daily to the market.
-Momentum indicators: RSI and MACD moving downwards and volume remain below average (bearish)
As previously stated, " I will take the opportunity of a rise in equity markets to short BTC at higher levels". I have now filled all my short position on BTC in a confident manner. Below is my BTC outlook
Conclusion:
The recent market rally, spurred by technical indicators, high-quantity puts, and government emphasis on disinflation, has led to a surge in retail investment. As a result, prices for some assets have skyrocketed, and the quantity of long positions in the market has reached alarming levels. This suggests an overabundance of buying and a lack of liquidity that could cause the market to dip and potentially result in retail closures, as inflation has proven to be more persistent than anticipated by governments. I remain committed to my long-term investment plan, I am acknowledging the growing fissures in some economies that could lead to a catastrophic downturn. It is essential to remain vigilant and prepare for potential market turbulence in the future.
As previously mentioned, my portfolio consists of short-term bonds, USD, SPX shorts, BTC Shorts, small quantity gold, and just acquired Natural gas contracts.
For personal records but feel free to discuss or argue.
micro update for SXPThese trades reflect my trading history and are not investment advice and I am not your financial advisor
Trades will be updated on the same published chart such as Take Profit, Early Exit or Partial Exit..... Good luck to all


SXP has been rallying well over the past few weeksSXP has been rallying well over the past few weeks, and the buying pressure that started at the bottom of the long-term descending channel suggests that the support at $0.20 could be one of the strongest retracement ranges for the long to medium-term.
But note that these strong retracement moves on the weekly time frame can take the trend out of the fully bearish mode on the weekly time frame. In the last 24 hours, the currency has registered more than 20% price growth, creating a static break of the $0.32 resistance zone.
Due to the heavy volume of trading done yesterday, as long as the SXP support is maintained in the $0.280-$0.290 range, we can expect the price growth to continue to the resistance in the $0.460-$0.490 range.
Note that in the daily timeframe, the price trend is inside a smaller descending channel, and the ceiling of the channel was hit yesterday. Therefore, price correction can still be accompanied by demand until the previous floor of the spike candlestick is broken. One of the most reliable short-term supports is considered in the range of $0.301 to $0.306.

SXP StructurePossible right sholder forming.
- If 3.16 is broken expecting $3.6.
- Lower risk of return to $2 support.
CPI data - 14th Feb
Best, HF
