SXTUSDT Forming Descending ChannelSXTUSDT is currently exhibiting a Descending Channel Pattern, a classic bullish reversal signal when spotted in a well-defined downtrend. This pattern suggests a temporary consolidation phase where price consistently makes lower highs and lower lows within a parallel channel. However, as the price approaches the lower boundary of the channel and begins to show signs of reversal, it indicates growing bullish momentum that could soon lead to a breakout to the upside.
The volume profile is supporting this technical structure, with gradual accumulation taking place at the lower levels of the channel. This is often a sign that smart money is positioning before a potential breakout. Historically, breakouts from descending channels are followed by rapid upward movement, especially when accompanied by a volume spike. With SXTUSDT, a confirmed breakout could easily trigger a bullish wave toward the projected 140% to 150%+ gain zone, aligning with current market trends favoring high-reward altcoin setups.
Investor sentiment is improving as SXT gains traction among retail and institutional traders. The token is currently trading at a discount relative to its previous highs, making it a compelling opportunity for swing traders and medium-term investors. The descending channel breakout scenario could also be amplified by broader bullish market conditions or news catalysts that push the sentiment further in SXT’s favor.
This setup is one to watch closely. With strong technical alignment, a bullish pattern, and increasing interest across social platforms, SXTUSDT is primed for a major breakout. Traders looking for a well-structured, high-upside trade should keep this pair on their radar.
✅ Show your support by hitting the like button and
✅ Leaving a comment below! (What is You opinion about this Coin)
Your feedback and engagement keep me inspired to share more insightful market analysis with you!
SXT

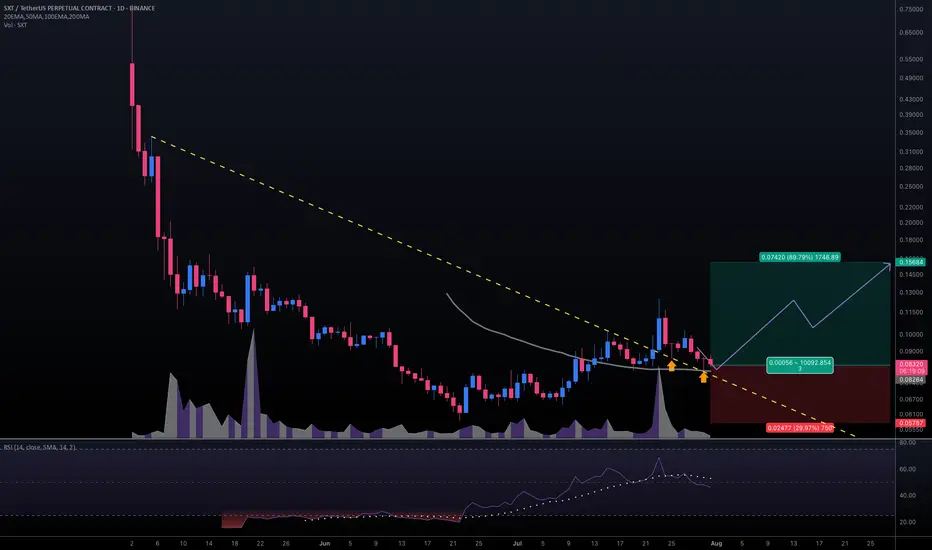
#SXTUSDT #1D (Binance Futures) Descending trendline break retestSpace and Time (SXT) pulled back to 50MA daily support, looks ready for mid-term recovery after those two dragonfly dojis in a row.
⚡️⚡️ #SXT/USDT ⚡️⚡️
Exchanges: Binance Futures
Signal Type: Regular (Long)
Leverage: Isolated (2.0X)
Amount: 5.0%
Entry Targets:
1) 0.08264
Take-Profit Targets:
1) 0.15684
Stop Targets:
1) 0.05787
Published By: @Zblaba
NYSE:SXT BINANCE:SXTUSDT.P #1D #SpaceAndTime #ZK #AI #DPoS spaceandtime.io
Risk/Reward= 1:3.0
Expected Profit= +179.6%
Possible Loss= -59.9%
Estimated Gaintime= 1 month
Space and Time: Trading Strategy · 1 BTC = 2.5 BTC (PP: 150%)Are you interested in a double-up?
Let's use round numbers to keep it simple.
Trade: Buy 1 BTC STXUSDT = Get 2.5 BTC (150% profits).
Time duration: 20-40 days.
Risk: Very low (time).
The risk can be calculated in time. Since this is a spot trade, you cannot get liquidated. In the worst case scenario, you wait. This is the only risk if the chart breaks down. If it works as planned, you can get 150% profits (250% earnings) by selling on target.
Time duration is "short-term." Which is within 30 days. Here I set 20-40 days to allow for any unexpected variations.
The trade is any amount you want. $1,000 USDT bought at current price, say 0.0890, would result in $2,500 USDT if selling happens at 0.2229. This is just an example of course for illustration purposes.
The trick is to be ready to wait. If waiting is hard, one can be use diversification to be entertained. Say, $250 USDT on four different pairs that have good potential for growth. Can be $2,500 USDT by 4 if the capital is $10,000. Or $10,000 USDT by 10 if the capital is $100,000. There are many different ways to approach the market.
A different approach: $10,000 in. The market (pair in question) grows 25%. Close position (sell). Result = $12,500. Find new pair and repeat.
The stop-loss can be a tight one at 5%. If prices drop 5% close position. Result = $9,500. Try again with a different pair. The stop-loss can be set at 10%, 15%, 20%, based on the chart, etc.
There is also a trailing stop. Adjust the stop below a certain level as prices rise, after you catch the rising trend. This is a bit more advanced and it is mainly used by profitable traders.
Patience is key. If you can wait, you can win.
Space and Time (SXT) is set to grow. How you approach this market is up to you. Remember to do your own research and planning. This is not financial advice. I am sharing for learning and entertainment purposes only.
Thank you for reading.
Namaste.

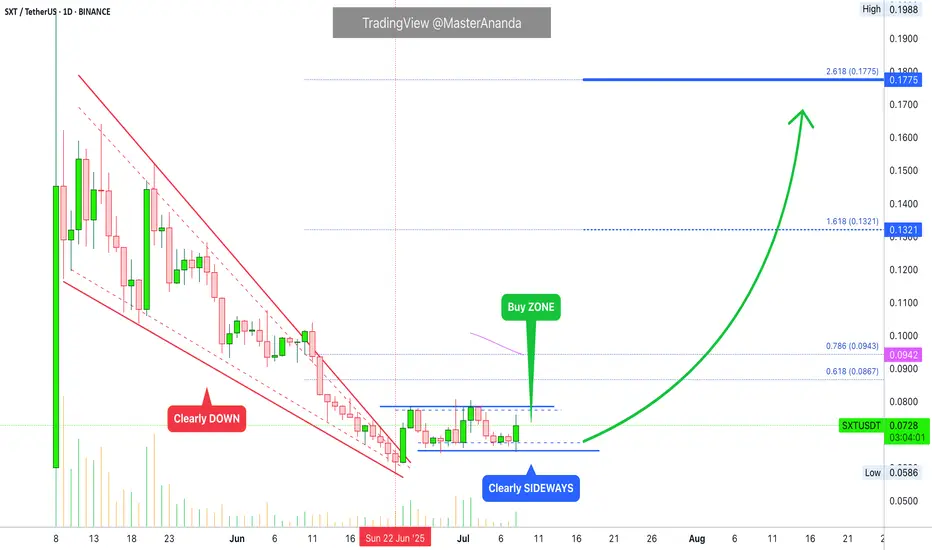
Space and Time Buy Zone: 1,000% or More Profits PotentialWhen the market is no longer bearish we know that something changed. We are going to be looking at the same price pattern we've been looking at on multiple charts.
Space and Time (SXT) was bearish, strongly bearish within a falling wedge pattern. On June 22 the bearish action ceased completely and the pattern broke. SXTUSDT went from clearly DOWN to clearly SIDEWAYS action. This is a huge change in price and candles pattern.
The highest bearish volume came in early May and later late May. As prices move lower, trading volume continued to decrease. As the ATL was hit, bear volume was really low. Lower lows with decreasing volume indicates the bearish move is losing force. Sure enough, the next day we get some green candles and volume starts to go up.
The market is changing, we are going from bearish to bullish and we are now in the transition period, prices moving within the buy zone.
This is the opportunity to buy within the accumulation range. The prices now are the best before a bullish breakout and major bullish run.
This looks like a good pair, the chart shows very low risk vs a high potential for reward. We are approaching the pair short-term because of the young chart, but you can buy and wait until prices grow. This pair can easily give 1,000% or more.
Namaste.
#SXT/USDT#SXT
The price is moving within a descending channel on the 1-hour frame and is expected to break and continue upward.
We have a trend to stabilize above the 100 moving average once again.
We have a downtrend on the RSI indicator, which supports the upward move by breaking it upward.
We have a support area at the lower limit of the channel at 0.0690, acting as strong support from which the price can rebound.
Entry price: 0.0717
First target: 0.0744
Second target: 0.0768
Third target: 0.0798

SXTUSDT Forming Falling WedgeSXTUSDT is currently forming a falling wedge pattern, a classic bullish reversal setup that often precedes significant upward price action. This formation indicates a tightening price range and declining volatility, typically signaling a breakout to the upside as selling pressure weakens. Technically, this setup becomes even more powerful when accompanied by increased volume near the breakout point — which is now becoming evident on SXTUSDT’s chart.
The wedge’s structure shows a series of lower highs and lower lows converging toward an apex. Once a confirmed breakout above the descending resistance occurs, the projected move could yield an impressive 140% to 150%+ gain from current levels. This projection aligns with historical wedge performance, where the move after breakout often mirrors the widest part of the wedge pattern. Such a scenario positions SXTUSDT as a strong candidate for short-term swing trades and longer-term speculative entries.
Investor interest in this project has been rising steadily, evidenced by increased discussion across trading communities and growing activity in order books. As the broader market sentiment shifts toward undervalued altcoins, SXTUSDT is likely to benefit from capital rotation. If momentum continues building, it could spark a breakout rally fueled by both technical and fundamental appeal.
Traders should monitor key breakout levels and look for confirmation via bullish candlestick formations and surging volume. SXTUSDT’s wedge breakout potential puts it in a favorable technical position to outperform in the coming sessions. Patience and precise entry could reward traders handsomely if the wedge pattern plays out as expected.
✅ Show your support by hitting the like button and
✅ Leaving a comment below! (What is You opinion about this Coin)
Your feedback and engagement keep me inspired to share more insightful market analysis with you!

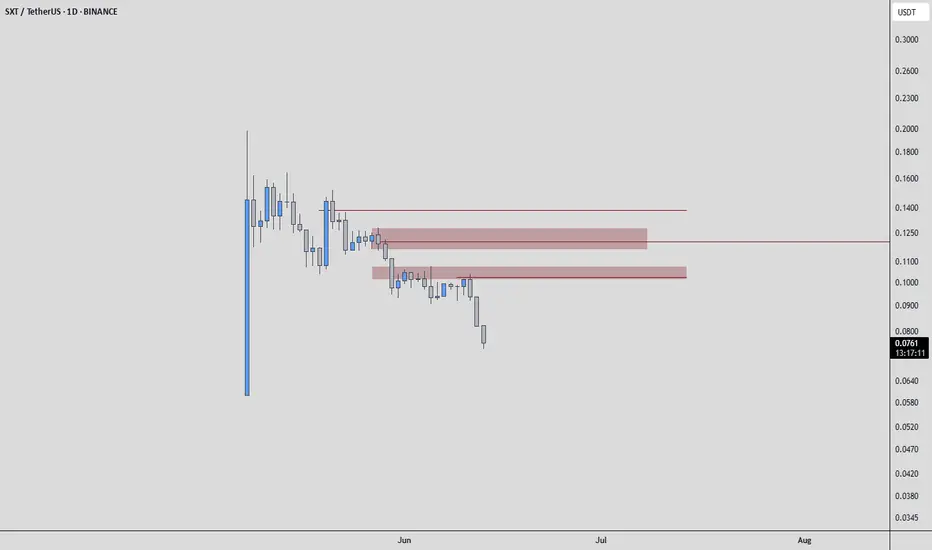
SXTUSDT: Sellers Dominate. Your Short Opportunity is Here. The truth is stark: price is falling, and buyers are still nowhere to be found. This isn't a market signaling demand; it's a clear display of strong sellers in control.
Most traders get lost in the noise. But you? You need a clear path. My strategy is simple: those red boxes and lines on the chart? They're your critical zones for short entries.
Here's your plan:
Wait for Contact: Price must touch these red zones.
Seek LTF Breakdowns: On lower timeframes, look for decisive bearish structures.
Confirm the Weakness: Check the volume footprint for genuine selling spikes and CDV (Cumulative Delta Volume) for firmly negative readings.
Why does this matter? While SXTUSDT highlights weakness, understanding its volume dynamics is key to identifying high-probability short setups.
Keep a very close eye on these red zones and lines. If these confirmations appear, you'll uncover clear, strategic short entries. Don't be surprised if SXTUSDT continues its bearish trend. This is where smart decisions are made.
📌I keep my charts clean and simple because I believe clarity leads to better decisions.
📌My approach is built on years of experience and a solid track record. I don’t claim to know it all but I’m confident in my ability to spot high-probability setups.
📌If you would like to learn how to use the heatmap, cumulative volume delta and volume footprint techniques that I use below to determine very accurate demand regions, you can send me a private message. I help anyone who wants it completely free of charge.
🔑I have a long list of my proven technique below:
🎯 ZENUSDT.P: Patience & Profitability | %230 Reaction from the Sniper Entry
🐶 DOGEUSDT.P: Next Move
🎨 RENDERUSDT.P: Opportunity of the Month
💎 ETHUSDT.P: Where to Retrace
🟢 BNBUSDT.P: Potential Surge
📊 BTC Dominance: Reaction Zone
🌊 WAVESUSDT.P: Demand Zone Potential
🟣 UNIUSDT.P: Long-Term Trade
🔵 XRPUSDT.P: Entry Zones
🔗 LINKUSDT.P: Follow The River
📈 BTCUSDT.P: Two Key Demand Zones
🟩 POLUSDT: Bullish Momentum
🌟 PENDLEUSDT.P: Where Opportunity Meets Precision
🔥 BTCUSDT.P: Liquidation of Highly Leveraged Longs
🌊 SOLUSDT.P: SOL's Dip - Your Opportunity
🐸 1000PEPEUSDT.P: Prime Bounce Zone Unlocked
🚀 ETHUSDT.P: Set to Explode - Don't Miss This Game Changer
🤖 IQUSDT: Smart Plan
⚡️ PONDUSDT: A Trade Not Taken Is Better Than a Losing One
💼 STMXUSDT: 2 Buying Areas
🐢 TURBOUSDT: Buy Zones and Buyer Presence
🌍 ICPUSDT.P: Massive Upside Potential | Check the Trade Update For Seeing Results
🟠 IDEXUSDT: Spot Buy Area | %26 Profit if You Trade with MSB
📌 USUALUSDT: Buyers Are Active + %70 Profit in Total
🌟 FORTHUSDT: Sniper Entry +%26 Reaction
🐳 QKCUSDT: Sniper Entry +%57 Reaction
📊 BTC.D: Retest of Key Area Highly Likely
📊 XNOUSDT %80 Reaction with a Simple Blue Box!
📊 BELUSDT Amazing %120 Reaction!
📊 Simple Red Box, Extraordinary Results
📊 TIAUSDT | Still No Buyers—Maintaining a Bearish Outlook
📊 OGNUSDT | One of Today’s Highest Volume Gainers – +32.44%
📊 TRXUSDT - I Do My Thing Again
📊 FLOKIUSDT - +%100 From Blue Box!
📊 SFP/USDT - Perfect Entry %80 Profit!
📊 AAVEUSDT - WE DID IT AGAIN!
I stopped adding to the list because it's kinda tiring to add 5-10 charts in every move but you can check my profile and see that it goes on..