XAUUSD - Short again at H1Daily group wave I, II, III... is at wave IV to V (Down)
H1 group wave 1, 2, 3... has a rule symmetry waves.
- Stop loss: 1201.03
- 3 targets are calculated by Elliot rule wave
tp1: 1179.67
tp2: 1172.43
tp3: 1160.56
like, comment, follow me. Good luck.
Symmetry

USDWTI - What next?Look left for finding the Next Target of Oli.
2 targets are calculated by Elliot rule will be: 78.63 and 94.79
Like, comment, follow me. Thanks

AUDCHF - long at H1 (II) restart label for Weekly group is at fibo 120 Extension (broken weekly Uptrend).
Reversal is activated when AUDCHF up beyond 120% previous rule wave
At the present, He has a rule symmetry wave at the wave 2.
Thus, I predict AUDCHF will up again with 5 wave Elliot rule
TP1: 38.2, TP2:23.6, TP3: 0
Stop loss: 0.68615
Good luck with All

USDTRY - short at H1Look to the left.
16 Aug 2018: 5.67354 breaks the symmetrical wave rule (reversal pattern) for a long-term downtrend, counted as wave I.
30 Aug 2018: The market corrected for wave II
Thus, I expect the market to drop from Wave II to Wave III.
- Monitor 1: wave group on I, II, III ... (Down)
- Monitor 2: H4 wave group (1) (2) (3) ... increase the tuning wave (3) and break the trend from the wave (4)
- Monitor 3: Wave group H1 1, 2, 3 ... appeared the rule wave symmetry.
* Sell limited: 6.38927 - 6.50385
* Stop loss: 6.86093
* TP1: 5.49678 - TP2: 5.18436 - TP3: 4.66535
Like, comment, follow for me. Good lucks.


GBPUSD - long at DailyMonitor 1: Daily's trend has a reversal for the Uptrend.
Monitor 2: H4 has a correction to zone for Buy at Daily Group wave.
Monitor 3: H1 wait for a reversal break rule symmetry wave of H4 for Buy follow Monitor 1. 1.3092 is the price for reversal.
3 targets are calculated by Elliot rule.

USDJPY - short at wave 13? (symmetry waves)* Rarely appears 13 waves in one trend, DXY reached the Zone for a sell. Thus I predict USDJPY will down.
* 3 targets are calculated by Elliot rule wave.
* The Stop loss is at 161.8 Fibonacci Extension (Reversal for big uptrend of Weekly zone)
* Sell stop is at zone for reversal 120-161.8 of H1 group waves

AUDNZD - long at DailyMonitor 1: Daily is at the Wave IV (UP)
Monitor 2: H4 was dropped to The Zone for a buy of Daily Group
Monitor 3: H1 has a rule symmetry wave VS a long tail candle
Stop loss: equal the double candle and below 120% Fibonacci Extension.
3 targets are calculated by Elliot rule wave
Buy now or buy limited at a half of long tail candle
My Entry is at a half of long tail candle

GBPCAD - short again at H1GBPCAD has a rule symmetry wave at the wave 2.
Look left, The Reversal was at 44.6 fibo.
Thus, I predict GBPCAD will down with 5 waves to complete the Bat Harmonic.
Tp1: 1.68219, TP2: 1.66660
Stop loss: 1.71882

BTCUSD - long at H1Monitor 1: H4 (up)
Monitor 2: H1 correction (down)
Monitor 3: M15 has a reversal at 120 Fibonacci Extension for break Monitor 2. Buy accord to Monitor 1
Target 1: 6665.39, Target 2: 6746.35, Target 3: 6877.21
Stop loss: 120% Extension of The Magnitude H4

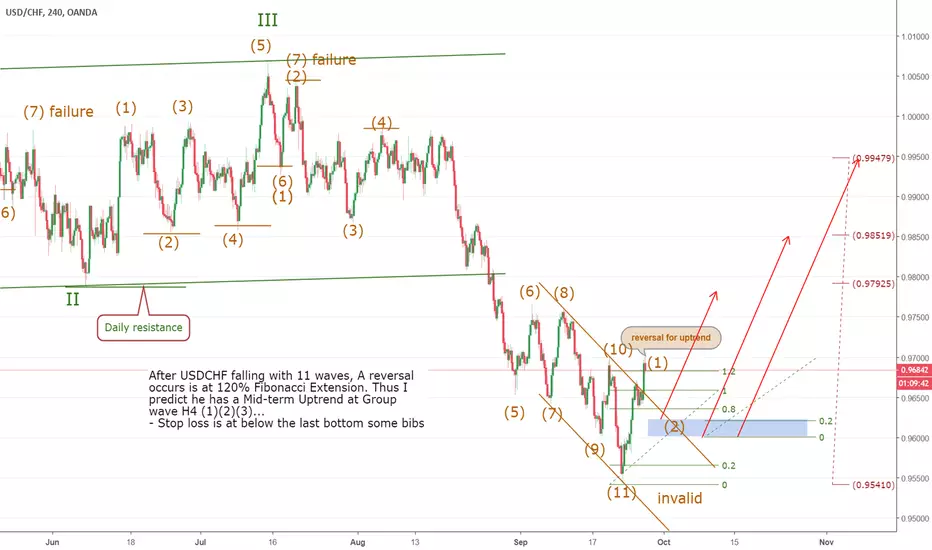
USDCHF - Long at H4After USDCHF falling with 11 waves, A reversal occurs is at 120% Fibonacci Extension. Thus I predict he has a Mid-term Uptrend at Group wave H4 (1)(2)(3)...
- Stop loss is at below the last bottom some bibs
EURUSD - long again at H4After EURUSD completed the Butterfly Harmonic pattern, she has a corrective to group wave H4
I predict EURUSD will go Up again.
Entry 1: Buy at the wave (4) to (5)
Entry 2: at Group wave daily I, II, III... buy at the wave IV to V


EURAUD - short again at H4After falling into the zone IV Daily, EURAUD goes up to the wave (4) H4 time-frame. At present, the price decreases break the rule of wave H1. Hope EURAUD will drop again to zone IV Daily wave (will take profit here).
Stop loss above wave (2) some bibs
** If prices drop by more than 120% fibo Daily will sell next

BCHBTC - Short again at DailyBitcoin cash / Bitcoin is still in the long-term downtrend. Look at the left two wave groups decide the decay still effective:
1. Weekly: (I) (II) (III) ... currently in wave (III)
2. Daily I, II, III ... are currently in wave IX increasing the adjustment to wave X.
Plan 1: Waiting for X wave zone waiting for a signal to sell down XI wave.
Plan 2: sell limited at 0.07852-0.07994
Stop loss: 120fibo (0.08290)
Take profits 1: 61.8fibo (0.07132)
Take profits 2: 100fibo (0.06581)

CADCHF - Long again at H4Look left, the biggest retracement was broken at 120% Fibonacci Extension.
At the present, CADCHF has a rule retracement at the wave 2.
Thus, I predict CADCHF will up again from the wave 4 to wave 5.
Target 1: 38.2 (61.8) 0.74582
Target 2 is at Garley (78.6) 0.75100
Stop loss: 120% extension 0.73685

GBPNZD - short at h1Nine waves (h1) vs 261.8 Extension from the wave (1) H4. Thus, I predict GBPNZD will correct to wave (2) at H4.
Make a bit short

GBPCAD - short at H1The last top has reached the Zone of Daily wave
Should to sell follow the Reversal signal (drop beyond 120 fibo Extension)
Sell from the wave 2 to wave 3

AUDJPY - short at H4 (Symmetry Wave)Look left, We have two zones for a sell.
1. Group wave daily I, II, III... Now the AUDJPY is at the wave V go to wave VI.
2. Group wave H4 (1), (2), (3)... Now she is at the wave (3) to wave (4) and she reaches the Potential zone of group wave (80-100% the magnitude).
Plan:
Trade 1: wait for a signal at the smaller H1, 30 minutes ... * Invalid is at 120%
Trade 2: When she reaches zone for a sell of group wave Daily, wait for a signal at the smaller H1, 30 minutes ... * Invalid is at 120%
Target 1: is at 61.8 Fibonacci
Target 2: is at 80 Fibonacci

EURUSD - long at H4The biggest retracement of Weekly group wave was broken at the wave VIII for the Uptrend
The Group wave H4 (1)(2)(3) have a rule wave. Thus, I predict EURUSD will up accord to Weekly signal
- Target 1: the last top
- Target 2: Butterfly pattern (127.4 Extension)
- Stop loss: 1.15626

XAUUSD - Long at H1 with symmetry wave ruleReversal for uptrend at wave 1 (break 120% of biggest retracement)
Buy from zone wave 4 follow wave 2 rule (80 - 100%)
Target 1: 38.2-23.6 (wave 3 Elliot)
Target 2: 0 (Wave 5 Elliot)
Stop loss: behind the last bottom some bibs

DE30EUR - Down again at H1Look left, the downtrend signal is activated (drop beyond 120% of the biggest Retracement of the uptrend)
Two group waves for sell:
1. At the H4 timeframe (group waves (1)(2)(3)...).
2. At the H1 timeframe (group waves 1,2,3...).
Early entry: 80% Fibonacci (80/20% rule)
Reasonable entry: Sell limited at 90-100% Fibonacci
Late entry: Wait to signal at the smaller timeframe (new price action, double top, head&shouder...)
The stop loss is at 120% Fibonacci Extension.
When DE30EUR down again, should be moving the stop loss to accord the next rule symmetry wave of the downtrend.
Plan: Move to the stop-loss at 80% of the biggest retracement of the Uptrend (group wave Weekly (I)(II)(III)...
Good luck with All.

CADCHF - Update chart 9-2018After CADCHF reached Weekly's zone of wave groups and up. Thus I predict he will go up from the wave 2 to 3 at h1 group waves.
The correction is copied from previous waves
Next target is at 4 hourly's zone wave
