Syscoin (SYSBTC) Prints High Volume (Bulls Are Watching)Syscoin (SYSBTC) seems to be reaching a low after printing a strong bullish candlestick pattern.
Back in mid-May a low was hit and SYSBTC bounced and tried to break above EMA50 without luck. After this low was hit EMA5 and EMA10 were easily broken but there was no volume to support this break, this can be easily seen on the chart above.
We take a look now at the inverted hammer on the 18-June, we can see massive volume while again EMA50 rejected the growth.
Now, on the 27-June, we see another attempt to break above EMA5 and EMA10 (today), but this time we have significant volume (high volume/above average) and the MACD and RSI trending towards the bulls.
Great potential here... Keep an eye out on this altcoin pair.
Make sure to hit like if you enjoyed this post and want to show your support.
Thanks a lot for reading.
This is Alan Masters.
YES! ALWAYS PRESENT, STAY POSITIVE
Changing mood is normal, it is good… It is wise to express and accept what we feel.
In certain situations, you can or have to choose between fight or love.
But let’s not judge the experience, just enjoy and learn from it all.
So maybe we won or lost the game…
Maybe the case goes right or wrong.
It doesn’t matter what really happens…
YES… Always present… Stay positive…
Another opportunity will always come.
Namaste.
SYS

$SYS/BTC$SYS
It is on the verge of breaking out. Symmetrical Triangle formation and golden ratio support giving a strong buy indication.
Buy; 805-810
ST1; 860
ST2; 915
ST3; 980
Stop Loss; 760

SYSBTC descending triangleFollow sys and execute a trade after breakout.
Target and stoploss are in the chart.


SYSCOINEveryone says the altcoin season will be soon, others say that the season has already begun. need to understand After the domination of Bitcoin reached 63% and after dropped to 57% and at this time the first jumps of alcoins from the bottom occurred. For some, it really is a signal to start a new growth of some altcoins. Everyone understood that Bitcoin really has value and at the moment its value is $ 7-8k per coin and even more. And all people with Bitcoin want to increase the number of coins by investing in other altcoins. It's quite simple, and after one coin flies away, others follow, I’m talking about big coins, because the pimps of the banknotes occur every day from 20-80%. But they are not earned by many, but only by those who buy in the zone of use or sideways. Now I want to say about this coin, which has a great potential for growth, due to the fact that this publication is done when SYS is at a minimum. This is a strong level of support.
NEWS
Syscoin makes it's final move towards true #blockchain scalability: The official @Syscoin 4.0 Target Release Date/Time is set to June 4th, 2019 at 12:00PM PST (7PM UTC)

SYS possible 42% profit! SYS possible 30% profit!
Good news SYS:
June 4th confirmed: Release Date & Block Number
As block times vary (usually between 55–65 seconds per block), we previously indicated on our “Syscoin 4.0 Target Release Date” blog post that we would revisit the set block number prior to the set release date. The block number has been slightly adjusted to block 548690, solidifying the previously set June 4th target date at approximately 12PM PST (19:00 UTC), give or take a few minutes.


SYSBTC Entry ZoneSYS looking good For entry.
I am buying some and some placed bid down.
we can see good returns in coming days.
TP1: 1100+ satoshi
TP2: 1400+ satoshi
TP3: 1800 Satoshi


SYS looks like a good long target. OBV belies accumulation as price descends. Obviously BTC is pumping and for as long as it’s run continues the price will continue to fall so average down. Will update with targets.

$SYS Bounced hard from -.236 fib level..$SYS Bounced hard from -.236 fib level.. Currently trying to flip last support (now resistance)
Remember that #SYS is launching 4.0 on June 4th..
Volume rising
UCTS buy signal on the 12h and lower timeframes..
I expect some pullback at resistance and then continuation
#SYS

$SYS... Support at ~1100sats showing some signals of bouncing..update on $SYS... Support at ~1100sats showing some signals of hodling/bouncing while most alts in the market are falling...
UCTS buy signal on the 6H
Volume slowly increasing
RSI Bouncing from oversold levels
I would like to see price pushing above 1200sats...
#SYS


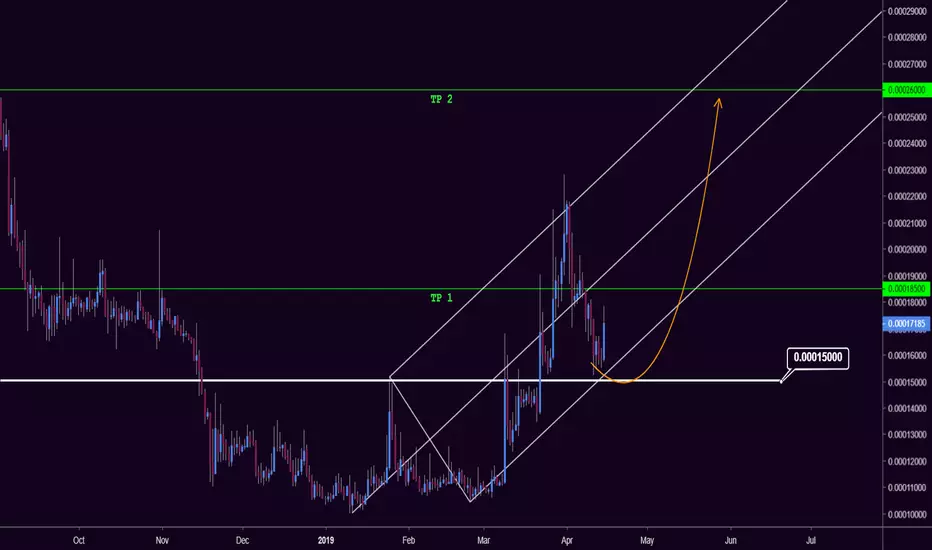
NULS a really nice tradeI analyzed it 4 days ago but totally forgot to publish it here. Here is the chart :
It's a little bit late for entry and you should wait for retrace
Targets :
18500 (DONE)
26000
30000
37000
$SYS Looking good...Potential ascending triangle as continuation$SYS Looking good...Potential ascending triangle as continuation of the trend
UCTS Buy signal active
Volume slowly increasing
EMA200/~1613sats as resistance
RSI & MACD flat for now
Targets in the chart, falling below the ascending trendline cancels it.
#SYS


SysCoin (SYSBTC) Starts To Show Bullish SignalsLooking at the daily chart for SysCoin, which is now trending on Binance, we can see some bullish signals taking place.
Let's take a look at those and see what we can learn:
SYSBTC broke above EMA10 and EMA50, but is now facing resistance at EMA100 (blue line) which pushed its price back many times in the past since December.
This is the main resistance to break, followed by MA200, for a strong move up.
The RSI is really bullish and has broken above all recent resistance.
The MACD is having a bullish crossover.
And we have some strong green candles.
Expect bullish action from SysCoin soon.
Conditions for change: If SysCoin (SYSBTC) fails to break resistance and closes below 0.00001065, these signals would be invalidated and a new analysis is needed.
Note: This is not a piece of trade advice. My trades contain buy-in range, targets, stop loss, capital allocation and additional details.
Thanks a lot for reading.
Namaste.

Syscoin on Airwhat is SYS? The powerful multi-purpose platform that puts your business on the block-chain

