SYSBTC

SYS/BTC Cup and Handle FormingThe SYS/STC pair appears to be forming a cup and handle. With the rebranding coming, it is likely this pattern will complete and the price will take off.
My target buy in is at 3850, stoploss at 3600 where there seems to be some weak support. For those willing to risk more, a stoploss at the stronger support of 3400 would be appropriate. Targets at 5000 and 7000.
Of course, if the bitcoin price takes off, there is a chance this alt will tank with all the others. I suspect the BTC price will drop in the next few days, leaving the door open for a short term rise in alts.
THIS IS NOT FINANCIAL ADVICE. USE THIS INFORMATION TO MAKE YOUR OWN TRADING CHOICES.


Trying to break up strong resistanceTrying to break up strong resistance
After successful break up falling wedge pattern, it is now trying to break strong resistance. We need full green candel closing above resistance line. If it success to close above resistance line, then we have 2 targets :
1- 5298
2- 6466
If price failed to close above reisistance line, it will back to near support at 3757.
This analysis based on TA. Please use your stop lose and money management.


$SYS is looking very good right now.$SYS is creating new higher lows, MACD's showing strong bullish divergence, RSI is still in bullish channel. In addition to these signals, 31th of october will bring their Masternodes. Good time to buy under 3.8k sat, to multiply your btc soon. 4h chart is clearly showing double bottom which is confirmed by healthy growing volume in last 24h. If you are holder then don't look at dips and just hold it for few days/weeks. If you are here for short set stop-loss if it really brekout from violet box. If it breakout upward from violet box above double b line, then know that moon will be touched soon :D


SYS BTC | Breakout Imminent | UptrendGood Buy
Broke out downtrend
Close to bottom support
Uptrend on its way
MACD showing strong buying momentum
Stoch RSI shows selling power is quite strong which could mean moving down the channel a little more
High Returns
Bad Buy
Volatile BTC movements
If fail to break out red resistance line
Buy Region
2600 - 3000 satoshis
Sell Region
first target - 4000
Second target - 5000
Long term target - 8000
Stop Loss
2000 satoshi
Overall, I think this is a good buy for the long term. At the bottom support. Low risk but high returns.
Do your own research!!
All the best!! :D


SYS USD BREAKOUTWe have a symetrical triangle formation on SYSUSD and might see a break out in SYS coins USD value by mid October reaching our price target by mid November.


SYSBTC. Correction is END. Upcoming Goals (~60% Profit)The daily chart shows that the upward movement was corrected and kept in the support area at 0.003850.
We also formed a triangle on 4 hours, if we hit the triangle up, the price goes to the first target at 0.0000541, then a small rollback and a continuation of the movement to goal 2 at 0.00006550 is possible.
Prepare a purchase order and wait for a breakout.
Buy: 0.00004130
Take Profit
Target 1: 0.00005410
Target 2: 0.00006550
Stop Loss: 0.00003570
Join for FREE my Telegram channel about Crypto Traiding (ENG/RUS)! t.me

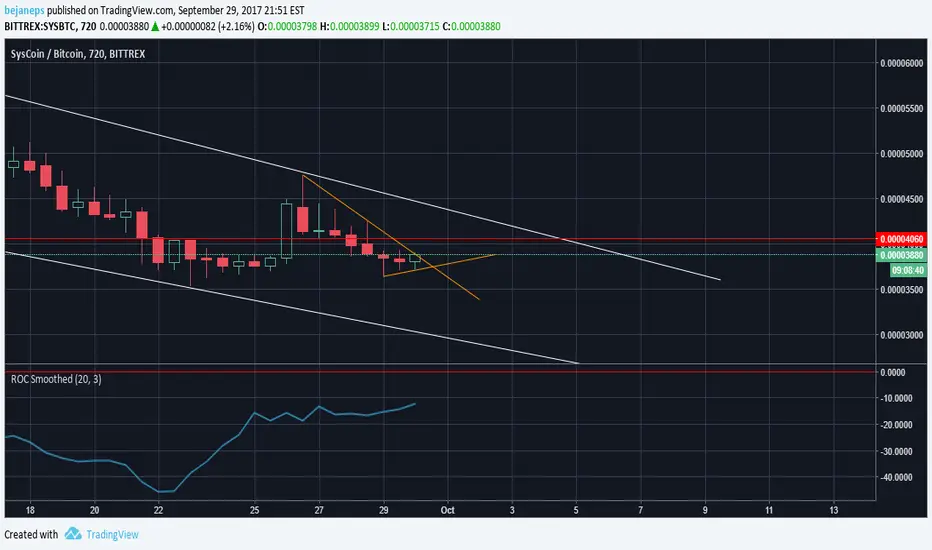
SysCoin Bearish DivergenceS-RoC Indicators shows divergence and we can obviously see that price is going to break triangle. If BTCUSDT doesn't fall and keeps it's price constantly increasing we may see SYSBTC on 0.000046 again. So, place your buy orders now or on 0.000038 and stop-loss on 0.000036. Good luck )


Potential Bearish butterfly SYSBTCThis is way early on this pattern but I will be watching how it plays out. I will update if the pattern remains and we near the d leg

Syscoin Entry LevelNew strong bullish candle gives us a signal of possible price reversal. RSI confirms it and MACD histogram supports upward movement. Based on this swing low we can draw a new uptrend line which will be a support line for the market. DMI allows to open long trades. Pending orders for buy can be placed at 0.000048 level with stop orders at 0.000021 level. The main profit target should be at 0.000080 resistance level. If the market drops below the uptrend line, it will be better to close long positions and wait for new trading signals.


