Syscoin Moves Next | The Altcoins Market Heats Up!Syscoin (SYSBTC) has been on my list to share a trade for a few days but my laziness didn't allow me to publish.
Take a look at the chart above, SYSBTC just produced a strong breakout and shows great potential for additional growth.
In my previous chart, I have this clearly mapped out, see it here:
Thanks a lot for your continued support.
Prosperous & Healthy 2020.
Namaste.
SYSBTC

SYS Update! +40% profits!!! Bang Bang :) SYS Update! +40% profits!!! Bang Bang :)
Bullish continuation above important levels have extended this leg up to astonishing levels. Cheers to everyone that did trade the setup.

SYS bouncing from 200MA nicely. Took it forever to push trough. SYS bouncing from 200MA nicely. Took it forever to push trough. Volume has been spiking nicely in identical time periods.
Someone is accumulating.
SYS chart reviewThe price 88 is probably the lowest price of SYS in the past 2 years. We are seeing a bullish triangle pattern forming below the 133 level.

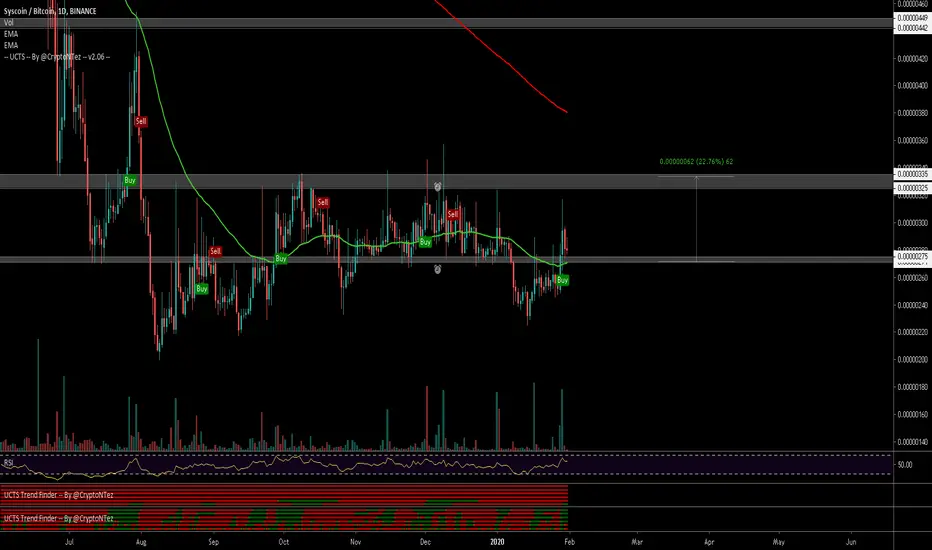
$SYS, Crossed and retesting ~275sats level (matching ema50)...$SYS
Crossed and retesting ~275sats level (matching ema50) on the 1D
Volume tends to spike on this asset from nothing, so taking an entry at potential support level could be a good idea w/ target at ~325sats..
UCTS Buy signal on the 1D and lower TFs..
#SYS
SysCoin Price near Key Resistanceprice is near key Resistance if close above the resistance than coin can jump 20% - 30% in short period of time
1) Volume breakout
2) price above 21 ema need to hold
3) facing Resistance with high volume
daily close above 278 - 280 is very good for next departure till than we must wait and enjoy the breakout will buy Retest ..

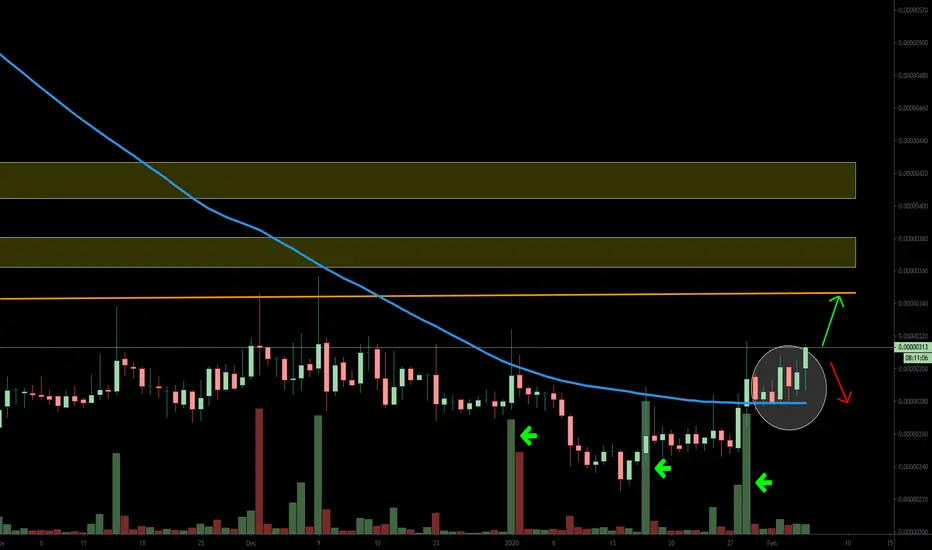
Syscoin Mapped | Support, Targets & Different PathsHere we have the chart for Syscoin (SYSBTC) fully mapped, please allow me a minute to share some of the details.
We have multiple channels, support, and resistance levels marked on this chart.
The light yellow area is where sideways consolidation can happen, prices going flat (blue arrow).
If 0.00000307 is broken, we can expect the bullish scenario to start to play out (green arrows).
If 0.00000268 is broken, we can expect the bearish scenario to start to take form (red arrows). Note, a bounce can always happen when the bearish scenario is activated because we are looking at a bullish chart in general.
The trend in general is bullish as we are seeing higher highs and higher lows.
The altcoins market is also growing and conquering resistance after resistance in a try to move higher.
Syscoin has huge potential long-term... Keep an eye on the chart.
Thanks a lot for reading.
Namaste.


ema200 test coming soonlike the schedule
are under 200 EMA
this means we are going to test it on a 4-hour watchmaker's setup for growth.
But in order to see growth, it is necessary to break through resistance at the beginning.
Breakdown will be strong and immediately to the goal
You can put a purchase order pending


Huge potential to hit 330 - 350 - 390 buying nowBased on this potential rebound to the previous high 3 days ago or a further jump above to 350 or higher. Buying a position here now.

SYSBTC BUY NOW UP coming soonSYSBTC BUY NOW UP coming soon
What is your opinion? Please leave your comments.

Syscoin Prepares For More | Uptrend Since August | Easy 40%+Syscoin (SYSBTC) has been in an uptrend after it hit a new low in early August. Now, this pair only keeps on growing.
The charts are really bullish and the SYSBTC pair caught my attention recently, meaning, this is about to move up.
SYSBTC Chart Signals
We have a really strong break above EMA50.
We can see new peaks (higher highs) being hit all the time. We have a clear uptrend forming.
We also have bullish indicators (MACD and RSI).
Volume breakout (sudden influx of trading volume).
All these signals are pointing to the same... Syscoin moving higher.
In case the prices go lower, I marked the different support levels with blue lines on the chart.
The targets (magenta) are also clearly marked.
Thanks a lot for reading.
Namaste.


SYSBTC Extremely Bullish ..Big PumpWell Accumulation is Very high you can see
In Black box i showed how much this coin Accumulated and now Moving Nice you can enter at Retest
But enter after settlement .. We can See Exit Pump too .. so please Put Strict Stop loss

#SYS $SYS @SYSCOIN 50D SMA Resistance#SYS - Daily chart showing ascending price action with ascending support.
50 day SMA acting as STRONG resistance, as you can see it's been tested and rejected many times. A breakthrough of the 50 day SMA (green) would be very bullish.
Breaking the ascending support would be bearish.

Syscoin Is Next To Wake Up! (Over 350% PProfits)Syscoin (SYSBTC) is the next altcoin pair to wake up and print a high volume breakout.
This breakout above EMA5/10 is normally followed by a retrace, but this is the signal that this pair is waking up.
Notice the red trendline, with a close above 0.00000360 satoshis on the daily timeframe, this resistance is broken and SYSBTC can start to consolidate or a new uptrend.
The RSI hit its highest point since March 2019.
This is just the beginning and also an early warning... More to come in the near future...
The Altcoins Market Continues To Heat Up...
Namaste.

Earn BTC through SyscoinRecently SYS/BTC broke above the minor resistance under strong buying volume. This should result in further price increase to test 200MA area.

SYS consolidating on top of old resistance, could move higher.SYS/BTC is currently consolidating on top of old resistance around 300-310, and is currently testing this descending resistance line that has held the price down since July 17th. As price enters the apex of this pennant/wedge formation, we could see SYS break to the upside for a potential 7-12% move, if not higher up toward that 4-hour 200 MA in Red. We also have the 4-hour 50 MA (in green) right in that support box as well adding an extra layer of support confluence. Higher risk given the current market environment.
MA Guide (All 4-hour for this post.)
50 MA in Green.
200 MA in Red.
Entry: 305-312.
Target 1: 335.
Target 2: 345.
Target 3: 4-hour 200 MA.
SL: 295-297 (below the green support box and below the 4-hour 50 MA.)
-This is not financial advice. Always do your own research and own due-diligence before investing and trading, as for investing and trading comes with high amounts of risk. I am not liable for any incurred losses or financial distress.
-As a side note, if you would like to support a college kid and the TA I do, I accept BTC/ETH/LTC/USDC donations. Any and all donations are greatly appreciated and really do help me out! Thank you to all you who donate. :)
BTC: 3F13946JWfNskLDu2oi3FTRV65FV9yK7U8
ETH: 0xe032430f158966F4118af917b5F1e024949697bB
LTC: MVDbAhm2yoyCzeRnayMN61oZp75MZ5SZVj
USDC: 0x1F6d47a9330897d6043886d64738A2E255dd0b92

