Ichimoku 0 buy signals SHORT. LONG and get rekt.ichimoku literally 0 buy signals
1) Lagging span is below the price - NO BUY SIGNAL
2) NO TK crossover. so no trend change.
3) Getting near the thick big cloud. which will probably reject it hardcore.
Price still trading below the cloud and the future cloud is still massive RED.
Ichimoku weekly says DO NOT BUY YET. of course don't buy while piece of shit bitfinex tether keeps pumping the price with 400 dollars premium.
Every tom dick and harry calling end of bearmarket while the basic TA suggests we are still in bear territory. you dont see that big red massive cloud above the price? yea, wait until price is above the cloud and future cloud is turning green. then scream END OF BEARMARKET JUMP IN MOON LAMBO MOON.
Also notice the volume declining while price moving up. near the MASSIVE resistance of 5800 - 6000.
remember ladies, you dont long resistance and you dont short support.
TA

Bitcoin at an important decision point in a confused marketHello traders!
Bitcoin has seen a significant drop yesterday with the Tether FUD articles emerging. We have now found ourselves in an interesting territory where Bitcoin has fallen to its 21 day EMA and is trying to find support. The altcoins have'nt shown the strength needed for a move upwards just yet and most of them have fallen below their 21 weekly EMA, which is one of the most important long term trendlines.
If the support at 5000$ is broken for Bitcoin, we could expect further movement to the downside with our next target at Bitcoin's 21 weekly EMA, which currently stands at around 4600$. The ongoing rally of the last few months is the first one to have reached (and went above) the mentioned average in quite some time. So far we have been rejected at the 21 weekly six times throughout this bear market. Finding support on that trendline would be crucial to resume bullish movement and perhaps increase the chance of the bear market being over.
If we, however, break that important support, we could be looking at another strong move to the downside with potential new lows in this bear market. For the bullish scenario, we would need to either find support at the level we are at currently or at the 21 weekly EMA of Bitcoin. By finding support I am not only referring to those trendlines holding, we would need to see buyers stepping in and showing interest by increasing the buy volume and consequently creating a strong bounce at the mentioned levels. If we do in fact see that happening, we would firstly aim for a double top at around 5600$ on Bitcoin and further movement to the resistance zone between 5800 and 6500$. Only by breaking those levels and holding the price above them would significantly increase the chance of the bear market being over.
When looking at the weekly Stochastic RSI, we can notice that it has been in the overbought territory for quite some time now. Although there is no certainty that overbought RSI levels mean the prices need to drop, however it is something I am keeping my eye on and is telling me long positions present a high risk setup.
Another important thing I have noticed in the charts is that we have fallen below an upwards sloping support trendline on the daily RSI which has been our support ever since the start of the rally in December (as shown in my chart).
I have 2 short term scenarios in mind.
1. Green arrow -> we find support at the 21 day EMA and continue our rally (less likely)
2. Red arrow -> the support at 5000$ is taken out and we aim for the 21 weekly EMA at around 4600$ (more likely)
Be careful as the uncertainty in the market will catch many people off guard. I wish you all a lot of success trading and if you liked the analysis, please give it a thumbs up. I will be posting these often if I see interest.

Perfect Rejection Played Out ? What will happen now ?Hello Hoomans.
I'm making a part 2 of my TA because my previous call was perfectly on point, so i'm here to catch up with you guys.
As you can see on the daily charts both of the sticks got closed below the line showing a great resistance in the weekly and daily chart, and that was exactly wat i called on my previous TA (test of the 100MA weekly & 350 daily)
At this point i'm very confident it is topping out but i'm not leaving out any retests at this point, if bitcoin holds support at the 5350-5400 there is a big chance that may happen.
Please like & subscribe so i can keep making TA's & Positions
MY PREVIOUS CALL:

YETI - THE PATH TO GAINS! WAVE 3 INCOMINGI called the top on my previous YETI post on a 2.0 extension. Currently watching this count to initiate a wave 3 down. Overlayed EW theory and lines up nice with the IPO share unlocking. Look for one more roll upwards to finish sub-wave 5 of wave 2.
Potential for 50% drop on wave 3 alone. Purchasing mid/late May puts otm sometime next week if the wave 5 of 2 plays out.
LOOK TO SHORT AT $32.50-$33.31 OR IF $30.67 IS BROKEN.

ICX-BTC Double Bollinger Bands The Double Bollinger Bands on ICX-BTC pair are now in the neutral zone again. Pay close attention to the price action at the middle BB (blue line in the middle). We will update the post once we see where the trend is going and provide you with a RRR setup. At this moment we are neutral and are waiting for price action on the BTC pair, however if BTC makes a move we will be waiting even longer to figure out where this is going.
A close below the middle BB will suggest that the downtrend is likely to continue. A strong close above the middle BB tells us that we are likely going to reverse the trend or at least touch the 1st or 2nd upper zone of the BB.
Extra info:
Green zone = bullish trend
Blue zone = neutral trend (break up or down this zone might indicate reversal)
Red zone = bearish trend
To be updated!!!


XLM Bottoming.... [Cigarette TA] #BottomFeeders #HighOnCoinsI think XLM is bottoming, buy and hodl to the top, sell some at targets.

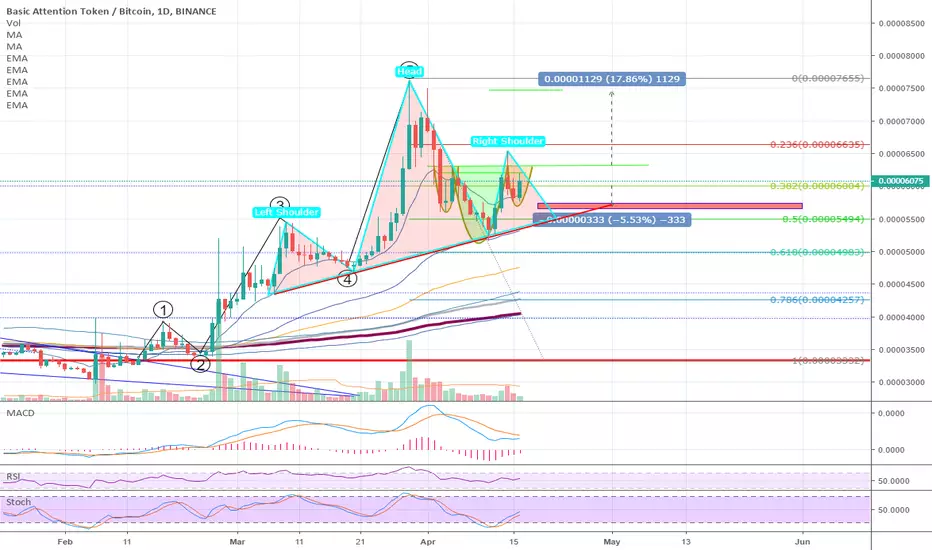
BAT - inverted head&shoulders nested inside larger head&shoulderThis is one example of why Elliot Wave Theory and Chart Patterns are so neat. Check out this chart.
You see a bullish inverted H&S nested inside of an much larger H&S. Which will complete and then confirm? SWEET!
Zilliqua new uptrend ZILBTC
This is an interesting chart at the moment. We did see a price decline after hitting the resistance, generally with declining volume during this price decline.
It kept on going and formed a bottom, much higher then the previous bottom. I consider this as a rejection to go lower, together with the bullish missing-right-shoulder divergence on MACD-H and on Elder Force Index.
This is a Higher Low and possibly the beginning of a new uptrend for Zilliqa.
The amount of volume has risen the end of the year 2018. And now with this pattern forming, I consider this a a longer term swing trade, and valid up to the resistance zone
That would be a nice time to take profits and decide to see if it is strong enough to reenter or even stay in it.
Elder Impulse is green on the daily chart.
Price is around the EMA, so a good place to enter would be here, or a bit lower. A study of the 4H or 1H chart will help me to place a good entry.
I put my SL way below the previous higher low, on the current minus 3 ATR channel line.
I consider this trade interesting, as the reistance zone is around 62-64. That means a Risk Reward ratio of 1:2.
SL: 399
If you’re interested to get a signal right away on your Telegram, please consider my free signal channel on t.me

VISA... SAME AS PAYPAL. SHORT IT!Made a VISA chart to compare against my paypal TA. very similar wave structure, but paypal will have more volatility. See my short term PYPL chart for entry targets.
Looking at major indexes (SPY/ DJI), the top is close. Whether youre a bull or a bear, the top of this 2019 rally is close... Algos will certainly be selling the ATH's if we even get that close. Check out the daily 200 MA's... right at the 0.618 for these stocks. Target here for a leg down.


$TSLA Analysis after Ben Baller 'Trapped in Tesla' SagaBen Baller is a celebrity jeweller, and such an erstwhile fan of Tesla that he gifted Elon Musk a ring last Christmas – a $40,000 custom diamond baguette and ruby Tesla ring, with the Tesla logo crafted from trillion-cut diamonds and ‘TESLA’ made out on the back with solid platinum and custom cut diamonds. Reason? To thank Musk for being an inspiration to him for creating 50,000 jobs in America and bringing the auto industry back. And for designing Baller’s Tesla, which he liked driving.
Maybe not anymore, because Baller made the news yesterday, sharing on social media: “I wish this was a f***ing joke. I’m locked inside my f***ing Tesla. I know I’ve been the Tesla fan, I’ve said so many good things about Tesla. But I’ve been locked in the car now for 37 minutes f***ing waiting for roadside assistance.”
Tesla share price seems to have survived the rant. The stock rebounded from a confluence of support in the guise of $250 historical support and the bottom of a falling wedge. The formation of a bullish abandoned baby could have signalled a temporary reversal in the downtrend dating back to mid-Dec. Prices are looking to test resistance formed by the upper boundary of the falling wedge and the 50-day SMA.

BTCUSD DOUBLE BOTTOM + INVERSE HEAD N SHOULDERS + ADAM AND EVE LEVIATHAN CAPTAL PARTNERS
BTC/USD
Technical analysis
31 march 2019
BTC is inside a uptrend channel.
BTC is about to break the inverse head and shoulders resistance.
BTC is bouncing from the fibonacci supports.
BTC closed 7 green weeks, technicals indicators shows some strength.
TECHNICAL ANALYSIS :
The inverse HAS have an important role in this uptrend and will probably push BTC out of the bear-market once confirmed. The resistance is around $4200 and once broken BTC should spike up to $4800/5000, this target match with the fibo projection (1.618). On the short term the fibo resistances worked well and we can expect to hit the $3980 zone before breaing all the resistances. On the technical indicator side : the MACD is bullish on the daily graph, The RSI is strong, the ichimoku cloud is bullish, volumes are ok but we’ll see more very soon, BTC tried to break the BB resistances but haven’t really yet. we’ll see this movement as soon as the IHAS is confirmed.
BTC is now above the 150ma line which play as a support for now.
BTC will hit 5000 before it hits 1600$ ;)
support/resistances :
support : 3980, 3860, 3650.
resistances : 4200, 4500, 4800, 5100.
alt market is strong, coins of the month : ZRX GRIN DGB STRAT ETC GNT NANO SNT LISK
this analysis has been made by Mena’hem SULTAN from leviathan capital partners for the paid channel
©BTCSMARTCONSULTING

Buy 1,03 - Sell 1,08 (x20)According to previous cicles and long term patterns we are getting close to a sweet buying position. This pair is oversold. Market volume at its maximum value.


Buy at 3.95 dipTA only, long term trade - look at this company for +/- related to accommodating Electric/ Autonomous/ AI trucking needs

$EVXI think this is a great risk to reward setup with lots of potential for upside.
I am laddering in the zones marked and the blue rectangles are my targets.

BTC/USD - Either make or breakBTC is currently range-trading between several trendines. The flag we're currently in, is pointing up which statistically is a bullish flag breaking up. If we fail to gain back the previous local top at $4190, price action guidelines say. "Confirmed fail to gain will result in a lower low before it's repeated again". Meaning if we fail to gain $4190, we should be looking at the $3,5k zone for a re-entry for longs. Taking a position where we are now is high risk trading and is not recommended.
On the long term, these are two important trends to watch.
The top one was the main rejection which caused the BTC dumping from 6k in combination with BCHs fork. If we manage to break above that trend with good volume it's a great indication for bullish continuation towards the 5k area.
It's also worth mentioning we got an almost perfect bullish inverted head and shoulders on the 3D chart. The shoulders are having the same candle close, and the neckline is picture perfect straight. Look after this one!
If you like it and would like to receive future updates - Please, follow me on TradingView!
If you follow me, I guarantee you will receive timely updates to this chart, and all other interesting tickers. This will allow you to stay on top of the current market sentiment and hopefully maximize your profits!
For support, sign up to Binance and Bitmex with these links for referral
www.bitmex.com
www.binance.com
If you agree, please, Like this Idea - This would be the best feedback and encouragement for me!


BTC obvious BearflagBitcoin will soon fall to the $3200 again!
There is an obvious bearflag in the BTC/USDT chart. Which is a sign for downfall. When the lower trendline breaks, it triggers panic sellers as the downtrend resumes another leg down. Just like the bull flag, the severity of the drop on the flagpole determines how strong the bear flag can be.
I use the RSI as momentum indicator. On a crossover with the 70 i'll sell and by a crossover the 30 i'll buy, if their is a flag pattern.
Keep in mind that this is just speculation!

NEO Bullish potential This is a speculation on what will happen with NEO. Mind that i don´t have a glass sphere where i can for see the future with.
The first thing i did was finding the resistance and support levels. I used the volume to identify them. I moved on seeking for a pattern i couldn't find a clear one. So i wrote down a line from top to top and from bottom to bottom. I think there is potential in NEO because. There is a buy signal in the MACD and the trend is increasing.
The D in the graph is for the distribution of GAS on binance.
best regards, Junktard

BTC potentials predictionThis is a speculation on what will happen with BTC. Mind that i don´t have a glass sphere where i can for see the future with.
I first drew the support(green) and the resistance(red)-lines. I found them using the volume indicator. The resistance line is drawn down on a point were high volume was met. For the support i used is the deepest point met in this time frame. The second thing i looked for was the chart pattern i found a symmetrical triangle in the trend. With lower tops and higher lows.
Why i think that the value will increase. The RSI is around 50 and came from a deep point so i can see an increase in RSI. If that increase will carry on, the trend will be going to meet a higher condition. There is also a buy signal in the MACD.
