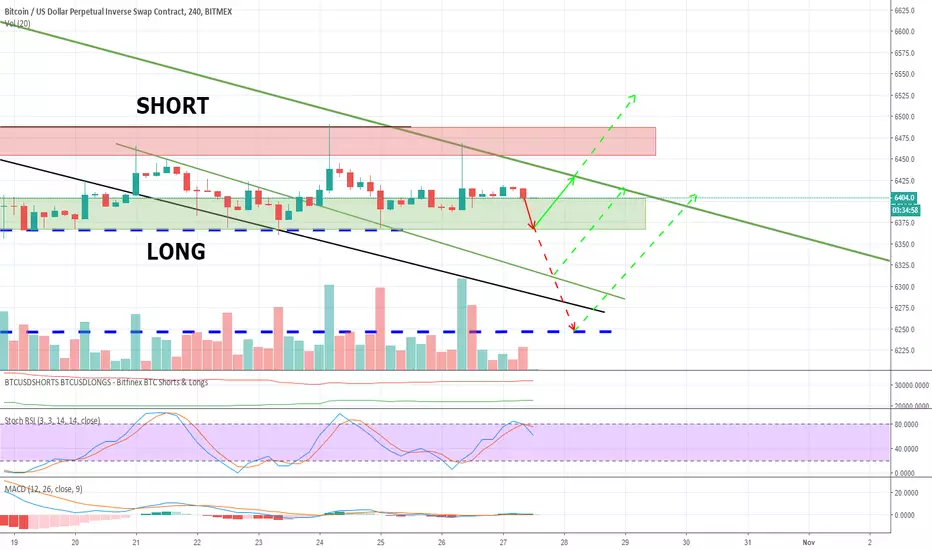
Is it the end of the flat? Daily bitcoin analytics 29.10Hello! Greetings from the traders Lemon Insiders team!
The price fell down with very good volume after flat.True, there are a few points saying that the flat can continue, or we will see a “Bart” near time.
1. Large volume jumped on the 1H bar of the fall, but at the same time the candle was closed higher than middle. It means that the strait was bought out and this was made well.
2. The second falling candle is already at a slightly smaller volume, but it is closed just below middle, while it has a large shadow and broke through strong support.
3. The fall didn't continue.If there were forces to shed the price, it would be done immediately, but here the MACD indicator will help us.
4. MACD shows the seller’s power is running out at 1H, the indicator begins to gradually turn to the bull side.
5. StochRSI is already in very strong oversold on 1H, 4H and smaller timeframes.
6. Longs has been taken on the fall. The crowd doesn't take longs in the decline, she took, as expected, shorts.This tells us it's advantageous for a large player to take long now.
All these factors tell us that the continuation of a strong fall is unprobably. Most likely, we will see lateral movements or the price will be slightly higher at the test levels of 6300-6320. In any case, it is still dangerous to take short, because we are already at the expected bottom.
Thank you for your attention!
TA

IBM - FREE MONEY!Dear Traders,
IBM has struck a deal to acquire cloud software company Red Hat for $34 billion.
IBM will pay $190 per share for the software company, which it described as the world’s leading provider of open source cloud software, a more than 60% premium to Red Hat’s closing stock price of $116.68 on Friday. Shares traded upwards of $175 in June, but disappointing earnings combined with a volatile market had seen the price drop sharply.
Here are the key points from the deal announcement:
IBM will acquire all of the issued and outstanding common shares of Red Hat for $190.00 per share in cash, representing a total enterprise value of approximately $34 billion.
JPMorgan advised IBM on the deal and provided most of the financing. Guggenheim Partners represented Red Hat on the deal.
IBM will remain committed to Red Hat’s open governance, open source contributions, participation in the open source community and development model, and fostering its widespread developer ecosystem.
IBM and Red Hat also will continue to build and enhance Red Hat partnerships, including those with major cloud providers, such as Amazon Web Services, Microsoft Azure, Google Cloud, Alibaba and more, in addition to the IBM Cloud.
Red Hat will join IBM’s Hybrid Cloud team as a distinct unit, preserving the independence and neutrality of Red Hat’s open source development heritage and commitment, current product portfolio and go-to-market strategy, and unique development culture.
Red Hat will continue to be led by Jim Whitehurst and Red Hat’s current management team. Jim Whitehurst also will join IBM’s senior management team and report to Ginni Rometty. IBM intends to maintain Red Hat’s headquarters, facilities, brands and practices.
“IBM will become the world’s #1 hybrid cloud provider, offering companies the only open cloud solution that will unlock the full value of the cloud for their businesses,” Ginni Rometty, IBM chairman and CEO, said.
“Joining forces with IBM will provide us with a greater level of scale, resources and capabilities to accelerate the impact of open source as the basis for digital transformation and bring Red Hat to an even wider audience – all while preserving our unique culture and unwavering commitment to open source innovation,” Jim Whitehurst, president and CEO of Red Hat, said.
Let's talk about TA now:
Weekly RSI is OVERSOLD !
Daily looks superrr zweeeeet! I see a possible divergence!
Hourly chart confirms my Bullish Divergence.
This is free money.
Key resistance points: 132$ - 145$

Bitcoin Daily Analisys 27.10Greeting you on our new idea.
Yesterday's idea remains valid. We are waiting for a small decline, after which will be growth.
Our past idea is attached below, there you can read more about our actions.
Thank you for your attention!
Bitcoin Daily Analysis 25.10Lemon Insiders team again welcomes you to our daily analytics.
For several days in a row, we have been trading scalping in the private channel. There are various reasons for this: indicators, repeated patterns for candles, graphic patterns, volume behavior.
As a result, we came to the conclusion that the whole flat in the area of 6365-6490 with rare exits higher/lower. We have designated zones where we open/close positions. Stops are on 20 points higher/lower areas.
So far we see only such an opportunity to extract at least some profit, since the market in the annoying flat and it is unclear how long it will continue, but we think this will end on the 26th.
In the meantime, we trade what the market gives. Thank you for your attention!

Bitcoin Daily Analisys 24.10Hello! Lemon Insiders stay in touch and we have prepared a new analytics.
T he last analysis didn’t go according to the plan, and it’s a sadly, but in it we were already in a profitable position, so we simply closed in breakeven.
Now we want to share our observations. The market has been walking flat for a long time, and each time it shows us the same movement, which can already be seen as a kind of pattern. The price goes up, the green candle leaves a good shadow, after which consolidation takes place for 1-12 hours and the price moves down. Similar situations are indicated by rectangles in the graph.
Also, this reduction supports the Stoch RSI.
We would like to draw your attention to the fact that the longs began to grow, which indicates that long has been accumulated by a large player, because the longs in the flat position do not grow if the crowd is trading. This is the first sign that we can get up from the flat, but this is in the more medium term.
We thank you for your attention!

Coinbase chart and two different attitudeI put two lines above the triangle:
Red line: if red line is our big triangle line we didn't cross that line but there is a argument in which we have only to point of contacts and one of them is last tether pump and the other one is far away in the past.
Blue one: this line has 5 point of contact and also it is more recently contacts. in this scenario we broke up this triangle.
so what?!
I think blue line is more significant but it may create this question in your mind that: "why we are confusing after breakout?" i think it's because of the fact that every trader put this line in different way and the pessimistic one's (obsessive traders!) always trying to put the lines in the way that they want. I mean you can move these line forever! this type of traders cant trade because they spend most of their time's to move the lines as price moves.
please leave a comment what you think about this.
TA for the mentally retarded: BTC to 40 million USD by 2020 !!!!I found it funny how many charts are published here on tradingview based on so called TA, calling for 1 million USD by 2020 and the like, hundreds of k at least, all within 2 years.
I found that so funny indeed, that I was embarassed to be only calling for 100-200k by 2021-2022, that I had to do my own super solid TA, based on.... hold on: LINES. Yes, LINES.
I drew 2 lines in the log chart, randomly connecting the 2011 and 2013 bubbles, and to my amazement, I found out, that this leads to 40 million USD by 2020. Genius !!! LINES IN THE LOG CHART !!!!
40 million USD by 2020 !!!! But wait, that's all? Only 40 million? So my stash is worth only a few hundred million USD? Are you kidding me? WE NEED MOAAARRRR !!!
But do not worry, for the TA is on our side, and the TA DOTH NOT LIE ! No, sir, it always tells the truth, and the mighty TA speaks: 10 billion USD in 2024 !!!!
Ahh, now that sounds better. Now we're talking !
You ever wanted to buy NASA and make them build the Saturn V again, but this time 100 of them? No problem ! You can do it in 2024 !!!
You every wanted to buy the country you live in and proclaim yourself emperor? No problem, just wait till 2024!
And all that CONFIRMED by super solid TA based on LINES in the log chart connecting peaks, THE PURE GENIUS BEHIND THIS ! THE LINES DO NOT LIE, THEY NEVER LIE !!!!
Especially not the ones connecting peaks XD

XRP/BTC LONG MIDTERM POSITIONDaily stochastics is pointing up
weekly stochastics is point down, not long term bullish,
XRP has potential for a midterm push up with the daily and 4hr stoch pointing up
ONLY IF BTC CAN HOLD ITS WEIGHT
Best entry would be around support line at 6625

Bitcoin Daily Analysis 17.10Hello, dear traders, subscribers and visitors of TradingView! The Lemon Insiders analysts team has prepared for you a fresh daily analytics, look!
We continue to move in the ascending channel at 1H and 4H. Today is the expiration of futures, which means that the graph can again draw a "helicopter". True, with each expiration, the chances for another takeaway become less as the manipulator notices that traders have already become able to earn on expiration and increased volatility, so he will draw new movements on the chart.
We are more inclined to the fact that the price of expiration can be lowered a little to 100-120 points maximum, after which the growth will go up to 6550-6600. The manipulator is unlikely to allow the crowd to fulfill its plans; it will be more profitable for him to close the already open shorts in the footsteps, and only then go down.
Thank you for your attention, subscribe, comment. Our team is ready to discuss the trading situation!

Bitcoin Daily Analysis 16.10Hello, TradingView readers and our subscribers! A team of traders and analysts Lemon Insiders has prepared for you a new bitcoin analytics.
Yesterday's our analysis played well and we, along with private subscribers, made good money.
What today?
The price has formed an upward channel in which we are smoothly moving. StochRSI below, which suggests that the price should go higher, which just fits into this channel. It is possible to repeat the test of support at 6350-6370, but from there more priority comes up for growong. Such a correction may occur to correct senior timeframes according to indicators.
Of course, probability of updating the bottom is possible, but it is now extremely unlikely, as FUD already started up, which shook the market, so it’s worth continuing to grow, at least, to a global downward trend, and from there you can make another strong correction with a possible bottom update. In addition, we expect price adjustments on the stock exchanges with USD and USDT and bitcoin prices, because the spread is now 200-400 dollars.
At the moment, we expect the campaign prices higher, below are placed purchase orders.

Bullish Cross On The Mayer MultipleThe Mayer Multiple has proven over time to be a relatively good signal to get back into cryptocurrencies, also based on BTC making higher highs, I feel now is a good time to buy a big chunk of bitcoin, if we do continue to go lower, which is possible I will hold onto my coins but be accumulating throughout next year. Although I do not feel we will go below 6,000 (Although I hope we do) but if we do I will be looking to buy another chunk of bitcoin at around 4k. My Target if we go to new highs would be around 360,000 in 2 -3 Years from now but I will be reevaluating my sells based on how fast or slow the market moves and other indications that may appear along the way.

Trading Success Methodology @crypot8020
~ Inspired by @GoldBug1 and @MarcPMarkets
In our weekly BTC chart, the lower green circle is showing the 100 day moving average. The upper green circle is the location of the 100 day moving average on the daily BTC chart.
Survival Tactics:
If you only have 10K to invest, risking the entire 10K and being reactive makes you weak. Putting $600 at risk and sticking to your plan makes you strong. In the near term, $600 dropping to $400 won’t shake you, but 10K going to 6K may. The way you sleep at night is a clue to if you’re a strong or weak trader!
If you want to be a strong trader, play like the strong do, not like the reactive herd of sheeple. Risk only what you are willing to lose, this will make you a stronger trader, and it is more important to be as strong trader than to act like one. Strong traders, no matter how small, make money. Those who act like strong traders, yet react with the herd, are acting like “Big Fish”. They typically become prey to lurking predators and lose money. We maintain our long positions and stay strong.
Do you think hedge funds are not praying that the herd of sheeple sell and trigger their buy orders? We have money eager to come into the market. We accumulate at these levels, and if price goes lower, we accumulate more. Why? Because we believe in the long-term, price will only go up, way up!!!
Human Behavior:
As a trader, it’s important to have a good perception of reality. You need to understand where you stand in the food chain to behave appropriately. Human behavior is a funny thing. We all see those sheeple that act big and bad, when in reality, they're weak. How can you tell? They act like a “Big Fish”, and speak of large trades, but they don’t have whale money.
It’s more important to realize where we stand in the food chain than trying to be perceived as a “Big Fish”. As the various seas of crypto markets get bigger, they’re attracting bigger predators. BTC is no longer under major suspect, it’s becoming more of an asset like digital gold. Endowment Fund predators have become attracted to the shift in sentiment and these large predators are now lurking in the deep crypto waters waiting for signs of weakness. They swim through the crypto market waters devouring all the “Big Fish” in small seas. If some are feeding in these crypto waters, there are most likley other predators, maybe bigger ones, lying in wait.
Killer Whales:
Killer whales hunt in packs. One whale is tasked with staying visible as the others lay in wait. You only see what they want you to see, a sell wall for instance. The school of fish won’t typically see what the whales don’t want you to see, like their hidden buy orders. The most important things are typically not apparent. The school of fish see a whale and panic, they start selling off or shorting their BTC.
Understanding how whales behave is more important than being a TA expert. Whales devour thousands of BTC for the long term, they need to eat lots of BTC holding fish to survive. The markets are not yet full of liquidity, and there is no central exchange, so BTC is spread out among numerous exchanges. Therefore, whales have to get creative and swim to various crypto market seas to accumulate BTC by devouring the weak BTC holding schools of fish.
BTC order books are full of small orders and then you see a big order for 100+ BTC at key buying levels. This is a sign that exchanges are creating order action in between real orders. In conditions of low liquidity and shallow trading, someone must create the action. Killer whales have to school all the “Big Fish” together and steer them into the kill zone so they can more easily fill their bellies with BTC holding fish.
Whales keep buying into weakness at good prices and HODL for the long-term. They don’t mind sitting on coins for years, this is what makes them so strong. Support has held strong above the 5800 level for some time now. If price drops lower, whales just dip into their bankroll and devour weak BTC holding fish.
The Strong:
Since we aren’t whales, we shouldn't try to behave like whales. If you want to be a strong trader, you have to hold strong and not be shaken out by fear of short-term loss. Take the emotional aspect out of investing and think long-term. The easiest way to do this is by only trading with what you are willing to lose.
Do you think whales care about BTC going to 4K? What makes them strong players is they’re not afraid of losing. Whales can still sleep at night if the market falls to 4k. Weak traders looking to make a killing fast experience portfolio erosion because they’re getting in and out of the market so frequently. They react emotionally during selloffs and sell-off blaming the whales for manipulating the market. We could care less about short-term losses, as we believe the market has nowhere to go but up. In the long-run, this is how real money is made, not by day trading for home runs.
What’s Next:
Was this a bear trap, or will we see BTC move lower? Those who hesitate, panic, or fall into FUD are just like a school of fish who see a whale and are steered directly into the kill zone to be devoured by the predators who are lying in wait.
Nothing has changed, we still continue to consolidate. Is there potential to move lower, yes, but who cares. We can still break out to the upside as well. Back up and look at the big picture, have a plan, stick to your plan, and don’t let the whales manipulate your actions, HODL strong, HODL long!!!
We're adding here, and we'll add more if BTC goes lower. Everyone is guessing, ignore the noise. The more time passes with BTC holding strong above $5800, the more likely it will break out to the upside.
Best!!!
@crypot8020
~ Inspired by @GoldBug1 and @MarcPMarkets

Bitcoin Daily Analysis 13.10Hello, dear subscribers and TradingView readers! Our traders team has prepared for you daily bitcoin technical analysis.
Yesterday we wrote that there is a chance of going both ways, but there was a small probability of falling. Now the situation is exactly the opposite - a small preponderance in the direction of growth, further I'll explain in detail.
During the night, we did not see a way out to one of the parties, which tells us that we are expanding the triangle, and the “bearish rectangle” has completely failed, so there are more chances to go up now. So far, only 2 points indicate a possible fall: 1) StochRSI at the top, 2) A divergence in price and volume has been detected. But these two points are simple enough to explain.
1 - We found a similar moment on September 8-10, when, after a sharp fall, a triangle was formed (the graph on the left), which is very similar to today (the graph on the right). Actually, at the end of the triangle in September, StochRSI was quite high, but at the same time the price still went up.
2 - We are moving in a triangle, and so in it, decrease in volume is normal, but it is not means we are moving to exit. In addition, exactly the same situation with the divergence was in September, but with that triangle, we went up perfectly.
In total. What we have listed above is not an exact long, these are just moments why the way up is now a little more probably, but the way down is also apparently. Therefore, if you don't want and are not accustomed to risk, then it is better not to enter the position.

Option A BTC/USD bearing idea Just idea of in which direction we shall break toward the next week or so in regards to the pressure building within the traingle, volume is currently very low , likely to see a decent momentum towards the bearish (A) or bullish (B) market soon enough...if we continue to descend from here will be interesting to see if support at 6488 holds , if it does we should see a bullish bounce to test the 6600 region once again... if support is broken at 6488 it is likely that we could go abit deeper down to the 6200 are or even lower..
#trading #crypto #bearish #bullish #bitmex #bitfinex #Binance #bittrex

BTC It's About That Time@Crypto8020
The BTC market has a well established higher low near the 6400 level, and it continues to show bullish signals. The longer it stays slugish, the greater the short squeeze will be. The herd is either bearish, or bored.
This is the sort of environment where great opportunities arise.
We are long. Its only a matter of time before the market breaks out. We‘re holding strong for short term targets, with an opptomistic eye on the long term.This is not the time to sell, BTC IS consolidating and establishing higher lows on multiple time frames. As long as the bullish trend line holds, the market is showing bias toward higher prices.
Action is low and the herd of sheeple are losing interest. This is a great sign. Remember, BTC consolidated for two years before it broke out and ran 20X last year at the end of 2017. Most sheeple were trolling negative comments and claiming BTC was dead. Week markets sell fast, this is not a week market. At any moment the market can be triggered by positive or negative news.When the breakout occurs, it will be dramatic. It will attract the reactive sheeple. The top of the herds reaction will be a good time to sell and wait for a retrace to rebuy.
A chart is human emotions on a graph. It is a representation of order flow. Human behavior and intentions can be identified in price patterns. Currently, what price is NOT DOING, is telling us a ton of information. The emotions of Fear and Greed drive prices in every market. Best!!!
@Crypto8020

Kalytera - Technical AnalysisDear Traders,
As we can see KALY is retracing, the idea is to find our next entry point.
Have a look at the green circle, that 50 fib level might be our point of interest.
About Kalytera Therapeutics
Kalytera Therapeutics, Inc. ("Kalytera") is pioneering the development of a next generation of cannabinoid therapeutics. Through its proven leadership, drug development expertise, and intellectual property portfolio, Kalytera seeks to establish a leading position in the development of novel cannabinoid medicines for a range of important unmet medical needs, with an initial focus on graft versus host disease (“GVHD”) .
Kalytera also intends to develop a new class of proprietary cannabidiol ("CBD") therapeutics. CBD is a versatile compound that has shown activity against a number of pharmacological targets. However, there are limitations associated with natural CBD, including its poor oral bioavailability. Kalytera will seek to develop innovative CBD formulations and prodrugs in an effort to overcome these limitations, and to target specific disease sites within the body. Kalytera intends to file composition of matter and method of use patents covering its novel inventions, with the goal of limiting future competition.
Website Home: kalytera.co
News and Insights: kalytera.co
Investors: kalytera.co


BTC - Ascending Broadening WedgeExpecting this pattern to break down after another test of the top trendline.

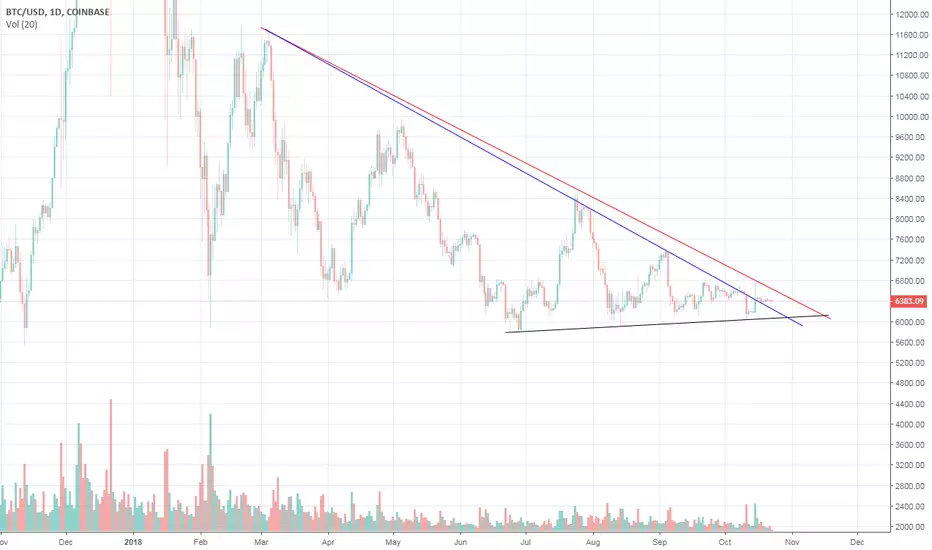
$BTC | The last "bear market" stance.There is plenty of context to understand what is happens.
If we break UP out of the descending triangle, we need to see a higher high than 8500 to become actually bullish, we could potentially go stagnant in between for months . . .
If we break DOWN out of the descending triangle this is what I am watching;
Bitcoin @ low 4k = 75 mil m.cap
Bitcoin @ 3k = 50 mil m.cap
Potential bounce zones are marked, I MIGHT even say we see a capitulation wick from 3k -> 1800.
1800 being my LPS. Period.
This analysis was post Pomp's podcast and a deep study into the history of Bitcoin.
These are my thoughts, cheers.

Bitcoin SHORTPlain and simple, this is a bart. If you do not know what a bart is then you are about to find out look up a pic of bart simpson and you'll know. CNBC even just went long, and if you are a seasoned BTC trader then you know that counter trading cnbc is a real thing that works 90% of the time. Lots of technical indicators are also diverging bearish and every time we try to bounce, we drop. Longs are also increasing after yesterdays massive fakeout and even bigger pump. I am short eth and xbt, double the profits or double the rekt. You heard it here first. I may post tmrw or saturday because i found a very incredible fractal that looks just like what is happening under our eyes.... I will be the first to admit if i am wrong or not. Happy trading, bluwhales all the way. :)))

ASML LONG! Now ASML has recovered a bit from the dip, it is moving upwards very fast. Here you see a TA until the potential resistance formed at 172 approximately. Go and take your profitssss!!

Euro movements on the watchEuro is on it's sideways movement. Good thing is that an opportunity to collect some bucks from this trades.
Something that have caught our eye is EurCad, on nice downward trend, this pair is seen trying to push it's way up to the last high of 1.5350/1.15400. Anything close to this zone may appear to be a good trade to risk.
