Tron (TRX) consolidatingHello This is simply to educate others.
Daily chart for TRX/ETH is consolidating.
- Macd has cross over to the down side on Daily chart.
- Stoch RSI is pointing down
- Based on Bollinger bands We can enter around 0.00009230 eth for a possible move up (ASSUMING there are bullish signs and the weekly chart isn't pointing down as well otherwise we will continue to go down if support doesnt hold)
Based on those we can expect more down side before any further movement up.
Worse case scenario I see Trx going down to 5 cents where it will be a good entry point for those looking to buy.
As a side note BTC has control over what happens with the all Alts so for now paying attention to how BTC behaves is a must before entering any trades.
I did not sell my coins im Holding until we move up again. Thank You for reading!
I will update the chart if i see any signal of positive later on.
Please like / follow / comment if you like my first post! :)
Please remember crypto is volatile and always invest only what you are willing to lose.
Buy at your own risk.
TA

Rising wedge = Decision timeCurrently in a rising wedge pattern. No trade zone for me until confirmation of a breakout upwards or leg down. looking more bearish than bullish to me. Bullish divergence on the 4hr rsi was broken and we continue to trend below it. a nice green candle above the high of 7560 will invalidate my bearish call and possibly proceed past 7600 if we breakout with enough volume.

Sitting on a major trend line right now. Sitting on a major trend line support/resistance level right now. Hopeful for a break back up to retest 7599 but set my stop accordingly. prepared for a hard dip but still hopeful we'll remain bullish. could be a turning point within this hour. 7520 will either as strong support or immediately be broken. looks to be a cup and handle forming.

about to break symmetrical triangle. twitter - @EyeOfCrypto1about to break symmetrical triangle on the 30 minute. a lot of bullish pressure to continue upwards. $$$

possible bounce on trend linepossibly another leg up to retest 7400 if we stay above this trend line. wicks shower higher lows but also may be forming a bearish flag on the 4hr.


TRXBTC update 29.05.2018TRX continue it`s correction ABC of Wave 1 in Wave 5. Must search for bullish divergence signs on MACD and RSI also increased volumes to confirm beginning of wave 3.

Bitcoin correction probably endingBitcoin has been long on the downtrend. As you can see from the chart bottom should be at 7 000$ but we need to break at least 10 000$ to be sure that the downtrend is over. Next 50 days will show if we are going to see new highs on near-term. If we break 7 000$ we have supports at 6 500$ and 6 000$. Daily RSI is also approaching 20 and is on our side.
If we can get 20 likes I will continue to update this regularly

CVC/BTC Binance Listing TA Hi Everyone,
As you've all heared, Civic got listed on Binance today, which created a nice 24% hike after the news about the listing broke out.
Just for you're info, Binance opened trading for CVC/BNB, CVC/BTC and CVC/ETH trading pairs on 28th May at 09:00 AM UTC.
What is Civic CVC/BTC?
Civic is a personal identity verification protocol that leverages distributed ledger technology to better manage digital identities. As with blockchain projects focusing on supply chain management for consumer products, Civic envisions a safer, cheaper, more efficient identity verification method for individuals and industries around the globe.
Imagine how many times you’ve had to go through a Know Your Customer (KYC) verification process. Whenever you apply for a new job, open a bank account, or participate in an I.C.O, you have to submit proof of identity and wait for it to be verified. Depending on the service, this could take days or weeks, as organizations have to spend the time and resources authenticating this information with outdated systems.
Civic is offering a new-age solution to this problem, one where a single input of your personal identity information allows any organization or service to cross-check it on the blockchain without asking you to provide the same data twice–personal identity verification that is transferable from one service to another.
How it Works?
Civic’s network accommodates three different–but interdependent–individuals/entities: users, validators, and service providers. The users are anyone who wishes to use the protocol to register an identity, and Civic makes this easy and safe with its Secure Identity app.
Validators are responsible for verifying an identity’s authenticity on the blockchain’s distributed ledger. They can then sell this information to service providers who need to verify their customer’s identities, exchanging the data for CVC. Civic is built on the Ethereum blockchain and uses smart contracts to oversee data attestation and payout for this work.
Want to learn more about this amazing project ? Check out the link coincentral.com
Technical Analysis Time !
As you can see a huge spike towards the 6k satoshi was created by the listing (on Binance), and as a trader I always try to catch the bottom of the correction which usually happens after a coin get's listed.
The best thing to do is to wait and be patient.
I opened my Charts and checked out the 5min frame of CVC/BTC and after waiting a bit you finally start to see the RSI level taking shape. I followed that RSI signal until it hits the oversold point (usually starts when it hits under 30).
When that occured, a bought my self a nice bag of CVC/BTC at 4400sats. In other words, Jackpot.
The buy vol started to kick we mooned.
Please use this TA as a start for you to see where the resistances are located, so i might help you making some nice gains !
As you can see the Stoch RSI just crossed upwards, which means we are going to see another room very soon.
MACD is still not showing any good signal, just because the listing happened today. Tomorrow we will be able to see more in this 15min chart.
I hope this can help you, as it helped me making a nice profit today on this listing.
Keep in mind that this coin is an amazing investment, its being listed on the last large exchange, they are already listed on so many good exchanges that have lots of volume, this coin will only grow more.
Thank you for reading this !
Donc forget to hit the like button if you learned/enjoy !
Raw_Blits out.

Long Term View of BTC I am bullish here with BTC in the low 7k range. Volume has dried up to almost nothing, indicating a big move is coming. Daily RSI is approaching oversold. Beginning to see bullish divergence in the 4H RSI.
Looking at where BTC has come from and where it is now, the run to 20k pales in comparison to the previous tops at $260 and $1,160.
For people expecting BTC to drop below 4k, keep in mind that it would need to break a trend line that has held for 2,365 days.. and counting.

Just tracking my ideas on BTC/USDThis is my overall idea for Elliot's wave theory in regards to our current position on BTC to-date. This is my first time publishing and do not consider myself an expert in the theory (or crypto for that matter) nor do I consider this the correct method used to analyse with Elliot's wave. I use the theory simply as a guide based on previous movements to point me in directions I think Ellits wave will predict BTC is headed and then use other indicators to extrapolate/predict where I think the price will reach - with no accuracy intended.
Take my TA with a grain of salt, as always, this is not financial advise in any shape or form, always do your own research and never take advice from someone who is not an expert. This is just a hobby for me and any feedback would be appreciated!

EURGBP | Ranging, breakout zoneVolatility is currently low within EURGBP and we've seen the price ranging for some time now. We should witness a bearish breakout should fundamentals and reports back it up.
If Bollinger bounce occurs, we will see price go bullish up to the 0.87900 region.

GiverOfTheDKeep in mind that btc is very unpredictable, just sharing ideas.
The 6th idea was not mine!

2018 Monthy Momentum Triple BottomChart says it all. What happens after the triple bottom will be very telling as to what kind of second half of the year we are going to have. Hold on to your hats.

BCN - Bull Pennant / Strong FA - BUY SIGNAL Bull pennant formed, breakout pending. Resting on strong historic support. Strong fundamentals - roadmap update, hard fork and testnet all due before the 10th of July.
BCN
BUY: 100-110
SELL:
118
130
148
200
Stop loss:
190
Here is a look at the historic support -

LTC Price MovementI’m just playing around with different scenarios! Market is what it is and it’s the weekend, so I’m setting up buying opps. Unless we really tank to 2018 lows, this will be my last big buy. I’ll sit back and watch what happens. Of course I’ll chip away here and there, but I will not be focused on day to day price movement!

CADJPY | Possible entry for SHORT @ 86.00SHORT setup for the Canadian and Yen pair. Economic reports suggest that the Yen may gain strength over the Canadian Dollar later today. If so, this will support the TA suggesting a ranging pair moving downwards.
Wait for a good entry point! Confirm that price is not breaking out of the channel. Best entry would be to call a fakeout early.

BTC/USD Technical analysis May 18th A lot of people are watching the bitcoin chart right now. Its also very "nice" to look at with very nice technicals .
Here are my reasons for me to watch it :
- 3 impulsive waves
-Valid Trendline ( 3 touches )
- Nearing 7.8k support
Important to know : Right now we have no bullish entries the key area to watch is 7.8k.
We have to see what happens there.
For now thats all if anything new happens ill keep you updated if you want more just watch the video ! :)

The Fiber | Downtrend finally bending?After weeks of power from the US bulls, it seems that they're finally running out of steam.
Could we now be witnessing the turn of the bearish trend? Or do the US-backers still have some strength left in them for one final push down to the 1.17000 support line?

LOOM/BTC TriangleLOOM/BTC is looking triggered af.
It's entire existence on Binance has resulted in a symmetrical triangle.
A break at the apex with an entry at 62 sats with a 20% price target would be ideal.

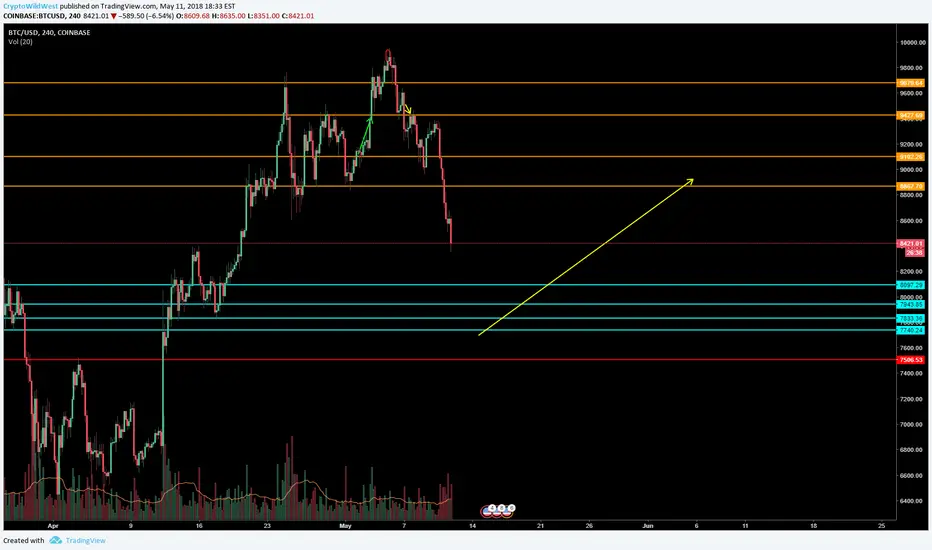
Storm Brewing Before a Bullish Catalyst Consensus 2018. A catalyst filled with rumors, hype, news, and demand. Sideliners fill finally pull the trigger, word will spread, there is no stopping the cryptocurrency train. We actually had tons of strong news about Crypto and Bitcoin lately that is bullish.
I will be looking for price action buy signals near my blue horizontals. Will ride the trend up to my orange lines and see if we can break that 10k barrier.
Trade will be nullified if we break the lower 7000s and ruin the bullish bias from April.
Hang tight and lets see where this year will take us.
BLZ/BTC Strong Uptrend and BUY opportunity!Always look BUY opportunity when You have uptrend and always look sell opportunity when You are in a downtrend (more to forex then crypto but still..)
At the moment fundamentally strong coin BLZ/BTC shows us good BUY opportunity:
1. Strong channel upwards
2. Resistance becomes a support
3. Supported with 100EMA
4. Possible W formation (double bottom) chart pattern on a trendline
Good Luck!
