Observations on Technical Verses Fundamental Analysis:Trend Following and Growth Investing
In Technical Analysis (TA), trend following is the equivalent of growth investing in Fundamental Analysis (FA). Further, in TA, mean reversion analysis ("overbought" and "oversold") is the equivalent of valuation ("overvalued" & "undervalued") in FA.
In both trend following and growth investing, the focus is on finding the best trends (price in TA, revenues in FA), without regard to "value". Therefore, a trend follower will hold onto a trending stock, regardless of how "overbought" it gets, much like a growth investor will hold onto a growth stock, regardless of how "overvalued" it gets. Conversely, a mean reversion investor will buy stocks that are very "oversold" relative to some anchor, such as the 200-day average or 52-week high, regardless of the direction of the trend, while a value manager will buy stocks that are "undervalued" relative to some anchor, such as earnings or book value, regardless of current fundamental performance. In other words, both mean reversion and value investors are making the case that the trends (price or earnings) have simply gone too far and are unjustified. Understandably, we can see why trend following and mean reversion don't "work" at the same time, just as growth and value don't "work" at the same time.
In the end, the line in the sand between TA and FA is ego. A pure TA investor accepts the verdict of the market in terms of what it deems fundamentally "attractive" visa vie the existence of either a positive price trend in a timeframe that is driven by fundamental trends (as opposed to short term trends and noise) or a magnitude of "oversold" momentum that overlaps with historical valuation measures. A FA investor, on the other hand, invests perhaps hundreds of hours developing a personal opinion of what is "attractive", and often finds him/herself at odds with the market's verdict. Since we can never make money until the market agrees with us, we can see then how a more holistic investor who has the wisdom to unite the strengths of trend following with growth investing (or mean reversion with value investing) is better off than those who use only one of those inputs.
By leaning on trend, a growth investor will know when the market agrees with his/her painstakingly curated fundamental view, particularly when things are changing, most importantly from good to bad. Behavioral bias may prevent a growth investor from seeing the change in fundamentals that is being depicted by the change in price trend. Indeed, it is in this very moment (former highflying, expensive growth stock that breaks price trend in a meaningful timeframe) when "overbought and overvalued" conditions finally start to matter.
David Lundgren, CMT CFA
Chief Market Strategist
Co-Host "Fill the Gap" podcast
Shared content and posted charts are intended to be used for informational and educational purposes only. The CMT Association does not offer, and this information shall not be understood or construed as, financial advice or investment recommendations. The information provided is not a substitute for advice from an investment professional. The CMT Association does not accept liability for any financial loss or damage our audience may incur.
TA

Bitcoin leci na 12 k USD | Bitcoin is going to 12k USDWszystko wskazuje na to, że jednak nie zaliczyliśmy jeszcze dołka. Dołek dopiero na 12k imo

ETHEREUM Hit the TOP of Wedge!Alright so I was right and I was wrong
Right -
Nosterdamus type call here :)
Wrong -
However I did say we need to breakdown - bears needed followthru which they didnt get. Bulls held on, made it a support.
Then CPI numbers came in and pumped the whole market, SP500, NASDAQ, and BTC.
Anyway, now I am just a making note to myself that this is definitely the time for waiting. No Swing bull entries as we have hit
- the rising wedge resistance on 4HR
- hit double top at ~1920
- Weekly Resistance of this area goes back to Feb, March, May, June, July 2021 as well as recently May-June of 2022 - Lots of action - RS area
- Weekly RSI trendline resistance!
- Weekly 21 EMA resistance!
- Weekly 0382 Fibs retracement! - dead cat bounce territory
- 2k psychological resistance level
Jeez as i stack up all these resistances, the shorting opportunity seems to be amazing. Too bad I do not short as a rule. But this is where heaps and heaps of shorters will be opening up their positions. Including big money that move the markets. So going long here is suicide for the bankroll. Unless of course a HUUUUUGE amount of bull volume comes in and smashes everything. We should be setting a Weekly Lower high.
For me I may do some short term, 5 minute chart flips, like maybe buying a first 5min, 15min, 1HR OS bounces. but that's it. This is time for waiting and at least looking for Daily Higher Low to form - anywhere above 1650.
I will also put a small buy at ~1590 level as it has some nice support there for a swing trade for now.
GL everyone,
Protect your bankrolls

ETH breaking down!!!???Bulls have to hold here or we going lower as we
- break the uptrendline on 4HR - This Up trendline has been holding for 28 DAYS so its a notable breakdown.
- Also Triangle on D RSI is being tested and bulls need to hold. Otherwise it is bearish divergence that is playing out starting from 22 days ago
Some may say this is a great entry point as we are at the support, but not for me. We are too far at the end of the rising wedge and a break can happen at any moment.
As a Rule I do not buy support when the structure is close to it's end because the breakdown can be very violent.
Right now we are oversold on the 1HR so we may go sideways for a bit to cool off the RSI
I dont short, so I will just wait this one out.
WE did hit 1800 which is in a congested area / resistance from before.
ETH has some drama with the merge/fork coming up next month approx. 16th September. The question is will we pump or dump in the expectation.
Pump because:
a) The POS merge will make inflation of ETH like 4-8 times less - huge cut (BTC halvening always result in bull markets)
Dump because:
a) The staked ethereum can finally be unlocked and sold on the market
4HR PIC may be better for view s3.tradingview.com
GL. Stay safe and protect your bankroll

QNT USdt great risk reward shortthis is a great risk reward situation.
i will enter a short here at 129$
and i'm lookg for a take profit at 14.2$
that is a 11.5% and will use 3x leverage.
on the other hand,if a 4hour candle closes above 131.2$ i will cut losses and that is a 1.6% risk.
techincal supports it and qnt needs a small pullback.
for a safer bet you can take some profit at 120.3

BTC Saturday Analysis Over this week BTCUSDTPERP showed us it is ready to test higher levels.
Uptrend A reveals a clear definition of price increase on the daily chart followed by uptrend B that was created two days ago by supporting a daily level, this latter movement is a strong indicator BTCUSDTPERP is getting Bids even if we have yet to test lower levels like $18600.
The market created uptrend C confirming that the support created before in uptrend B was strong indicator of BTCUSDTPERP pushing to break its current range. This uptrend C was created as a support and if it stabilizes this could mean a push and towards the polarity zone and breakout.
The polarity zone kept getting tested over these last few days and with its confirmed uptrend A .
Downtrend D is a very strong and resilient level that if the market is able to push and break this level in conjunction of breaking the polarity zone we will see targets up top get tested fueled by a breakout.

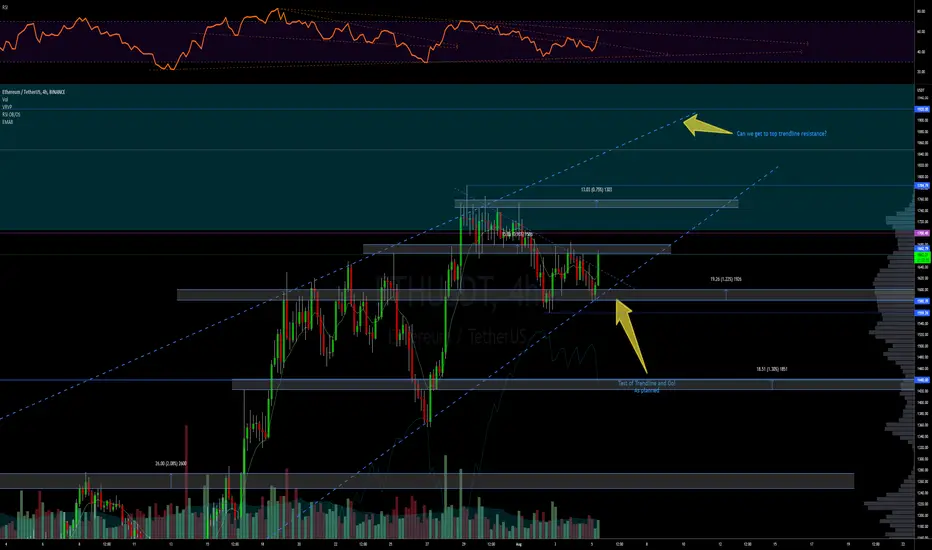
ETH - we got what we wanted, nowOk so we got our entry. I have a small position that I took because i was in bed, going to sleep so I took the position on my phone.
Now lets see if we can get to the top trendline resistance of about 1800.
We got 2 resistance zones to punch thru as shown on the chart with the rectangular boxes.
So far the double bottom on 1 HR and the bull volume off it looks good.
Lets see how it plays out.
Needs a cool off at least on the smaller time frames as it entered the first resistance box.
Target 1800. Lets go
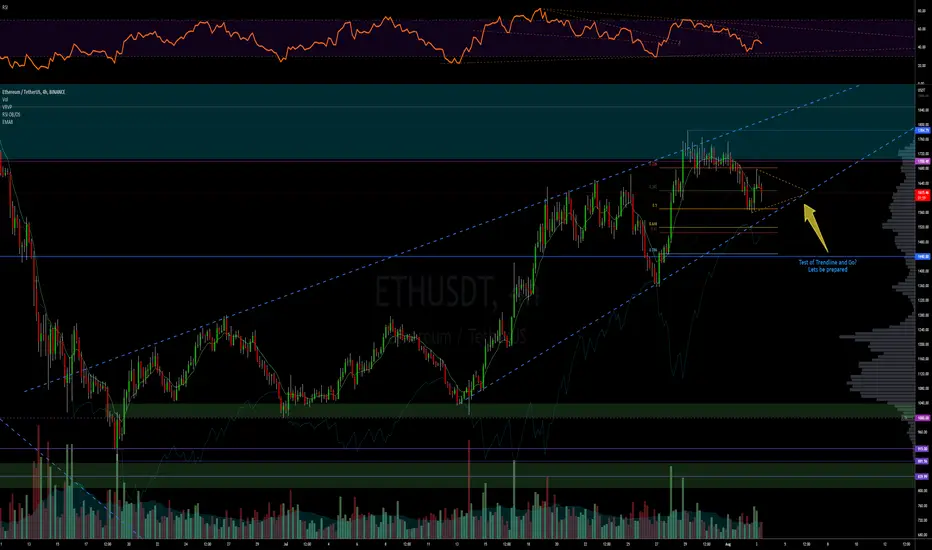
ETH possible trade coming upWe want to retry the trade few hours ago that didnt happen due to Pelosi mini pump
Rising wedge support trendline on 4HR with top resistance at about 1900. Could give us 15-20% trade.
Test of trendline
+
0.5 Fibs
+
Consolidation sideways- expected
+
4HR RSI support trendline test
Bulls looking to maintain D higher lows uptrend.
We are wrong if we breakdown the trendline with volume and continue lower. Likely to retest 1400 levels
So if we get in (scale in), put a stoploss and take the profits on the way up for protection.
Plan for the unexpected. Plan for being wrong.
ETH dip buy on 1 HRfalling wedge support on Daily
+
0618 GP on 1HR FIBS
+
4HR OS + 1 HR OS
+
4HR RS Zone
If we get there, we are likely to have at least a short term bounce on the hourly/15min.
IF we dont get there, oh well.

LONG SOL if you can find entrySorry I tried to post this when I started this trade. It is too late unless you want to wait for a pullback an attempt entry. This is looking good but have already taken some profits because I don't trust these markets. Again, sorry for being to late I got pulled away before I could post this. Still maybe you can find a safe entry but be very careful please. In this market you never know could come back to entry to try to stop out trades or pickup liquidity.
-NFA
quickly done, rough but idea is there.

Shorting DG I opened a short position in DG this morning and am sharing my basic plan. To me this seems obvious. DG is a value store though and if this is truly a recession, which I am not convinced of, would be the only reason this trade fails. Like anything manage risk but this seems obvious to me. Am adding more if it goes higher. Use SL you feel comfortable with. Just give it some room though. This is in serious need of correction.
Sorry this is a bit rushed but wanted to get it out as fast as possible.

Missing clear indications with current formationsThis chart reveals a simple yet very risk-free strategy to long BTCUSDTPERP
Currently there is one spot that offers the best view of the show and that is around 19200~19300. With a tight stop-loss we can take the risk and hopefully confirm the accumulation cycle.
This TradingVIew idea is being made public so I can callback in the future. This should not be seen as financial advice.

sos reversal if 2700 hold we will push upward
all depend on btc
but a interesting trade possible breakout fom a bullish wedge
and oversold rsi

$TSLA Analysis, Key Levels, and Targets - REQUEST$TSLA Analysis, Key Levels, and Targets
I just want to say that I do not trade TSLA. This is for my good friend @rock1986
MacD is one of the best momentum indicators… and on the weekly timeframe it does not support a move above the W35EMA. Not yet. I’m not saying that it can’t, but it’s not likely.
LOL… @rock1986… I hope that at this point, you’ve followed my charts long enough that I hope you know what I’m saying without the need for me to explain….
Lots of targets for you, and for me as well…. If you have any questions let me know… the addition of the bear flag was your idea… (and it would justify target 3)
—-
I am not your financial advisor. Watch my setups first before you jump in… My trade set ups work very well and they are for my personal reference and if you decide to trade them you do so at your own risk. I will gladly answer questions to the best of my knowledge but ultimately the risk is on you. I will update targets as needed.
GL and happy trading.
IF you need anything analyzed Technically just comment with the Ticker and I’ll do it as soon as possible…

possible bitcoin targetssome possible bitcoin outcomes we have broken above the bear flag (depending on how you draw it I think It looks pretty clear on the 8hr) and the 200 week and currently holding them both as support. these are just my opinions so we will just have to wait and see what happens i suppose :) enjoy the lines

BTC - Technical AnalysisDo Kwon Says He’s No Fraudster and Has ‘Great Confidence’ in Terra 2.0
“I made confident bets and made confident statements on behalf of UST because I believed in its resilience and its value proposition. I’ve since lost these bets, but my actions 100% match my words. There is a difference between failing and running a fraud.”

AMR, Strong bearish candle below 143 triggers a safe short entryAMR MAY offer a fresh chance for opening a short position !
Stock has recently lost 50 day moving average which now acts as strong resistance . Stock struggled 4 days to take this previous support back and was not successful at all .
AMR also, lost the last low ( marked by arrow ) which is a sign of trend reversal . In addition, It has completed the pull back to both lost low ( related resistance has been shown as a horizontal red line) and 50 days moving average.
Only remaining condition for opening a safe short position is a strong bearish candle below the cluster of candles shown by a circle.
Stop loss can be a bullish candle above mentioned cluster and 50 days moving average.
First target is around 104 and second target is around 70 therefore Reward/Risk ratio is extremely high .
I myself took higher risk and already opened a short position by using Elliott waves in Hourly time frame which can be reasonable considering market condition and sentiment however, more safe entry condition is explained above.
Hope this to be useful and wish you huge profits.

Simple Eth bearish TAEth downside target. -30% $700 area. Any move to the downside with BTC will confirm this overall direction.

My new Bitcoin review Just going through for my own research on the nearest Bitcoin trends before maybe more crash I hope my ideas help others to see through

Simple bearish BTC outlookBearish pennant on BTC. Measured move to downside, 14k ish area. Rev stoch rsi showing curve to downside with another daily close below 20k.

COSTCostco is one i've been watching. The close before the long weekend was ideal if you entered short once again underneath this yellow trendline.
An overshoot to 508-510 is still possibly in play and that's where i'd be looking to start a longer dated short position or even sell out of the position if we get to that target.
Costco is a very strong company don't get it wrong. This is a stock i'd buy in my retirement account at nearly all support lvls below 480.

BTC / USDT 4H Update Btc rejected from supply and dumped below 20K
20-19.5K is strong support, IF hold BTC will Pump
4hr close below 19.5K, we can expect 18,300 - 16,700 Target
ST/MT Market still bearish so not buying anything, if support break i'll open short at 20,300-21,200,
Target same & 23,100 Invalidation!
#dyor

Simple Monthly AMC TASimple monthly AMC TA. Parabolic descending curves show duplicating pattern. Second curve pattern being compressed shorter in time. MACD giving insight more time needed. But, Rev stoch RSI showing insane bottom forming with massive historical bounce. Patience.
