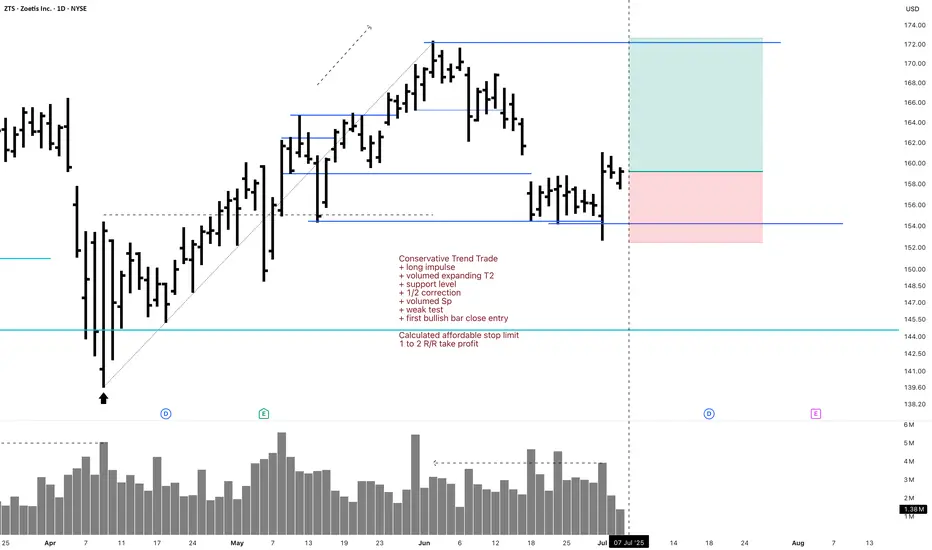
ZTS Investment 1D Long Conservative Trend TradeConservative Trend Trade
+ long impulse
+ volumed expanding T2
+ support level
+ 1/2 correction
+ volumed Sp
+ weak test
+ first bullish bar close entry
Calculated affordable stop limit
1 to 2 R/R take profit
Monthly trend
"+ long impulse
+ ICE level
+ support level
+ 1/2 correction
+ volumed 2Sp
+ weak test?"
Yearly trend
"+ long impulse
- correction"
Takeprofit
ZTS 1D Investment Conservative Trend TradeConservative Trend Trade
+ long impulse
+ volumed expanding T2
+ support level
+ 1/2 correction
+ volumed Sp
+ weak test
+ first bullish bar close entry
Calculated affordable stop limit
1 to 2 R/R take profit
Monthly Trend
"+ long impulse
+ T2 level
+ support level"
Yearly Trend
"+ long impulse
- correction"

F Investment 1D Conservative CounterTrend TradeConservative CounterTrend Trade
+ long impulse
- before 1/2 correction
+ expanding T2
+ support level
+ biggest volume 2Sp-
+ weak test
+ first bullish bar close entry
Calculated affordable stop limit
1 to 2 R/R take profit
Monthly CounterTrend
"- short impulse
+ 1/2 correction
- unvolumed T2
- resistance level
+ unvolumed interaction bar"
Yearly Trend
"+ long impulse
+ volumed T2 level
+ volumed 2Sp+
+ 1/2 correction
+ weak test"

Profit taking on Netflix for the summer, only to buy in lowerNASDAQ:NFLX is still in a strong high time frame uptrend, I'm not saying the stock has turned bearish overall, however profits need to be taken when trading and this is one of those times.
I'd prefer to buy back in closer to $1,000 if possible though either way I'll keep 33% of my stack.

Aggressive Trend Trade 1HAggressive Trend Trade 1H
- short trend
+ volumed T1
+ support level
+ biggest volume 2Sp+
Daily Trend
+ long impulse
+ T2 level
+ support level
+ 1/2 correction"
Monthly CounterTrend
"- short balance
+ expanding ICE
+ support level
+ unsuccessful biggest volume manipulation"
Yearly Trend
"+ long impulse
+ 1/2 correction
- below exhaustion volume?
- below SOS"
Will add more when 5M, 1H or 1D will show entry point

AUDUSD trade has hit Take ProfitThe AUDUSD trade I shared earlier has just hit TP at 0.6487. This will be my first and last trade for today. As I mentioned, today and this week are quite heavy in terms of news, so I’ll be trading less. Wishing everyone a profitable day — manage your risk wisely.

PLUG 1D Investment Long Aggressive Trend TradeAggressive Trend Trade
- short impulse
+ volumed TE / T1 level
+ support level
+ biggest volume 2Sp-
+ weak test
+ first buying bar close level
Calculated affordable stop limit
1 to 2 R/R take profit
Monthly Trend
"+ long impulse
+ support level
+ T2 level
+ biggest volume reaction bar
= below 1/2 correction"
Yearly CounterTrend
- short impulse

PLUG 1H Long Swing Conservative Trend TradeConservative Trend Trade
+ long impulse
+ 1/2 correction
+ volume zone
- strong approach
+ ICE level
+ support level
+ volumed Sp
Calculated affordable stop limit
1 to 2 R/R take profit
Daily Trend
"- short impulse
+ volumed TE / T1 level
+ support level
+ biggest volume 2Sp-
+ weak test"
Monthly Trend
"+ long impulse
+ support level
+ T2 level
+ biggest volume reaction bar
= below 1/2 correction"
Yearly CounterTrend
- short impulse
Will add more after successful test on 1H and / or after test completes on 1D.

USD-JPY Free Signal For Monday! Buy!
Hello,Traders!
USD-JPY is about to retest
A horizontal support level
Around 142.000 and after
The retest on Monday we
Will be able to go long on
The pair with the Take
Profit of 143.331 and the
Stop Loss of 141.939
Buy!
Comment and subscribe to help us grow!
Check out other forecasts below too!
Disclosure: I am part of Trade Nation's Influencer program and receive a monthly fee for using their TradingView charts in my analysis.

AUD-USD Free Signal For Monday! Sell!
Hello,Traders!
AUD-USD keep growing in
An uptrend an we are bullish
Biased mid-term, however
The pair is locally overbought
So after the pair enters the
Resistance area around 0.6510
On Monday we will be able
To go short on the pair
With the Take Profit of 0.6480
And the Stop Loss of 0.6516
Sell!
Comment and subscribe to help us grow!
Check out other forecasts below too!
Disclosure: I am part of Trade Nation's Influencer program and receive a monthly fee for using their TradingView charts in my analysis.

GBPJPY Take Profit Hit!Dear traders, we had a real sniper entry today. As soon as the trade was executed, price began to drop immediately—allowing us to secure profits at both 1:1.5 and 1:2 Risk-to-Reward levels. Clean execution, clean result.
This was my first and last trade of the day.
See you again tomorrow with new opportunities!

BTCUSDT hit take profit.Although the trade took a bit longer to play out, as always, BTC delivered solid profits. This will be my first and last trade of the day.
I'll be back to share new opportunities tomorrow if the market presents them, traders.
Wishing you all profitable days — much love to each of you! 🙂

NZD-JPY Free Signal! Sell!
Hello,Traders!
NZD-JPY gapped up on
The week's open and went
Further up, following other
Yen pairs, however, the upward
Move here was way less powerful
Than on the others and after the
Retest of the horizontal resistance
Of 87.2570 we are seeing significant
Weakness so we are assuming a
Correction is coming which means
We can enter a short trade with
The Take Profit of 86.399 and
The Stop Loss of 87.436
Sell!
Comment and subscribe to help us grow!
Check out other forecasts below too!
Disclosure: I am part of Trade Nation's Influencer program and receive a monthly fee for using their TradingView charts in my analysis.

GBP-JPY Free Signal! Sell!
Hello,Traders!
GBP-JPY is trading in an
Uptrend and the pair is once
Again about to retest a horizontal
Resistance level of 193.665
So despite our bullish bias
We will enter a local short trade
On Monday with the Take Profit
Of 192.946 and the Stop Loss
Of 193.799 which is slightly
Above the upper bound of
The wide supply area
Sell!
Comment and subscribe to help us grow!
Check out other forecasts below too!
Disclosure: I am part of Trade Nation's Influencer program and receive a monthly fee for using their TradingView charts in my analysis.

EUR-USD Free Signal! Sell!
Hello,Traders!
EUR-USD broke the horizontal
Level of 1.1300 which is now
A resistance and went down
So the breakout is confirmed
And now the pair is retesting
The resistance so as we are
Bearish biased we will be
Able to to enter a short trade
On Monday with the Take
Profit of 1.1197 and the
Stop Loss of 1.1311
Sell!
Comment and subscribe to help us grow!
Check out other forecasts below too!
Disclosure: I am part of Trade Nation's Influencer program and receive a monthly fee for using their TradingView charts in my analysis.

US30: Local Bearish Bias! Short!
My dear friends,
Today we will analyse US30 together☺️
The market is at an inflection zone and price has now reached an area around 41,170 where previous reversals or breakouts have occurred. And a price reaction that we are seeing on multiple timeframes here could signal the next move down so we can enter on confirmation, and target the next key level of 41,039..Stop-loss is recommended beyond the inflection zone.
❤️Sending you lots of Love and Hugs❤️

BTCUSDT Take ProfitThe BTCUSDT trade I shared a few hours ago closed in profit. Those who wanted could have set the TP at a 1:2 Risk-to-Reward Ratio as well. I entered the trade with a sniper entry. 🎯📈

XAUUSD Take ProfitThe gold trade I shared a few hours ago has hit Take Profit at the RRR 1:2 level. This was the second TP level.
For those who wish, you can hold the trade until the TP level at 3206.35.
If the price approaches this level, don’t forget to move your SL to the entry point.
Wishing everyone a pleasant end to the day.
🔔 I post detailed trade ideas and daily market analysis like this every day on my TradingView profile.
👉 Follow me to get notified and read the full breakdowns.

EURUSD Take ProfitEURUSD moved into profit zone very quickly. Most likely, you won’t be able to catch this trade :( I’ll be sharing new setups throughout the day.

EURJPY hit TP within 16 minutes.Yes! I love the EUR :) The signal I shared just moments ago has reached Take Profit. You can still wait for the other TP levels to be hit. That’s enough for today.
🔔 I post detailed trade ideas and daily market analysis like this every day on my TradingView profile.
👉 Follow me to get notified and read the full breakdowns.

EURUSD hit Take Profit within just 15 minutes.As always, EURUSD knows how to surprise us :) Yes, the trade reached our TP precisely at a 1:1.50 RRR, then immediately spiked upward. That’s the FX market — the faster you exit with profits, the better!
🔔 I post detailed trade ideas and daily market analysis like this every day on my TradingView profile.
👉 Follow me to get notified and read the full breakdowns.

AUDCHF Take Profit. Yes, once again we caught the right trade with the right analysis, and this marks our second TP of the day — closing the day in profit.
If you like my trades, feel free to follow me.
🔔 I post detailed trade ideas and daily market analysis like this every day on my TradingView profile.
👉 Follow me to get notified and read the full breakdowns.

The EURUSD trade hit TP just 4 minutes after I shared it!Yes, ladies and gentlemen — volume never lies.
The RRR 1:1.50 setup I posted just minutes ago delivered solid profits in no time.
Congrats to everyone who took the trade!
📈 If you find these setups helpful, make sure to follow me on TradingView for daily insights and signals.
