NVDA BAT CompletionEver wonder why NVDA bounced??
BAT Pattern Completion.. Take Profit mode in progress..
ENJOY!!!!!!!!
Takeprofit

My entry for SHORT on BTC! Double BOTTOM? ⬇️💲💲💲Hello everyone,
I present my today's entry SHORT with leverage on BTC.
Leaving the flag with the bottom is a signal for me to take a short position.
I put a stoploss on the last short term hill.
I divided the profits on the lines I found, which may be resistance.
On the way to the second TP, I will shift STOP LOSS in place of the $ 37777 entry.
I predict a rebound from the trend line. It shows the way for the bears from the last ATH.
The moment when the chart hits it, may push the price to the last low or even lower.
You want more ?
Comment and like,
Greetings


USDJPYIt broke the resistance on the down side. i marked 3 take profits that might hit on the way down its the green lines FX:USDJPY

GoldViewFX - Update on all TARGETS$All 3 ideas posted this week have hit target.
Not much to explain on this post, as the charts speak for themselves. Daily chart looked like 1818 was going to hold with EMA5 taking a turn, however no lock, as the current days candle has pushed ema5 across. We had a target of 1836 on the daily chart, which was HIT.
1Hour chart
All TARGET$$ HIT
3Hour chart
ALL TARGET$$ HIT
Although all our analysis and targets have all played out perfectly and we have been buying dips successfully, as per all our plans posted (see related posts below), we still had a sell signal activate. One of them which HIT SL. We are comfortable in sharing everything we do transparently. That includes the WINS and the LOSS. That said we are proud to showcase our analysis and as you can all see it played out just like we projected.
Don't forget to like, comment and follow to support us,
GoldViewFX
XAUUSD TOP AUTHOR

4000Points + Nasdaq move hurry inWell we are in a clear bearish trend today we did see a bullish counter trend to this strong downward trendline i highly believe this will be respected major sells to pull thru

BITCOIN head and shoulders 🤚😎✋ Re-test from the trend line!Bitcoin has traced the head and shoulders. In addition it bounced off a downward trend which looks really good.
Idea to enter with a stop loss in place of the last liquidations! Bitcoin may fall further.
Takeprofit at the resistance line!
Comment and like,
Greetings

1INCH Bull's Flag! TO THE MOON? 🔜🌖Hello everyone,
On the chart, I present you a flag pattern. Which from the book's definition, speaks of the continuation of the trend.
I go in, after breaking the top line of the formation.
If the price goes down I have a stoploss ready. It cancels the order with a smaller loss than the expected profit.
It is a quick entry signal.
Comment and like,
Greetings

STOP LOSS > TAKE PROFITHello everybody!
Today I want to discuss with you a question concerning risk management – Is it possible to set a stop loss more than a take profit?
History says…
Historically, traders have a rule according to which a stop loss should not be more than a take profit. There is a logic in this, if you receive more losses than profits, sooner or later your account will disappear.
But time goes by and the market is changing and already today it correctly seems not so ideal.
Every trader should understand that after a large number of trades, the expectation should be positive.
The expectation formula is as follows:
(Average profit value * ratio of profitable positions) – (average loss value * ratio of unprofitable positions) - transaction costs.
In order not to bother with calculations, traders have created a table that simply and clearly shows what a positive expectation is.
According to the table, if only 20% of the total number of your trades are profitable, then the RISK ratio is/The PROFIT should be 5:1 and higher.
If there are 50% profitable trades, then the ratio may be 2:1, and if there are 60% profitable trades, then the stop loss may be even greater than the take profit.
Therefore, the main rule that a trader should follow is that the smaller the take profit, the higher the win rate should be.
The difference in the markets
It is worth remembering that 80% of the books where these tips on the ratio of risk to profit come from are written about the stock market, which is more inclined to rise than to fall.
On the other hand, currency pairs tend to average.
This is the main difference: in the forex market, if the stop is large, you can sit out the fluctuations, if the take is large– you can not wait for it to work out.
You need to understand when and where to use large take profit and stop loss based on the strategy and the market.
And not because you multiplied the stop loss by 10.
Conclusions
The conclusion may be unexpected for you, but the profit/risk ratio is not an unbreakable rule.
Always adhere to the rule of positive expectation.
Set a stop loss and take profit based on the strategy and the market in which you are trading.

Insane Bar pattern Found. HUGE 911 look asap BITCOIN emergency Watch what MM crypto says. "Technical target of 20k for breakdown of "H&S"
www.youtube.com came out today as of 1/10/22
and what this guy says watch what he says about the h&s youtu.be
Im seeing a pump/bulltrap to 47-52k according to this bars pattern. At this point I would take profits and stay safe in USDT if you are in profits. If you are in losses, even at 47k + then i would consider cutting losses. (NOT FINANCIAL ADVICE) You do you, I'm simply giving you a heads-up that has a huge chance of playing out.
Don't forget, bitcoin for 2021 is in a rising pattern.
Stay Safe.

FILECOIN We touch the bottom! My signal to play FUTURES CAREFULLHello Everyone,
My LONG performance at FILECOIN today. Bitcoin with altas is reaching the bottom.
It has to stop the surge, so it can't go much lower.
I take a position with my BTC analysis.
Of course, with great care and moving the STOPLOSS higher and higher.
As we know, we are in a place where investors behave in a panic and make the biggest mistakes.
With this knowledge, we should be prepared for anything. I mean high price volatility.
Comment and like,
Greetings

ETH Last resistance before BESSA! END of dumbs? LEVERS 🧐🧐🆘🆘 Hello everyone!
People still haven't learned, the market is still overflowing.
This can result in high volatility.
After further drops, we landed below my target from the previous analysis.
I didn't expect such a descent, but the profits were realized and it is time for the next move.
In my next strategy, I used the moon phase indicator. Maybe it's nice to tell me when the accumulation will end.
After it, I will take the long position if it goes as planned and there is no further disturbing news from the world.
Possibly when I see a doublebottom signal. Then I will share it with you.
Another drop to the last support is possible, but less likely. A quick wick to remove STOPLOSS may also be formed.
Why do I think so? The on-chain data shows that, a lot of leveraged orders appeared on the market again.
If you have one, you should be careful!
My target is the yellow trend line, I'm counting on new ATH. If it breaking trendline, I'm realizing some profits, counting on further increases.
Comment and like,
Greetings

GOLD is UN VALUATED! This is a CHANCE for a safe PROFIT! Hello everyone!
We all know that gold is the safest investment in the long term.
Inflation is rising and in my opinion, it does not look like it will end this year.
What I'm writing is contradictory to what they are talking about on television, but I know there's more to it.
Gold is undervalued and should cost at least $ 3,000 during this time. Taking into account the purchasing power of "money" and the demand for gold.
Since the rally which started at the end of 2018, the price has increased by 76% in less than 2 years!
If we were to repeat this with a percentage, the price would hit $ 3,200
1 # The first target of the flag pattern is $ 2250, assuming there is a retest at the indicated location.
Strong resistance to break is in place of the previous $ 2075 ATH. In my opinion, we will jump over it with ease.
2 # Second target at $ 2700. A place that matches FIB 2.618 together and potentially the same height,
which took place in 2019.
It's worth investing with gold the long term.
We can be sure that it will only go up.
Comment and like,
Greetings

BNBUSDT 1D 20%+Hello guys! There's an uptrend with price at support and RSI oversold on the daily chart. Long: 440-420, take profit: 535-695. Goodluck!

BITCOIN takes off after liquidations! Don't skip this idea! Hello everyone!
Yesterday, the liquidation on BTC amounted to almost $ 800M, a similar one took place when the price immediately shot up on the new ATH (10/27 - 8/11)
Two scenarios for bullrun, because in my opinion we will not see any drops. Alternatively, if they turn off the internet again in some country or another random or intended situation occurs:)
The first starts now. BTC tested a bearish trendline on the daily chart, which should be followed by gains.
However, if it makes a false move up, there will be another decline, but not as dangerous as the previous one. May you also be prepared for it.
Remember that anything can happen on the market!
The RSI is at very low levels which it will bounce off right now!
The altcoins that I observe have rebounded from the levels, which are very important supports, and as we know perfectly well, if btc is falling, alts also fly.
If we do not break the last FIB level in the longer term, the market will continue to be bullish.
As for me today, there is a very good opportunity to buy or buy with lower risk or higher but assuming a liquidation price below 28k on futures.
Other activities for me are madness and the risk of a heart attack.
Comment and like
Greetings.

Possible ADA inverted head and shoulders scenario "LONG" UPDATESmall H&S forming , right shoulder completing with a possible low $1.20-$1.22. If this holds we will continue Bullish to $2.40 in the next week. Worst case scenario, be prepared if neckline breaks we could possibly see our $1.00. Though there is too much support around $1.20, I can't see that happening. Good luck and I hope you all enjoyed you new year.
Ethereum closed $ 50 million in one hour. Watch out for this !Hello everyone!
With a sharp drop, price stopped at strong support ($ 3600).
Scenario 1 on bullish rises:
Make a quick comeback with a bear flag top test or create a short term double bottom on strong support ($ 3600)
The surest entry is with test the bearish flag from top. Close to the price ($ 3900)
Scenario 2 for bearish rides:
Testing a bear flag from below and it will drop (Book play)
The best place to entry in this situation is the second low at $ 3,600 tested from the bottom.
In this scenario, I aim to test the highs from 09/23 and 09/27, which have not been tested and are very close to 0.5 FIB
I myself will deal with a new one with my strategy if it happens.
Comment and like.
Greetings!

DREAMS QUEST Wedge Breakout 1043% potential (Mobile Version)Hello traders,
DISSECTING A FALLING WEDGE TRADE
THE STRUCTURE
Todays technical analysis is on DREAMS QUEST. This coin seems to be consolidating in a falling wedge pattern which I have seen many times play out very well for the Kucoin bangers that get listed. What you want to look for on a falling wedge pattern is 3 touches on both the bottom support trend and 3 touches on the top resistance trend. This will be the formation of the bullish consolidation falling wedge pattern as saw in the chart.
The key indicators of a bullish falling wedge parttern are a wide mouth at the beginning of the pattern and bullish price heading up to the top of the pattern. Then an ABC corrective wave during a bearish down trend that consolidates tightly at the end of the pattern. A lot of times you will be able to use a fib tool from the bottom of the recent to the top of the beginning of the wedge and see that the bottom of the wedge generally bounces off of the 50% Fibonacci level indicating the price action may have exhausted the bearish market participants.
THE STOP LOSS
There is nothing more important in trading than risk management and protecting your capital. No matter how good of a pattern you see or how promising a trade set up is, the market could always have some bearish news that completely destroys your position. Thus, if you’re going to trade, USE A STOP LOSS!! Ok, for this particular pattern, placing your stop loss is pretty simple, I have a general rule of thumb to place my stop loss 3% below the last swing low of the falling wedge prior to the breakout. Which this will be placed after your entry which we will go over next but, I have listed it in this tutorial first as it is more important than your entry! Your initial stop loss is at .06295¢
THE ENTRY
Your entry will be upon the breakout of the top of the wedge located in area #1 or upon retest of the breakout areas in box #2 shown on the chart. Upon breakout of the top of the falling wedge pattern, in the box labeled #1 this being your initial breakout area, you’re going to want to see a CLEAR bullish candle on the daily come above the trend line and be in the #1 buy box before entry to confirm that breakout. The entry for this trade is between .08718¢ and .09880¢
KEY NOTE and always a rule of thumb here is patience, your entry will come. Make sure you have a clear closed candle outside of the pattern before you think about opening a trade as there are very often false breakouts and it’s better to have a slightly less favorable entry than to have an entry that will end up getting you stopped out before the trade even starts.
Last but not least, another KEY NOTE to look for when placing your entry is to make sure you watch for a spike or increase in volume upon breakout. This is a solid indication that the selling pressure has been exhausted and the market participants are turning bullish, adding more quality to your trade. ALWAYS LOOK FOR THIS INDICATOR FOR OPTIMAL TRADE RESULTS.
THE ALLOCATION
I generally enter with 25%-50% of my allocation I have set aside for this trade at this point. When you’re actively trading it is important to keep your allocation low as when you have a large amount of your capital in a specific trade the hardest parts about trading start affecting you and coming into play. That is the psychology of the trade. The more money you have in any given trade will draw bigger fear and bigger ego if you have a loss or a win. Both are equally bad in trading and will cause you to lose money. So when I say I allocate 25%-50% of the funds I have for this specific trade you have to keep in mind that you should not be using more than 3% of your total account in any particular trade this, my 25%-50% is actually .75%-1.5% of my total account. This makes it easier to just let the trade ride and to follow my plan regardless if I am correct or wrong about my trade, it’s is a calculated loss with a small amount of capital allowing me to have a higher chance of having a smaller drawdown on my overall capital if the market gets bearish on me while I’m in a few longs. So, getting to the other half of my allocation. Generally a consolidation like this will have a very bullish breakout that will pop a hot few candles out of the pattern and generally head to the .618-.5 fib measured from the top to the bottom of the full falling wedge pattern. At this point I take a small amount of profit. About 50% of my current position. This will leave me with .375%- .75% of my capital still in the trade and a small amount of profit that I made from the initial breakout on the side. Now here comes the most important attribute you need to be a good trader, PATIENCE !!! After my small win, I am looking to enter back into this trade at the official retest of the breakout of the pattern. This generally comes shortly after the first target is hit. Again, patience is imperative to your success as a trader. Wait it out until you have a clear candle back at the entry point before you add your second half of your position.
PATIENCE IS KEY BUT, ALARMS HELP!
Have I mentioned that patience is an important attribute you must have to be a successful trader? Not enough? Ok, we’ll it is! I do know that all of our time is very precious and dear so, I have a small remedy to help with allocations your time so you’re not just starting at your charts… USE ALARMS!! TradingView had everything that you need to be successful, it is your responsibility to learn it so you can earn it! I generally first set an alarm at the entry point of my trade set up that I have identified as well as where I’d expect the stop loss to be. #1, so I can be reminded that the trade has either entered my first entry zone, or to let me know that the trade I have identified may not be what I thought it was and to re assess the situation or find a new trade. Again, patience! So, after my entry alarm goes off and I start my initial position, I then set my stop loss and assure my alarm is set a few pips above my stop loss so I can be alerted before it hits as well as well as an alarm at my first target and one more at my entry point. This way I can be alerted that my first take profit was hit and if the price action comes back down to retest I have an alarm there as well to place my second position along with my profit from the first target TP allocated to the whole trade. At this time I double check that my stop loss is a market stop for my total position and that I have an alarm set up for it that sends a text to my phone just in case!
After this I gage my take profit targets and place alarms on all of them as well.
SETTING YOUR TAKE PROFIT TARGETS
This is what we are here for, the profit right? So it’s important that you have take profit targets (TP TARGETS) on your chart as you need to plan the points you’d like to exit your trade. The first target I find is the total and final take profit of the pattern, which can be determined by measuring the distance between point A and point B which can be found at the beginning of the mouth of the falling wedge as shown in the diagram above on the top of the chart. Once you have the distance measured between points A and B you can then ad this measurement on top of the first area of the breakout candle on the bottom of the falling wedge pattern as soon as the price action shows you where it is breaking out. KEY NOTE is to always make sure you’re being conservative and by this I mean, when placing the distance from A to B on C to D, it is important that you don’t try and get it perfectly to the full measure meant on C To D. What I do is shave off a few % from the total measurement so I can allow for margin of error with my target. Minimum of 3%. Now that I have my final target set up at .99704¢ I then take a Fibonacci tool and run it from the top of the pattern to the bottom of the pattern and place TP targets at both the .5 Fib and the .618 Fib lines. I find that this is the easiest way to get quick targets on a falling wedge pattern that the price action generally will react to while heading to the final target. The .5 Fib is at .34509¢ TP target #2 and the .618 Fib TP target #1 is at .23311¢.
Congrats, you’re almost done with your trading plan! Now to the best part!
GETTING PAID!!
Everyone’s favorite part about trading! Ok, now that you have entered the quality trade, have your risk management set up and are ready to get into some profits here we can set a plan for taking some of those beautiful profits. Now being that we have 3 target areas here I generally have 3 separate take profit %’s that I set up along the way by lieu of limit sell orders for the first two TP targets. My take profit target allocation strategy is generally the 33.3% take profit strategy at every target. So for the first two targets, I will set limit sell orders for 33.3% and a 33.4% of my allocation adding up to 66.7% after the first two targets are hit. This way I am already in profit just in case something goes wrong along the way. KEY NOTE it is always smart to take profit, as if you don’t you’re just an investor without a plan and you’re never profitable until you take profit, so congrats, at this point you’re a profitable trader! Yaaayy!! Ok, so for the final take profit I set a market order as a lot of times when the final take profit comes about the price action can quickly get up to this area and we don’t want to be stuck looking for someone to take the coins off of our hands, we want to get them sold and go celebrate our win by looking for our next trade so we can compound these gains amirite??
So awesome, we have a W on the board so we’re done right? No, there’s another tip you should know in trading to assure profits and apply better risk management strategies. What is this you ask?
KEEPING AS MUCH PROFIT AS YOU CAN
How do we do this? Simple, after your first two take profits hit, which you will be reminded on your cell phone via text messge because you, ya sly devil, you set up alarms on your TP targets and now are going to head over to your exchange and move your stop loss up aren’t ya? Of course you are! Where are you moving it to? Why not make that right at your entry point so not only are we assuring we don’t lose any money on this trade at all, but, we are in fact in profit from 3 separate TP targets that we cashed in on!! NOOOOYCE!! So now that we are deciding on what color Lambo we want, we can assure we still have some bank roll by tossing that stop loss up from .06295¢ to the entry of the trade at .10416¢
Ok, you have it all set up, I wish you the best and make sure you’re doing your own research as I am not a financial advisor nor is this financial advice. Before we end, here is some key note reviews and the signal targets for the original trade below.
KEY NOTE AND TAKEAWAYS
#1: Patience is key to any successful trader success.
#2: Allocation should always be a fraction of your total account
#3: Be sure to identify the structure based on the rules above.
#4: Wait for a CLEAR breakout by looking for a daily candle close above the resistance trend line on the top of the falling wedge
#5:The retest happens after the breakout
#6: Not the 6th most important but, ALWAYS USE A STOP LOSS!!
#7: ALARMS make life easy!
#8: You have to take profit to be profitable! SO TAKE SOME OFTEN!
Entry: Between .08718¢ and .09880¢
Stop loss: .06295¢
TP1: .23311¢
TP2: .34509¢
Final TP3: .99704¢
P.S. it’s always important to know the fundamentals on a coin, so with that said, below are some stats, coin info and a link to the coins website so you can further research it during your DD.
FUNDAMENTALS
Dreams Quest Coin Price & Market Data
Dreams Quest price today is $0.090157396598 with a 24-hour trading volume of $8,589,048. DREAMS price is up 31.4% in the last 24 hours. It has a circulating supply of 0 DREAMS coins and a total supply of 186 Million. If you are looking to buy or sell Dreams Quest, KuCoin is currently the most active exchange.
Dreams Quest is building the first-ever metaverse-based economy, a self-sustaining DreamsVerse where people will be able to participate in the decentralised play-to-earn RPG game using dynamic NFTs. Unknown factors will affect character attributes in-game, and post-game outcomes will dynamically change the NFT card attributes and write them on the blockchain (the ethereal scribes) to show game history for each card.
Website: dreams.quest

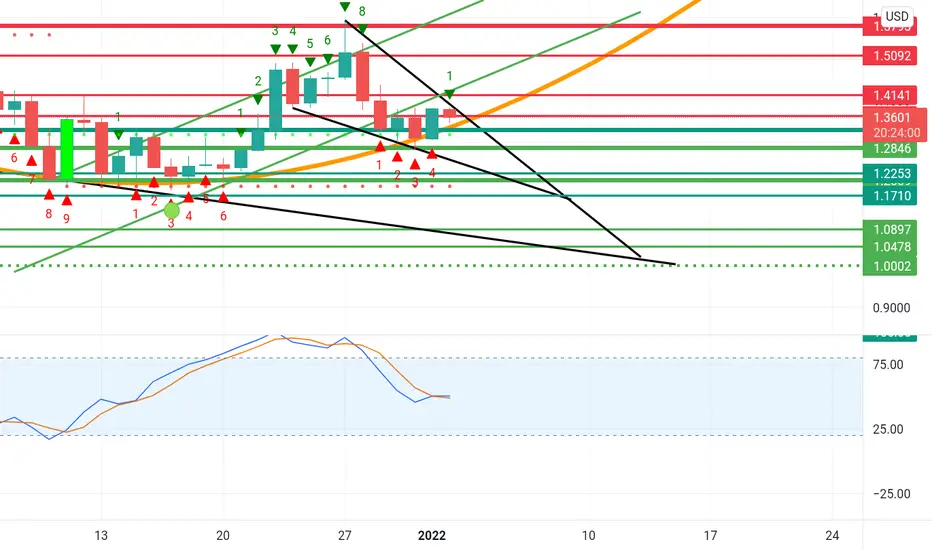
LUNA continuation of the mid-term downtrend SHORTHello everyone.
Introducing LUNA to the USD.
After a sharp drop from 27/12, Luna drew a bearish flag and tested it from the bottom, which shows a continuation of the downward trend in the medium-term.
The convergence of the trend line, 0.5 Fibonacci and a similar percentage decrease act as a magnet in the designated place of my takeprofit
Cryptocurrency after the $ 100 rally, need a breath. Personally, I'm selling a LUNA with a marked stop loss of $ 90 and a takeprofit of $ 73
This is not an investment advice, but my personal analysis.
Comment and like
Greetings.

EURUSD long trade idea from 30.12 updateI'm still having parts of this trade open, as the price is retracing back to the previous demand zone, showing some signs of reaccumulation. We're still aiming at the 1.151 - 1.157 range, but this can take some time, so be patient.

BITCOIN about to make that push!wassup my peeps, yes u read right, bitcoin to the moon they say well that may just be the case here. BTC is currently rebounding off the weekly support, also on the daily chart above we can also see price is holding above the 200 moving average and also we saw a pinbar candle close to a major support level. With these confluences and price action signals i will open a long position on BTC.
entry 51022.5
stop loss 45606.4
take profit 65352.6

gbpjpy sell trade swing trade hello trader. Today we have a sell setup on the gbpjpy. Price recently broke out from a strong weekly descending trendline an formed an uptrend, the price is now currently at a major weekly resistance and price has now formed a harami pattern. we expect to see a drop in price.
Entry 153.225
Stop loss 154.176
Take profit 149.525
This is a very volatile pair that moves, so use good risk management. goodluck!
