NZDUSD (H4): SHORT NOW on This REJECTION!Hi traders and welcome to my channel, if you enjoy my FREE Technical Analysis , support the idea with a big LIKE 👍 and don't forget to SUBSCRIBE my channel, you won't miss anything!
The NZDUSD is giving us a nice short opportunity, if you would like to understand the reasons I believe the market is getting an upcoming trend correction, I suggest you to have a quick look on my previous NZDUSD Daily Analysis, you could check it out on my "Link to Related Ideas" or clicking the link below:
Let's focus now on the area the interests us:
The trendline resistance rejected and reversed the market two times and now that the price reached the same level again, there is still a new short opportunity, the bearish tweezer candlestick pattern could be an interesting entry point, here below the details of this trade:
ENTRY POINT: 0.71870
TAKE PROFIT: 0.70926
STOP LOSS: 0.72408
RISK/REWARD RATIO: 1.6
Takeprofit

AUDUSD (H4): SHORT NOW on the TWEEZER Candlestick Pattern!Hi traders and welcome to my channel, if you enjoy my FREE Technical Analysis, support the idea with a big LIKE👍 and don't forget to SUBSCRIBE my channel, you won't miss anything!
In my previous analysis I explained the reasons I believe the market is going to fall down soon, you could check it out on my "Link to Relates Ideas" or clicking on the link below:
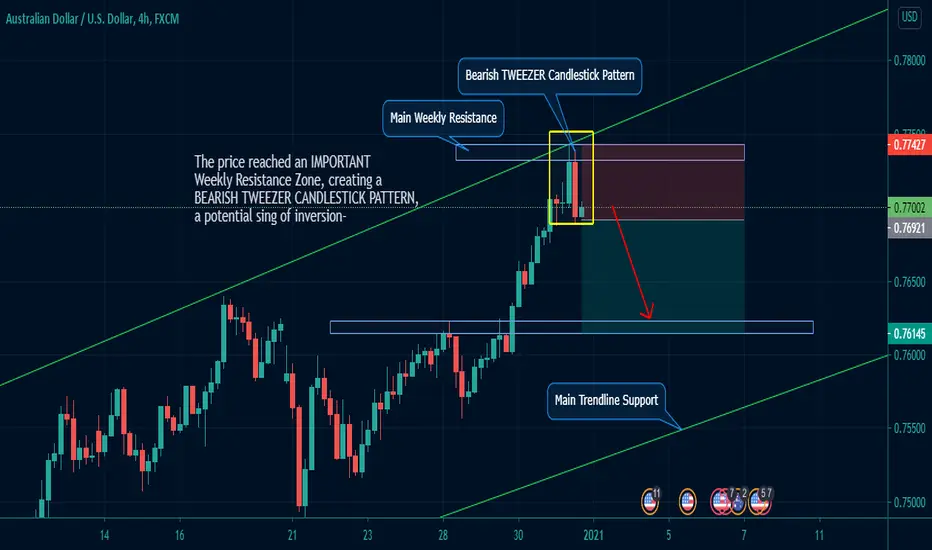
Let's focus now only on the area that interests us:
As we can see, the price reached an important resistance zone, that rejected the price many time in the past. It actually created a clear Bearish Tweezer Candlestick Pattern;
IF THE PRICE will continue on the same trend (let's wait the next candle to have a confirmation before opening any position), you could place a short trade:
ENTRY POINT: 0.76500
TAKE PROFIT: 0.76153
STOP LOSS: 0.77437
RISK/REWARD RATIO: 1.53
USDJPY SHORT 1:5 RR TP hit!Using psychological levels to determine TP and a breakout of a triangle this short was a success!

USDJPY OPPURTUNITY TO SELL - IDEA Range resistance is in the way of bulls with the half-hearted moves. USDJPY is moving in the sideways range with a potential opportunity to enter a sell trade from 104.400 to 103.400 a potential 100 pips trade setup.

EURUSD (Daily) SHORT IDEA: Historical Resistance zonePOTENZIAL PROFIT: 350 pips
TECHNICAL ANALYSIS:
-The price followed a really strong uptrend, breaking an important weekly support (during a period of high volatility and high momentum) but rejected from the resistance zone.
Since the beginning of August until November the market followed a consolidation phase, bouncing twice on our important weekly support.
-The price was oversold and getting more momentum, enough to move up; An ascending triangle pattern confirmed the uptrend.
-The price actually is still in a strong up trend, trying to reach the main resistance zone, an historical level that rejected the price several times in the past;
CONCLUSION:
In my opinion is not the right moment to entry short, the market is still moving up and there is still no sign of inversion.
Once the price will reach the resistance zone, an accurate analysis of the price action could give us a nice opportunity to get a big short position.
If you enjoy my FREE Technical Analysis, let me know that with a big LIKE, I'll be so glad!
Have you got some similar or interesting idea? Feel free to leave a comment below sharing your idea!
Are you interested getting more FREE Technical Analysis like this? SUBSCRIBE my channel and you won't miss anything!
Trade Safe,
Gianni

CADCHF (Daily) LONG IDEA: Ascending Channel!!TECHNICAL ANALYSIS:
-The price was following a strong uptrend when it broke an important weekly resistance zone at about 0.70273; Once the momentum and volatility started becoming weak, the price collapsed inverting the trend.
- The price then, bounced on a strong support area, creating a correction of the trend, matching with the 0.61% Fibonacci retracement. (The price was oversold and it was getting a strong momentum, sign of a trend inversion.)
-The market started an ascending channel, clearly bouncing between the support and resistance of the channel.
CONCLUSION:
The market seems to be very strong, few days ago the price bounced on the channel's support and started a new uptrend trying to reach one more time an important weekly resistance zone.
Lot of traders would like to open a trade just now, that's not wrong if you consider that the price is getting high volatility and strong momentum.
I'd prefer to get one more confermation, but don't lose this great opportunity!
POTENZIAL PROFIT: 120 PIPS
If you enjoy my FREE Technical Analysis, let me know that with a big LIKE, I'll be so glad!
Have you got some similar or interesting idea? Feel free to leave a comment below sharing your idea!
Are you interested getting more FREE Technical Analysis like this? SUBSCRIBE my channel and you won't miss anything!
Trade Safe,
Gianni

AUDCAD (Daily) SHORT IDEA: Reaching a weekly resistance Zone!TECHNICAL ANALYSIS:
-The market has been moving with a strong uptrend until the end of July 2020, keeping the price over the EMA 50, that's a nice confirmation of the market's strenght.
-The resistance zone at 0.96624, rejected the price, and it failed any attempt to break it again. During this consolidation phase, the market was losing momentum and the price was overbought. (It was a clear sign that the market was losing the strenght to carry on the same trend)
-The market then got a correction, it broke the EMA 50 and bounced on the support level at about 0.92454 before starting a new uptrend. (The correction match perfectly with the 0.50% Fib. Retracement)
CONCLUSION:
The market is clearly following an ascending channel but it is also reaching an important weekly resistance level that already rejected the price in the past.
I definitely don't suggest to open any short position right now, but I suggest to wait the price action on the resistance level to understand the next market movement.
POTENTIAL PROFIT: 150 PIPS
If you enjoy my FREE Technical Analysis, let me know that with a big LIKE, I'll be so glad!
Have you got some similar or interesting idea? Feel free to leave a comment below sharing your idea!
Are you interested getting more FREE Technical Analysis like this? SUBSCRIBE my channel and you won't miss anything!
Trade Safe,
Gianni

EOS, best place to Buy for Long-Term 🌶️EOS was in a long-term down trend, as you can see in the daily chart, This Trend is broken and it's retested..
If you're looking for a reliable coin that it is on a good entry point so you can hold it for long-term, EOS IS THE ONE!!!
I'm confident about the take profit points I've shown you on the chart and of course it can go beyond, but it needs more information so I can analyze it.. It's a 150% to 200% profit depends on when you buy it..
Besides all this, I could use some help from you, I want to know if you have any idea about how EOS is going to reach around the 8$ target that I've shown?? I gave you my opinion with the red arrow in the chart.. I'll be glad to read or see your answers with you charts..
Feel free to ask me any question about the chart..
This is my idea.. What do you think??

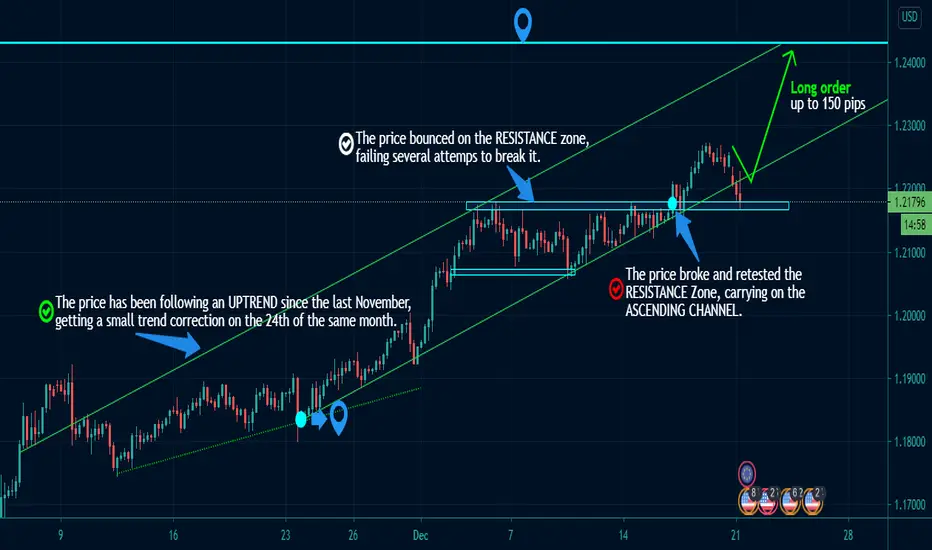
EURUSD H4 Reaching an IMPORTANT Resistance ZoneTECHNICAL ANALYSIS:
-Since the beginning of November, the price has been following an ascending channel, getting a small trend correction on the 24th of the same month, carrying on the same trend.
-Strong volatility and momentum let the price pushes until it reached a resistance zone at about 1.21695, failing several attemps to break it (upbars with small body and long shadows are definitely a sing of uncertainty market).
-On the 16th of December, the price finally broke the resistance zone, moving bullish with a constant movement, trying to reach a strong weekly resistance zone at about 1.24330.
CONCLUSION:
The market is still in a really strong uptrend but very close an important resistance level that rejected the price several times in the past. I believe the market will get a nice correction soon, but at the moment there is still a chance to get a small long position!
If you enjoy my FREE Technical Analysis, let me know that with a big LIKE, I'll be so glad!
Have you got some similar or interesting idea? Feel free to leave a comment below sharing your idea!
Are you interested getting more FREE Technical Analysis like this? SUBSCRIBE my channel and you won't miss anything!
Trade Safe,
Gianni
AUDUSD Full Monthly ViewTECHNICAL ANALYSIS:
-Since the 2002 the price has been following a really strong trendline, bouncing on it and keeping the price over this level for 13 years.
-In July 2015 the price broke the trendline during a clear downtrend, bouncing on the support level at about 0.70000 and failing any attemp to break the resistance zone at about 0.76402.
-In January 2018, the price was rejected one more time before falling down in a long downtrend, concluded with a big bounce on a strong monthly support level.
CONCLUSION:
The price is actually reaching an important resistance zone, I aspect the market get a correction, bouncing eventually on the support level at 0.70000, before moving up again, trying to reach our previous "historical" trendline.
If you enjoy my FREE Technical Analysis, let me know that with a big LIKE, I'll be so glad!
Have you got some similar or interesting idea? Feel free to leave a comment below sharing your idea!
Are you interested getting more FREE Technical Analysis like this? SUBSCRIBE my channel and you won't miss anything!
Trade Safe,
Gianni

EOS Buy PositionEOS is going to complete a harmonic pattern.. I believe buy position is above the "B" point and stop-loss below this area..
EOS has three different target for "D" point.. Whenever the price reaches a fib level marked in chart, you should check the price action to understand if EOS is going to the next Fib level or not.. Follow my profile for my further comments on price action at each level..
Buy around: 3.148
Stop-Loss at: 3.110
Take-Profit at:
Target1 : 3.256
Target2 : 3.334
Target3 : 3.432
This is my idea... What do you think??

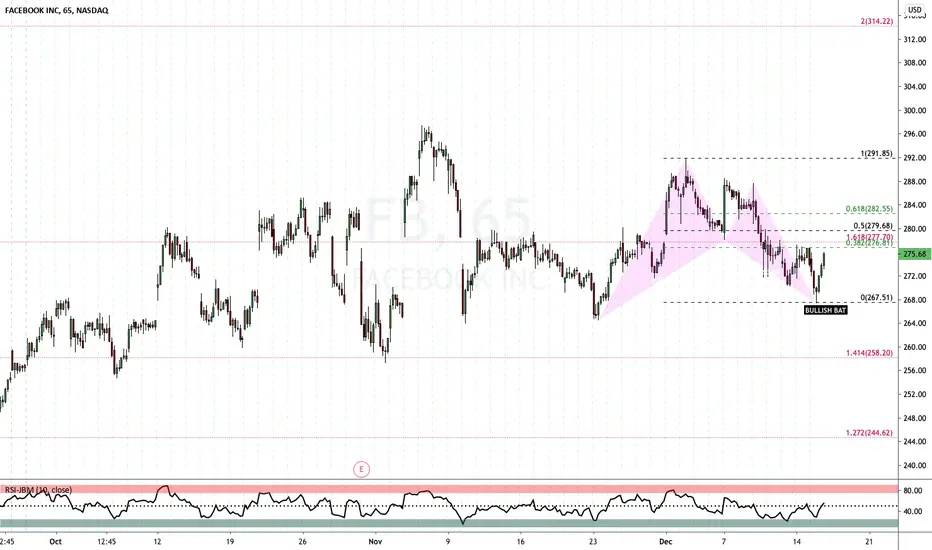
FB Bullish BAT CompletionFB completed a perfect BAT precise D point .886 AXA.
Now in take profit mode 1st target 38 fib.. last one for now..
Good luck trading.
SNOW Take Profit Mode - Bullish Bat CompletionSNOW Bullish Bat Completion - now in take profit mode.
Entry at D and will sell half at 1st take profit 38 fib

EURUSD H4 RISING WEDGE Reversal PatternTECHNICAL ANALYSIS:
-Since the end of November, the market was pushing up in a really strong up trend, it lost his strenght only one week ago, when it bounced back on the resistance line at 1.21804;
-It started then falling down following a nice Descending Channel, completed on the 10th of December, bouncing back on the support at 1.20702;
-The price is following now a potential Rising Wedge, it will probably fall down soon.
CONCLUSION:
I aspect the price falls down for several reasons, the Rising Wedge is usually a Reversal Pattern, the price is actually so close to bounce again on the resistance line, VOLUMES are decreasing and the price is definitely OVERBOUGHT.
I previously explained why the EURUSD Market is going SHORT soon, even with bigger Time Frames, you can check it out on my profile, I'll share the link in the description.
I hope this free analysis can be usuful for everybody, please "like" the post and follow my channel if you enjoy my work!
Have a good day and trade safe!
Gianni

USDCHF H4 The DOUBLE BOTTOM is REVERSING the Market!TECHNICAL ANALYSIS:
-Since the 25th of November the market was following a strong Downtrend, keeping the price under the Exponential Moving Average 50 untill the 3rd of December;
-The price then, reached a strong Support Area at 0.89000, moving the market in a side trend with a really Low Volatility;
-Since the 9th of December, a fast decrease of volumes made the market weak, it started falling down again, bouncing twice on the support at 0.88526 and retesting the Resistance area, without break it, creating a clear DOUBLE BOTTOM Pattern.
CONCLUSION:
I aspect a nice reverse of this market, the price is actually OVERSOLD and it's getting slowly strenght enough to push up and retest the Resistance Area at 0.89000.
I'll decide to entry LONG after a new retest of the resistance area, waiting for a clear breakout of that.
If you like my idea, please leave me a like, it will help me so much, hopefully my free analysis will be usufull for everybody. Don't hesitate do share your idea, if you get something interesting!
Have a good week and trade safe!
Gianni

TESLA - Follow up to previous post - Time to take profitsTime to take profits here and let late buyers fight the bears.
With our members, we closed part of our positions at 573 some of our positions a week ago and now we closed most of our remaining and left only 1/4 with a stop at 510.
If it continues higher after what seems to be a triangle consolidation.
Looking for 630 next where red wave V would be equal to wave I.

Another TP Hit - EURUSDOn this EURUSD buy you can see how the pivot levels play, with price bouncing out of the resistance pivot. Please follow us or see the tonisignals website for more


Review of back to back CADCHF trades.Evening traders
I just wanted to share two trades I've taken in the last two days on CADCHF working the 30M time frame.
In previous Forex ideas I have noted using the strategy I am utilizing on the H1 time frame following trend until next signal presents.
But this strategy is adaptable to how you would like to trade. In this example I have set my parameters to work to a stop loss and take profit setting. The setting is a 1:2.15 risk to reward ratio. Back tested from when I started trading this pair on March 4th in this manner you will see the results at the bottom of the screen are 79% gains on capital. This from risking 2% of capital per trade.
$200 dollars was risked on these trades for a $430 dollar gain on capital. Trade one was a 31pip profit move and trade two a 29 pip profit move.
For any more information on the strategy I am using please feel free to drop me a message.


I Think XRP Has An OpeningXRP made a nice triangle, by using harmonic patterns I give you this buying signal.
It has a great RISK/REWARD potential..
Let's see how does it work...
Buy: 0.63
Target1: 0.87
Target2: 0.95
Target3: 1
Stop-Loss: 0.575

I Thin ALGO has an openingBuy @ 0.27 - 0.28
Target1 @ 0.3
Target2 @ 0.32
This is my analysis that I wrote all the details in the chart but I put my Take-Profit target at 0.315 as you can see in the the chart because I didn't want to get caught in some fundamental news about US election or COVID Vaccine lol..
This is my idea.. What do you think..

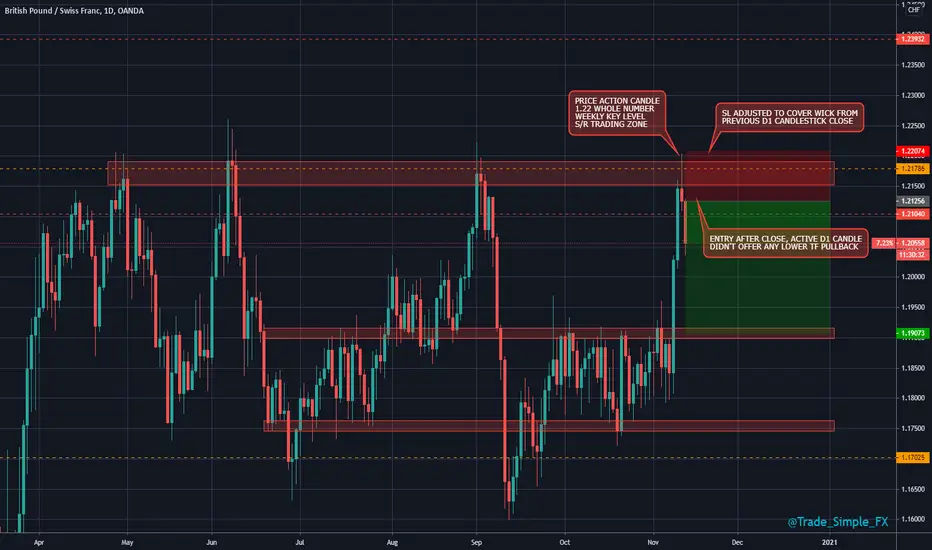
GBPCHF D1 - Short SetupGBPCHF D1 - This is an absolute textbook example of trading between the zones using price action, GBPCHF generally deemed as a slower moving pair (confirmation can be seen). The only issue is, the confirmation candle was very large which skews RR a little bit. Risk markets are still in play which is dangerous too, but confluences all stacked here and the principles and rule sets remain the same.