OGKB 5M Investment Aggressive CounterTrend TradeAggressive CounterTrend Trade
- short impulse
+ biggest volume T1 level
+ biggest volume 2Sp-
+ weak test
+ first bullish bar close entry
Calculated affordable stop limit
1/2 yearly level take profit at 0.459
1H Counter Trend
"- short impulse
+ biggest volume TE / T1 level
+ support level
+ volumed 2Sp-"
1D Trend
"+ long impulse
+ JOC level
+ support level
+ 1/2 correction
+ volumed manipulation"
1M Trend
"+ long impulse (in 1d 4h)
+ neutral zone"
1Y CounterTrend
"""- short impulse
+ 2Sp-
+ perforated support level"""
Takeprofit

AUD-CAD Free Signal! Sell!
Hello,Traders!
AUD-CAD shot up sharply
But the pair failed to break
A horizontal resistance
Level of 0.8880 and we are
Already seeing a local pullback
Which is likely to turn into a
Local correction on Monday
So we can enter a short trade
With the Take Profit of 0.8779
And the Stop Loss of 0.8887
Sell!
Comment and subscribe to help us grow!
Check out other forecasts below too!
Disclosure: I am part of Trade Nation's Influencer program and receive a monthly fee for using their TradingView charts in my analysis.

GBP-NZD Local Long! Buy!
Hello,Traders!
GBP-NZD fell down strongly
Through the first line of
Support but a strong support
Was hit around 2.2160 from
Where a local bullish rebound
Is likely to happen on Monday
So we will be able to enter
A long trade with the Take
Profit of 2.2300 and the
Stop Loss of 2.2123
Buy!
Comment and subscribe to help us grow!
Check out other forecasts below too!
Disclosure: I am part of Trade Nation's Influencer program and receive a monthly fee for using their TradingView charts in my analysis.

GBP-USD Free Signal! Buy!
Hello,Traders!
GBP-USD is trading in an
Uptrend and the pair is
About to retest a horizontal
Support level of 1.3181
From where we will be
Expecting a local rebound
As we are locally bullish biased
So we can enter a long trade
With the Take Profit of 1.3290
And the Stop Loss of 1.3147
Buy!
Comment and subscribe to help us grow!
Check out other forecasts below too!
Disclosure: I am part of Trade Nation's Influencer program and receive a monthly fee for using their TradingView charts in my analysis.

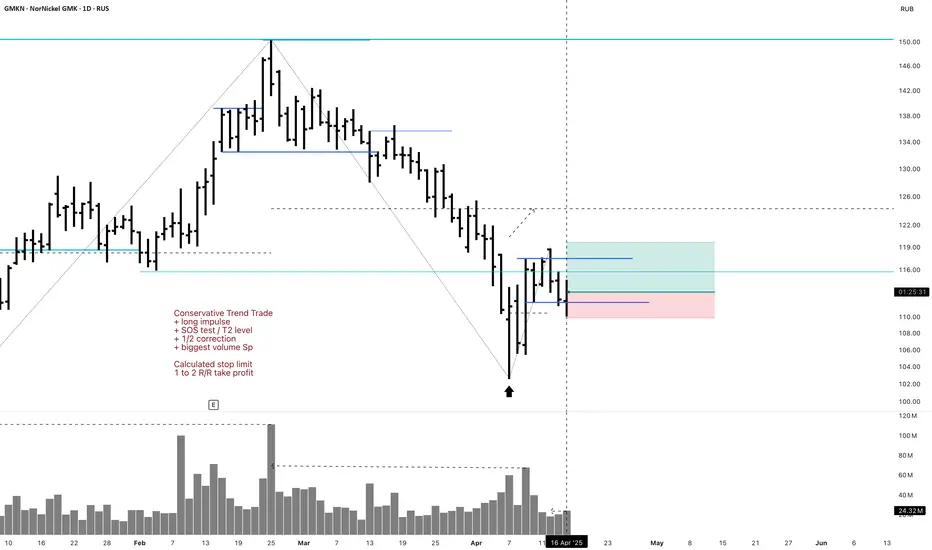
GMKN Long 1D Investment Conservative Trend TradeConservative Trend Trade
+ long impulse
+ SOS test / T2 level
+ 1/2 correction
+ biggest volume Sp
Calculated stop limit
1 to 2 R/R take profit
Monthly Trend
"+ long impulse
- SOS reaction bar level
+ 1/2 weak correction"
Yearly Trend
"+ long impulse
- below SOS
+ 1/2 correction"
LIMIT ORDER - $SERAPH/USDTLIMIT ORDER - $SERAPH/USDT
Direction: #Long 🟢
Entry Price: 0.19229
Stop Loss: 0.17019
Target 1: 0.20862
Target 2: 0.22494
Target 3: 0.24127
Target 4: 0.25759
Target 5: 0.27392

EUR-USD Free Signal! Buy!
Hello,Traders!
EUR-USD made a nice
Bearish correction from the
Resistance above and hit
A horizontal support level
Of 1.0934 from where
We can go long on Monday
With the Take Profit of 1.0996
And the Stop Loss of 1.0906
Buy!
Comment and subscribe to help us grow!
Check out other forecasts below too!
Disclosure: I am part of Trade Nation's Influencer program and receive a monthly fee for using their TradingView charts in my analysis.

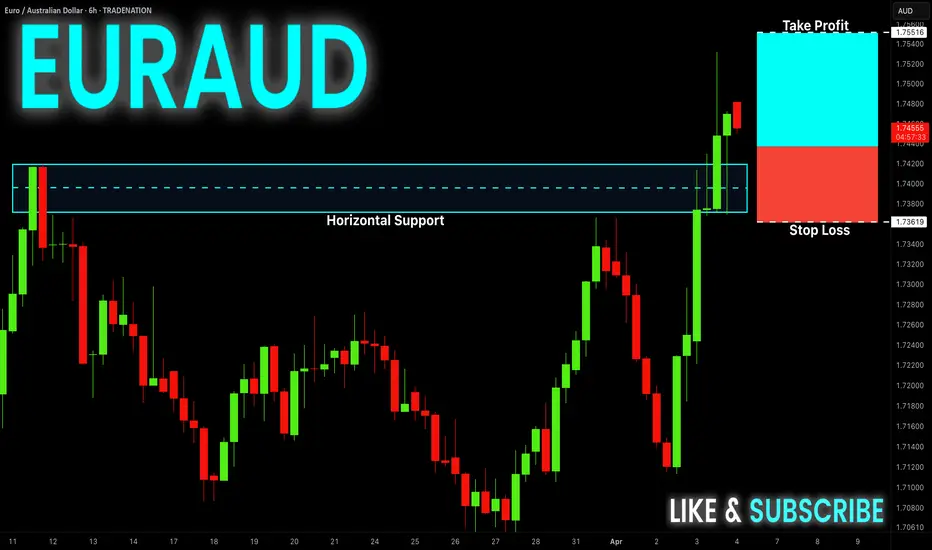
EUR-AUD Free Signal! Buy!
Hello,Traders!
EUR-AUD is trading in a
Strong uptrend and the
Pair made a bullish breakout
And a retest of the key
Horizontal level of 1.7420
And is going up now so
We can enter a long trade
On a local pullback with
The Take Profit of 1.7551
And the Stop Loss of 1.7362
Buy!
Comment and subscribe to help us grow!
Check out other forecasts below too!
Disclosure: I am part of Trade Nation's Influencer program and receive a monthly fee for using their TradingView charts in my analysis.
GBP-AUD Free Signal! Buy!
Hello,Traders!
GBP-AUD is trading in a
Local uptrend and the pair
Made a local correction
Of the horizontal support
Level of 2.0634 so we can
Enter a long trade with the
Take Profit of 2.0724 and
The Stop Loss of 2.0582
Buy!
Comment and subscribe to help us grow!
Check out other forecasts below too!
Disclosure: I am part of Trade Nation's Influencer program and receive a monthly fee for using their TradingView charts in my analysis.

NZD-CAD Free Signal! Sell!
Hello,Traders!
NZD-CAD made a bearish
Breakout of the key horizontal
Level around 0.8182 so we are
Bearish biased so lets let the
Pair make a pullback and
Retest the lower bound of
The new resistance level
And from there we can go
Short with the Take Profit
Of 0.8136 and the Stop
Loss of 0.8196
Sell!
Comment and subscribe to help us grow!
Check out other forecasts below too!
Disclosure: I am part of Trade Nation's Influencer program and receive a monthly fee for using their TradingView charts in my analysis.

NZD-CHF Free Signal! Sell!
Hello,Traders!
NZD-CHF is going down
And the pair made a bearish
Breakout and it is confirmed
So we are bearish biased
And we can enter a short
Trade with the Take Profit
Of 0.5018 and the Stop
Loss of 0.5060
Sell!
Comment and subscribe to help us grow!
Check out other forecasts below too!
Disclosure: I am part of Trade Nation's Influencer program and receive a monthly fee for using their TradingView charts in my analysis.

GBP-NZD Free Signal! Buy!
Hello,Traders!
GBP-NZD is trading in an
Uptrend and the pair made
A bullish breakout of the
Key horizontal level of 2.2600
Which is now a support then
Made a retest and we are now
Seeing a bullish rebound
Already which reinforces our
Bullish bias on the pair and
Suggests that we enter
A long trade with the
Take Profit of 2.2715
And the Stop Loss of 2.2568
Buy!
Comment and subscribe to help us grow!
Check out other forecasts below too!
Disclosure: I am part of Trade Nation's Influencer program and receive a monthly fee for using their TradingView charts in my analysis.

Mastering Risk Management in Trading: The Ultimate GuideMastering Risk Management in Trading: The Ultimate Guide
In the world of trading, success isn’t measured only by big wins but by how well you protect your capital from unnecessary losses. Risk management isn’t just a safety net—it’s the backbone of sustainable trading. In this comprehensive guide, we’ll break down the principles and strategies you need to safeguard your account while still maximizing your profit potential.
---
1. Risk-Reward Ratio: The Foundation of Every Trade
- What it is:
The risk-reward ratio is the cornerstone of every trade. It tells you how much potential reward you’re targeting compared to the risk you’re willing to take. For instance, if you risk $100 and aim to make $200, your risk-reward ratio is 1:2—a commonly accepted standard in trading.
- How to use it:
- Always predefine your risk-reward ratio before entering a trade.
- For swing traders, aim for a minimum of 1:2 or 1:3 to justify holding overnight.
---
2. Position Sizing: The Key to Survival
- Why position sizing matters:
Position sizing ensures you don’t over-leverage your account or lose too much in a single trade. Many traders fail because they bet too big and get wiped out after just a few losing trades.
- How to calculate position size:
- Use this formula:
Position Size = (Account Risk $ ÷ (Entry Price - Stop-Loss Price)).
- For example, if you’re risking $100 per trade and the difference between your entry and stop-loss is $5, your position size should be 20 units (100 ÷ 5).
---
3. Stop-Loss Orders: Your Safety Net
- What is a stop-loss?
A stop-loss is your emergency brake. It’s an order you set in advance to sell your position if the price moves against you by a specified amount.
- How to set stop-losses:
- Use technical analysis to place your stop-loss below support levels for long trades or above resistance levels for short trades.
- Avoid placing stop-losses too close to your entry point, as small fluctuations might trigger them unnecessarily.
Here you can see my ratio is on the low side so i can place a tactical TP and SL in relation to liquidity lines.
---
4. The Art of Diversification: Spreading Risk
- Why diversification works:
Putting all your capital into a single trade or instrument increases your risk. Diversification spreads that risk across multiple trades or markets, reducing the impact of any single loss.
- How to diversify effectively:
- Trade across multiple sectors or currency pairs.
- Avoid overexposure to correlated assets (e.g., don’t trade EUR/USD and GBP/USD simultaneously).
---
5. Emotional Discipline: Winning the Mental Game
- Why it matters:
Even the best trading strategy can fail if emotions like fear or greed take over. Emotional trading leads to impulsive decisions, revenge trading, and overtrading.
- How to maintain discipline:
- Stick to your trading plan, no matter what.
- Use tools like meditation, journaling, or physical exercise to manage stress.
---
6. Dynamic Risk Management: Adapting to Changing Markets
- Adjusting your strategy:
Markets are dynamic, and your risk management should adapt. Volatility can change quickly, requiring you to adjust your stop-loss distance or position size.
- Use ATR (Average True Range):
The ATR is a great tool to measure market volatility and decide how much room to give your stop-loss.
---
7. Tracking and Reviewing Your Trades
- The power of a trading journal:
Every trade is a learning opportunity. Keep detailed records of your trades, including your reasoning, execution, and results.
- What to include in your journal:
- Entry and exit points.
- Risk-reward ratio.
- Mistakes or deviations from the plan.
- Lessons learned.
---
Conclusion: Plan the Trade, Trade the Plan
Risk management isn’t just a skill—it’s a habit. By understanding your risk-reward ratio, managing position sizes, using stop-losses effectively, and staying emotionally disciplined, you can protect your capital and increase your chances of long-term success.
Take a moment to reflect: How do you manage risk in your trading? Are there areas you could improve? Start implementing these strategies today, and watch how they transform your trading results.

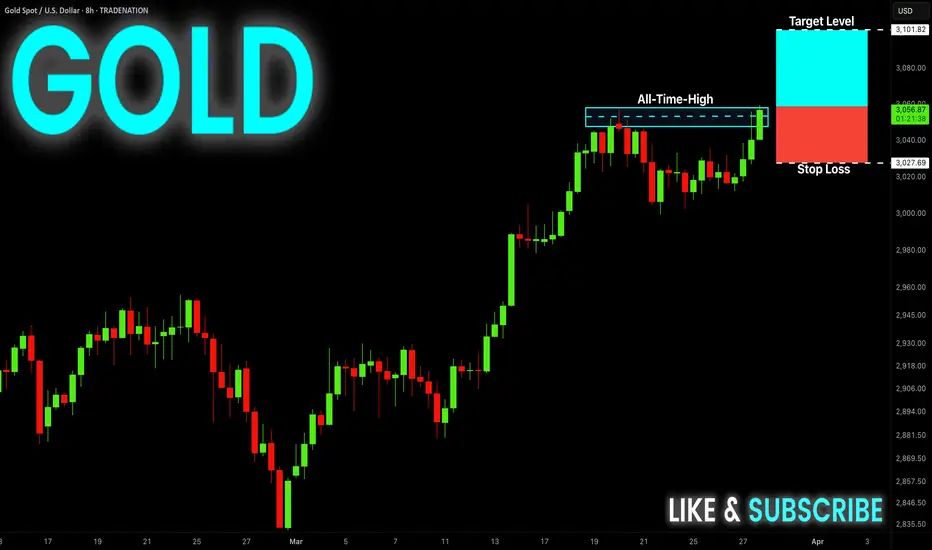
GOLD Free Signal! Buy!
Hello,Traders!
GOLD is trading in an
Uptrend and my bullish
Bias is reinforced by the
Trade war and a possible
Recession fear which comes
As a reaction to the Trump's
Car tariffs. So as the price
Is trying to break the all-time-high
Level of 3058$ we can enter
A long trade with the Take
Profit of 3101$ and
Stop Loss of 3027$
Buy!
Comment and subscribe to help us grow!
Check out other forecasts below too!
Disclosure: I am part of Trade Nation's Influencer program and receive a monthly fee for using their TradingView charts in my analysis.
CAD-CHF Free Signal! Sell!
Hello,Traders!
CAD-CHF has made some
Gains from the recent lows
Just as we expected but now
The pair is entering the
Horizontal resistance area
Around 0.6212 from where
We can enter a short trade
With the Take Profit of 0.6162
And the Stop Loss of 0.6233
Buy!
Comment and subscribe to help us grow!
Check out other forecasts below too!
Disclosure: I am part of Trade Nation's Influencer program and receive a monthly fee for using their TradingView charts in my analysis.

SPY Free Signal! Sell!
Hello,Traders!
SPY made a nice bullish
Move and will soon hit a
Horizontal support of 577.19$
From where we can enter
A short trade with the
Take Profit of 566.48$
And the Stop Loss of 583.38$
Sell!
Comment and subscribe to help us grow!
Check out other forecasts below too!
Disclosure: I am part of Trade Nation's Influencer program and receive a monthly fee for using their TradingView charts in my analysis.

POSI 1H Investment Long Aggressive Trend TradeAggressive Trend Trade
- short impulse
+ exhaustion volume
- resistance level
+ long volume distribution
Calculated affordable stop limit
1/2 1M take profit
1D Trend
"+ long impulse
+ support level
+ T2 level?
+ 1/ 2 correction
+ weak approach"
1M Trend
"+ long impulse
+ 1/2 correction
+ biggest volume expanding T1
+ support level
+ biggest volume manipulation"
1Y Impulse
+ long impulse

POSI 1H Swing Long Conservative Trend TradeConservative Trend Trade
+ long impulse?
+ exhaustion volume
+ support level
+ long volume distribution
Calculated affordable stop limit
1/2 1M take profit
1D Trend
"+ long impulse
+ support level
+ T2 level?
+ 1/ 2 correction
+ weak approach"
1M Trend
"+ long impulse
+ 1/2 correction
+ biggest volume expanding T1
+ support level
+ biggest volume manipulation"
1Y Trend
+ long impulse

F 1H Swing Long Conservative Trend TradeConservative Trend Trade
- long impulse
- volumed T2
+ support level
+ 1/2 correction
+ biggest volume Sp
Calculated affordable stop limit
1 to 2 R/R take profit
Day Trend
"+ long impulse
+ 1/2 correction
- neutral zone
- context direction short"
Month CounterTrend
"- short impulse
+ 1/2 correction
- unvolumed T1
+ support level
+ long volume distribution
+ biggest volume manipulation"
Year Trend
"+ long impulse
+ volumed T2 level
+ volumed 2Sp+
+ 1/2 correction
+ weak test"

NZD-USD Free Signal! Sell!
Hello,Traders!
NZD-USD made a bearish
Breakout of the key horizontal
Level of 0.5755 so we are
Bearish biased and we can
Enter a short trade with the
Target Level of 0.5695 and
The Stop Loss of 0.5775
Sell!
Comment and subscribe to help us grow!
Check out other forecasts below too!
Disclosure: I am part of Trade Nation's Influencer program and receive a monthly fee for using their TradingView charts in my analysis.

AUD-USD Free Signal! Buy!
Hello,Traders!
AUD-USD is falling down
And is locally oversold so
After the pair retests the
Horizontal support level
Of 0.6260 from where we
Can enter a long trade
With the Take Profit of 0.6292
And the Stop Loss of 0.6249
Buy!
Comment and subscribe to help us grow!
Check out other forecasts below too!
Disclosure: I am part of Trade Nation's Influencer program and receive a monthly fee for using their TradingView charts in my analysis.

EUR-CAD Free Signal! Sell!
Hello,Traders!
EUR-CAD made a bearish
Breakout of the key horizontal
Level of 1.5528 so we are
Bearish biased so we can
Enter a short trade with
The Take Profit of 1.5454
And the Stop Loss of 1.5576
Sell!
Comment and subscribe to help us grow!
Check out other forecasts below too!
Disclosure: I am part of Trade Nation's Influencer program and receive a monthly fee for using their TradingView charts in my analysis.

F 5M Daytrade Long Aggressive Trend TradeAggressive Trend Trade
- short impulse
+ volumed TE / T1 level
+ support level
+ long volume distribution approach
+ biggest volume 2Sp+
- no test
Calculated affordable stop limit
1 to 2 R/R take profit before 5M T2
Hour Trend
"- long impulse
- volumed T2
+ support level
+ 1/2 correction
+ biggest volume manipulation"
Day Trend
"+ long impulse
+ 1/2 correction
- neutral zone
- context direction short"
Month CounterTrend
"- short impulse
+ 1/2 correction
- unvolumed T1
+ support level
+ long volume distribution
+ biggest volume manipulation"
Year Trend
"+ long impulse
+ volumed T2 level
+ volumed 2Sp+
+ 1/2 correction
+ weak test"
