BEST RIPPLE STRATEGY IN CRYPTOCURRENCY TRADINGStep #1 Divide your 5-Minute Chart by Trading Sessions
Since we’re using a strategy only for day trading Ripple we need to make use of intraday charts. The ideal time frame to implement our Ripple strategy is the 5-minute chart. Also read the simple way of trading multiple time frames in forex.
The 15-minute chart will give us a better view of the overall price action and on the Ripple intraday trend.
Most cryptocurrency trading platforms can do this automatically and place a vertical line at the start of a new trading day. By doing this we can better visualize where the opening daily price is for each new trading session.
Step #2 If we’re on an Up-Day, Mark on your Chart the Time Window between 9 – 10 GMT Time
As we mentioned earlier we have found out through backtesting that the best time to buy Ripple is between 9 – 10 GMT. However, that’s only half of the equation because our statistics also show that the best time to buy Ripple is in the up days.
What do we mean by this?
We want to buy Ripple between 9 AM and 10 AM GMT. Ripple is trading above the opening price.
Our Ripple strategy is very intuitive!
If we buy Ripple above the opening price it means that we’re buying in the direction of the prevailing trend. Essentially, this is a trend following strategy deployed on intraday trends.
Step #3 Buy anywhere between the 9 – 10 GMT Time Window
From 9 to 10 GMT we have our window of buying opportunity. This time window also coincides with the London open and it’s the time when many cryptocurrency traders step into the market.
Now, depending on your trading skills and your experience you can fine tune your entry point within this time window.
Step #4 When day trading XRP Ripple hide your SL below the Opening Price
It’s quite intuitive why the logical place to hide your protective stop loss is below the opening price. Any deep below Ripple opening price will alter the bullish sentiment.
A sell-off below the opening price indicates that the buyers are weak and maybe we’re better off trying to buy Ripple on another day.
In order to make profit trading Ripple we also need a strategy to get out of our position.
We’re also proposing an unorthodox way when it comes to the take profit strategy which brings us to the next step.
Step #5 Take profit once the Price Travels the Same Price Distance it did from the opening price until 9 AM GMT
We’re going to suggest the best way to take profit on Ripple.
For an easy understanding of our Ripple take profit strategy we’re going to break down the strategy in two parts:
First, measure the price distance from the opening price to the high established between 9 to 10 AM GMT.
Second, project the same price distance to the upside measured from the low established between the 9 – 10 GMT window.
The same trading concept has been used multiple times in our various trading strategies. We recommend taking this approach because it incorporates the dynamics of the price rather than an arbitrary price on your chart.
Conclusion - Ripple Trading Strategy
It is said that Ripple has the potential to disrupt the SWIFT system for sending large amounts of money to different countries. Ripple doesn’t have much competition in this space and they have the right infrastructure to be the next Bitcoin. You can also read our best short-term trading strategy.
Takeprofit

EURUSD 4H BEARISH RANGE TRADEPair is in a range
Price failed a bullish breakout attempt
Watch Macd for confirmation of direction
Short Trade
Sell Stop @ 1.1327
1st Sell Take Profit @ 1.1295
2nd Sell Take profit @ 1.1255
Find your SL

USDCAD 4H SHORT TRADE - FOMC NEWS MOMENTUMI entered on a Sell limit @ 1.3295 after FOMC news
Sell Take profit @ 1.3237 from previous resistance level
Find SL above closest resistance level

NZDJPY 1D/1H ASCENDING TRIANGLE TRADESPrice is in an ascending triangle chart pattern
There were 4 failed Bullish breakout attempts of the triangle top
Price is falling to triangle bottom trendline
1H Short trade
Sell Stop @ 76.20
Sell TP at bottom triangle trendline
There will be a decision point at the bottom triangle trendline
Long trade
Price will rise up to the top triangle trendline
Bullish breakout of top trendline
Enter on a 15m break-hook-go chart pattern
1st Buy TP @ 77.42
2nd Buy TP @ 78.17
3rd Buy TP @ 78.68
Short trade
Price will have a Bearish breakout of the bottom triangle trendline
Enter on a 15m break-hook-go chart pattern
1st Sell TP @ 73.53
2nd Sell TP @ 72.04
Find your SL

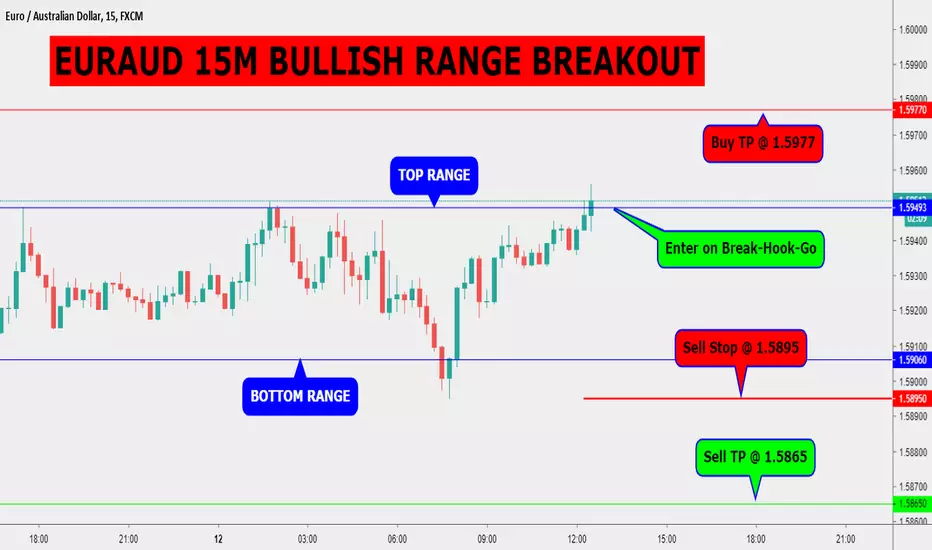
EURAUD 15M RANGE BREAKOUTPrice has been in a short range pattern
Long Trade
Enter on Break-Hook-Go @ 1.5949
Buy Take Profit @ 1.5947
Short Trade
Sell Stop @ 1.5895
Sell Tke Profit @ 1.5865
SL 30 pips from entry price
EUR/JPY Institutional Money is Long!Our team have identified that Institutional money is flowing into this pair LONG, we entered where we did as we always trade WITH the momentum of the market.
We have identified 3 major take profit zones:
1) +68 (half the position comes off here)
2) +137
3) +206
Risk management is KEY and our Stop Loss is strategically placed to avoid stop hunts and to give a great risk to reward ratio (32 points).

USDCAD 4H SHORT TRADEPair is in a range with a possible fake bullish breakout
Price is at a resistance trendline may bounce bearish
Short Trade
Sell Stop @ 1.3295
Sell Take Profit @ 1.3236
Find SL

Head and Shoulders & Triple Bottom CADJPYCADJPY has formed a triple bottom also in an inclining channel.
There is also a possible Head and Shoulders pattern forming.
Looking to buy up to the shoulder line at 84.40.
Tight stop below the support line 83.50


Cindicator Support and ResistanceSupport: .00000313
Resistance: .00000350
Stop: .00000309
Take Profit:
1) .00000327
2) .00000338
3) .00000343

GBPCAD 4H SHORT TRADEMarket ran up almost 400 pips in 15 bars
Price is touching a previous high
Possible pullback
Short Trade
Sell Stop @ 1.7445
1st Sell Take Profit @ 1.7395
2nd Sell Take Profit @ 1.7330
Find SL

USDCAD Harmonic pattern Analysis and StrategyThe formation of this harmonic pattern signaled us to buy the pair with our take profits on the green zones. Three of our take profits have been hit as result of our strategy. FX:USDCAD


EURUSD 1H BULLISH CONTINUATIONPossible Bearish Pullback
Buy Limit zone for 1st Bullish trade entry
1st Take Profit take 1/2 trade off @ 1.1376
2nd Bullish trade entry @ 1.1376
Finale Bullish Take Profit close all trades @ 1.1395
Find your SL

Z1P take profit!In my humble opinion we have entered a parabolic section on Z1P. looking at exiting at $1.535 for a few reason with a pull back to the 61.8% level!
Bump run on the longer term and on the intraday right now which is giving us a good exit signal, including MASSIVE BEAR DIV. on the RSI
All of these signals make it to tantalizing to pass up!
looking at an take profit exit and then a swing down entry for 1 last long!
Stay Vigilant
Good luck & happy trading homies!
DYOR!

BTCUSD: exit longsI'm sitting out of trading at the moment but I am charting daily!
as you can see we have CLEAR BEAR DIV. on our RSI indicating a pull back, also on the 4HR we can see negligible Shorts and Longs moving up through the roof. Price acction can not trend with sentiment over the long term, ie if LONGS are moving up price has to pull back...
i would look to short this price on a smaller leverage and enter in higher leverage if price action begins to increase. If you aren't interested in SHORTING than this is a good oppurtunity to exit BTC back into USD in another stable coin of your preference!! I would be looking to TP and swing down for a re-entry!
please stay vigilant!
happy trading homies!!
** I am glued to charts everyday trading and if not trading charting for fun! i will update when i can and i will upload when i can. My account has had limited uploads over this BEAR period however my charting and attention to trades has been as high and as full time as ever!!
DYOR.

EURCHF LONG AFTER THE SL stop loss was unfortunately hitten in the last operation cause the price didn't completed the ross hook pattern , right now the price is giving us another long opportunity on the trend line , let's see how the price move .

LTCUSD 30M BITCOIN INDICATOR SHORT TRADEOur Bitcoin Indicator finds trades on all markets and time frames
Our Bitcoin Indicator finds Entry Point - Target price - and Trailing Stop Loss
PM me if you have any questions that I can help you with

EURUSD 4H RANGE TRADE BULLISH LONGPrice broke out of range but failed.
Price stretched from ma's and returning
Macd stretched away from zero line and returning
Long Trade
Buy Stop @ 1.1315
Buy Take Profit @ 1.1366
SL below breakout candle back into range

EU - NU - AU 4H Range Bullish TradesDon't trade all three (EU, NU, AU) of these USD pairs
Watch this pair (AU) to make the move back bullish to ma's
If it does it confirms other two trades
EXIT - If AU falls back below range bottom - EXIT.
Market may not have timing right for bullish move yet
If market isn't ready on first move
then be ready to enter long again
on second or third bullish move attempt
NZDUSD 4H Long Trade
Buy Stop @ .6753
1st Buy Take Profit @ .6789
2nd Buy Take Profit @ .6810
SL below swing low
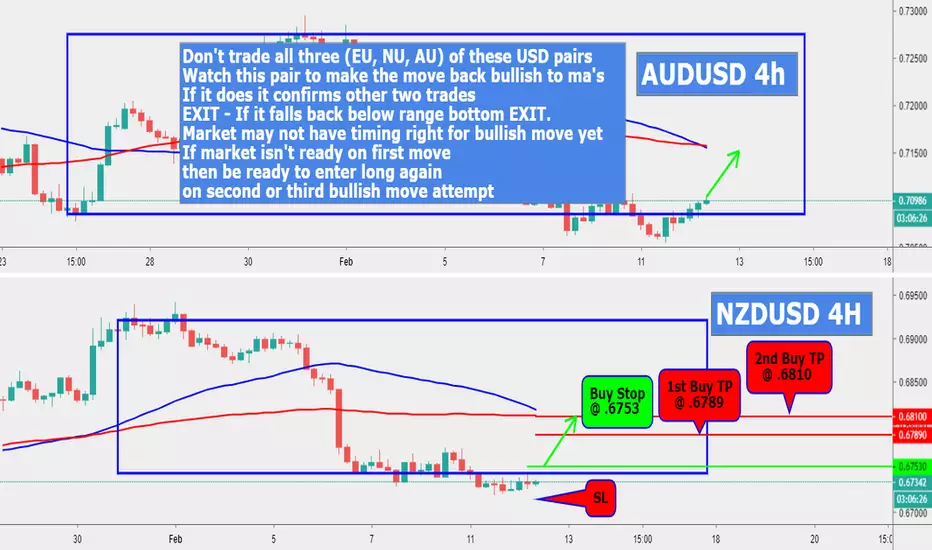
AUDUSD 4H TRADESPrice broke below range bottom and stalled
Price created smaller range box
Enter at breakout of either top or bottom of that smaller range box
Long trade take profit will be 100 sma
You determine Short trade TP
You determine SL

CADCHF Trend Analysis and Strategy The pair has broke the trend line on the 4 hour chart, so we are targeting the green and blue zones as our take profits. OANDA:CADCHF
