GBPAUD 4H RANGE TRADE LONGPrice has been in a range pattern
Price may be in a failed bearish range breakout
If price returns back into the bottom range
Long Trade
Buy Stop @ 1.7930
Buy Take Profit is the 100 sma
SL below swing low
Watch Macd to cross above Red Signal line and Zero line for bullish confirmation
Takeprofit

MACD TREND FOLLOWING STRATEGYEURUSD 30M CHART
This strategy is a setup for a Long continuation trade
(Rules for A Buy Trade)
Step #1: Wait for the MACD lines to develop a higher high followed by a lower high swing point.
This is an unorthodox approach to technical analysis. But, we at Trading Strategy Guides.com are different. We don’t mind doing uncomfortable things if that’s what it takes to succeed in this business.
The first rule of thumb to recognize a swing high on the MACD indicator is to look at the price chart if the respective currency pair is doing a swing high the same as the MACD indicator does. A higher high is the highest swing price point on a chart and must be higher than all previous swing high points. While a lower high happens when the swing point is lower than the previous swing high point.
Step #2: Connect the MACD line swing points that you have identified in Step #1 with a trendline
This step is quite simple, right?
At this point, we really ignored the histogram because much of the information contained by the histogram is already showing up by the moving averages. Look at the price action now and compare it to our MACD trendline we drew early. We can clearly notice that the MACD contains the price action much better and reflects the trend much clear.
But, at this point, we’re still not done with the MACD indicator, which brings us to the critical part of our MACD Trend Following Strategy.
Step #3: Wait for the MACD line to break above the trendline. (Entry at the market price as soon as the MACD line breaks above)
When the MACD line (the blue line) crosses the signal line (the orange line) it’s an early signal that a bullish trend might start. However, if trading would be that easy we would all be millionaires, right? And that’s the reason why our MACD Trend Following Strategy is so unique. We’re not only waiting for the MACD moving averages to cross over but we also have our other criteria for the price action to break aka the trend line we drew early.
This is a clever way to filter out the false signals, but you have to be equipped with the right mindset and have patience until all the piece of the puzzle come together. If you were to trade just based on the MACD crossover over time you’ll lose money because that’s not a reliable strategy. But if you use the MACD indicator along with other cafeterias such what this strategy tells you to do, you will find great trade entries on a consistent basis.
Step #4: Use Protective Stop Loss Order. (Place the SL below the most recent swing low)
Now, that you already know how to enter a trade at this point you have to learn how to manage risk and where to place the SL. After all, a trader is basically a risk manager.
You want to place your stop loss below the most recent low, like in the figure below. But make sure you add a buffer of 5-10 pips away from the low, to protect yourself from possible false breakouts.
Did you notice?
The MACD Trend Following Strategy triggered the buy signal right at the start of a new trend and what is most important the timing is more than perfection. We bought EUR/USD the same day the bullish trend started.
Now, what this has to do with the SL?
Basically, a good entry price means a smaller stop loss and ultimately it means you’ll lose a lot less comparing it with the profit potential, so a positive risk to reward ratio.
Step #5: You determine your Take Profit or when the MACD crossover happens in the opposite direction of our entry
Knowing when to take profit is as important as knowing when to enter a trade. However, we want to make sure we don’t use the same trading technique as for our entry order. When the MACD line (the blue line) crosses the signal line (the orange line) we want to close the position and take full profits.
Before taking profits, it’s important to wait for the candle close – either the 4h or the daily candle – depending on the time frame you trade so you make sure the MACD crossover actually happens.
Note** The above was an example of a buy trade using the MACD Trend Following Strategy. Use the exact same rules – but in reverse – for a sell trade.

NZDUSD 4H RANGE TRADESPrice is above 100 sma
Price could continue up to the 50 sma
Price usually moves sideways awhile when in-between 100 and 50 sma
Price may breakout above 50 sma and retest range top
Enter bullish breakout on a 15m chart with a break-hook-go candle pattern
Price could fail above 100 sma and cross below it again
Sell Stop @ 1.6725
Sell Take Profit @ 1.6690
Find appropriate SL

ES1!: ABCD completion with negative MACD divergenceThis is a follow-up from my 27th Dec call for a counter-trend rally to the 2,700 region. Right now the ES1! is 59 points away from the target and:-
#1 At the 50% retracement level
#2 Completed an ABCD from the trough
#3 Negative divergence between the MACD and price action.
#4 There is a little tiny wedge for which the upside target has been achieved.
Being long or buying at these levels simply ignores the fact the Donald has not left any room for negotiation either on Chinese trade or the government shutdown. His goals in both instances are so extreme that anything less would result in a roasting by Fox News while it is impossible for the Chinese or the Democrats to agree to the Donald's more extreme demands. The Dealmaker has boxed himself in and thrown away the keys.
In other words, it is time to take money off the table and wait for the next trade.

GBPUSD 4H SHORT TRADEPair has not created a new high
Macd is below Red signal so bearish bias trade
800 sma is creating a resistance level
Price may re-test 800 sma - expect failure and price to continue bearish bias
Short Trade
Sell Stop @ 1.2829
1st Sell Take Profit @ 1.2799
2nd Sell Take Profit @ 1.2770
3rd Sell Take Profit @ 1.2736
Take 1/3 profit at 1st and 2nd TP levels
Close trade is Mace goes above Red signal line
SL above closest fractal high

BITCOIN INDICATOR - ALL MARKETS/TIME FRAMES - BOTH DIRECTIONSBitcoin Signal Indicator trades all markets and time frames
Bitcoin Signal Indicator trades both directions
Bitcoin Signal Indicator finds Entry Point - TP - SL
Bitcoin Signal Indicator SL will adjust to a trailing stop as trades profits
PM me if you have any questions i can help you with on our Bitcoin Signal Indicator

CAD/JPY Short. Waiting to breakout downside.
If candle at 1h close below 81.700 sell with target 81.150 and stop 82.000!

EURJPY 4H BEARISH BREAKOUT TRADEPrice has Bearish Trade bias
Macd over bought
Macd below Red signal line
Price below Ma's
Sell Stop 2 124.20
Sell Take Profit @ 122.85
Place SL above 50 sma

eur/usd falling wedgeeur/usd seems to be forming a falling wedge and the wicks seem to be touching the support more than once so I would assume that the market will drive up to higher prices.
I've added two take profits to levels where I think price may touch and then go down.

USDCAD 4H SHORT TRADESPrice is moving between 50 sma and 100 sma
Price may rise back to 50 sma again before falls to 100 sma
Sell Limit @ 1.3567
Sell Limit TP - take 1/2 profit @ 1.3480
Let rest of trade ride
Price can currently fall to 100 sma and break below
Sell Stop @ 1.3480
1st Sell Stop TP @ 1.3427 - take 1/2 profit let rest ride
2nd TP close all trades @ 1.3364
SL placed above high
Adjust SL as price falls

$INP Sell Day Trade StrategyINP had a great increase on the 31st.
However currently exhibiting:
MACD: overbought
RSI: overbought
Strong indication for a down trend, great opportunity to sell and take a profit if entered at opening price @0.040
Will be monitoring movements, depending on popularity and demand proposed strategy is as follows:
Enter: @0.049
Take-profit: @0.056 (at least)
Stop Loss: @0.045

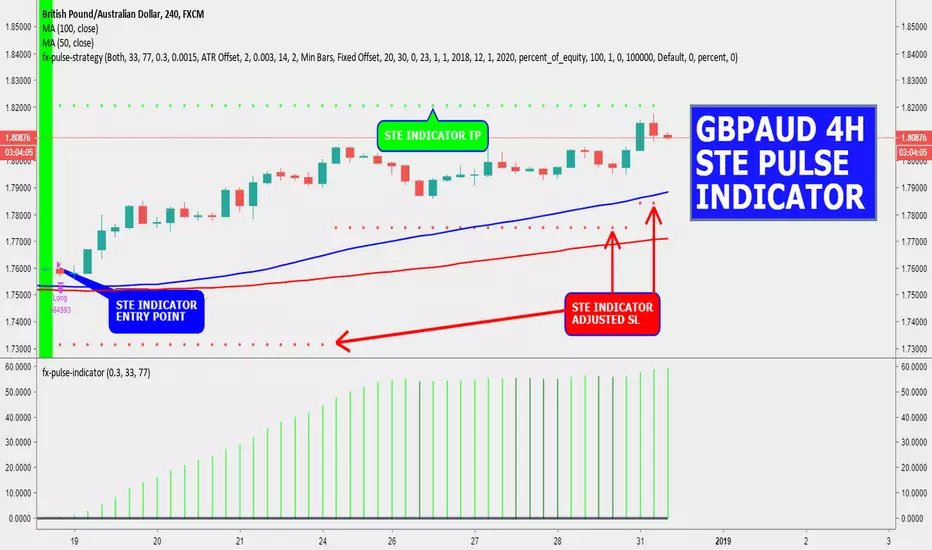
GBPAUD 4H STE PULSE INDICATOR STRATEGYSTE PULSE INDICATOR FOUND A LONG TRADE
STE PULSE INDICATOR FOUND ENTRY POINT - SL - TP
STE PULSE INDICATOR ADJUSTED SL AS PRICE CONTINUED TO RISE
PM me if you have any questions I can help you with concerning this strategy indicator

BITCOIN SIGNAL STRATEGY INDICATOR FINDS TRADES BOTH DIRECTIONSBitcoin Signal Strategy Indicator works on all Crypto pairs
Bitcoin Signal Strategy Indicator works on all markets and time frames
Bitcoin Signal Strategy Indicator finds entry and exit points
Based on a ATR trading strategy
PM me if you have any questions I can help you with on this great indicator

AUDUSD short according to my Clever Climb5 strategyHi everyone, it's been a while since I've been analyzing here on tradingview, but not because I'm not trading but because I'm testing and experimenting with various ideas and above all operational strategies, one of them Clever Climb 5.This strategy is giving me good results and you can watch it here www.mql5.com The results are quite evident and tangible and thanks to the use of my strategy I wanted to share with you my short entry on AUDUSD.I have identified on the chart two target levels and a stop level. You can enter with two shorts or splitting to the possible achievement of the target1 the only short closing half of the position.As you can see from the page that I have indicated, over half of the open transactions have been closed at a loss, but the profit accrued is still very high, this demonstrating the fact that with this method I manage the losses and let the profits run.The sample for now covers more than 130 trades, open and closed in less than two weeks, and so it is not really just a few operations. In any case, we'll see how it will proceed. With this I greet you and wish you a good end of the year but above all a good start to all of you!

BITCOIN SIGNAL STRATEGY INDICATOR WORKS ON ALL CRYPTO PAIRSBitcoin Indicator works on all crypto pairs
Bitcoin Indicator works on all markets and time frames
Bitcoin Indicator shows Entry Point - SL - TP
Sell Entry Point @ .4376
Sell TP @ .3737
SL shown
PM me if you have and questions on the versatile indicator

BCHUSD 1H BITCOIN INDICATOR LONG TRADE STRATEGYBitcoin Indicator found a long trade entry
Adjusted SL and TP shown
Bitcoin Indicator works on any market and time frame
If you have any questions PM me and i will be happy to help

EURAUD 4H SHORT TRADEPrice is moving back to the ma's
Price may retrace some before it continues down
Sell Limit @ 1.5760
Sell Stop 2 1.5720
Sell Taker Profit @ 1.5656
Find your SL
Watch Macd for direction

EURAUD 1H BICTCOIN INDICATOR STRATEGYBitcoin Indicator works on all markets and time frames
Bitcoin Indicator shows entry point, take profit, stop loss that becomes an adjusted trailing stop
PM me if you have any questions on this great indicator

AUDCAD 30M RENKO TRADING STRATEGY #2Renko Trading Strategy #2
Another profitable Renko strategy you can use is to focus only on the bricks.
No additional technical tool is required for this system.
We’re going to explore a very simple and yet very powerful Renko chart pattern that incorporates the wicks. This Renko price pattern looks for two consecutive bricks of the same color and both bricks have wicks.
The location of this Renko pattern doesn’t really matter. It can be at the end of a trend or it can be in the middle of the trend. This pattern has a very high rate of success if traded in the right context. You have to look around this two brick pattern and make sure the blocks are not moving back and forth within a trading range.
If that’s not the case then you have a green light to take the signal generate by this trade setup.


$WTICOUSD Call Order Filled. Tweezer Bottoms. 1DTFCall order filled for $WTICOUSD. Support and resistance trade. Tweezer bottoms candles at previous support. See chart for further details.

HOW TO TRADE AN EMA STRATEGY ON THE EURAUD 4HStep #1: Plot on your chart the 20 and 50 EMA
The first step is to properly set up our charts with the right moving averages. We can identify the EMA crossover at the later stage. The exponential moving average strategy uses the 20 and 50 periods EMA .
Most standard trading platform come with default moving average indicators. It should not be a problem to locate the EMA either on your MT4 platform or Tradingview.
Now, we’re set to go a look more closely to the price structure. This brings us to the next step of the strategy.
Step #2: Wait for the EMA crossover and for the price to trade BELOW the 20 and 50 EMA .
The second rule of this moving average strategy is the need for the price to trade BELOW both 20 and 50 EMA . Secondly, we need to wait for the EMA crossover, which will add weight to the bullish case.
We refer to the EMA crossover for a SELL trade when the 20-EMA crosses BELOW the 50-EMA.
By looking at the EMA crossover, we create an automatic buy and sell signals.
Since the market is prone to false breakouts, we need more evidence than a simple EMA crossover. At this stage, we don’t know if the bearish sentiment is strong enough to push the price further after we sell to make a profit.
To avoid the false breakout, we added a new confluence to support our view. This brings us to the next step of the strategy.
Step #3: Wait for the zone between 20 and 50 EMA to be tested once since the market goes down much faster, we sell on the 1st retest of the zone between 20 and 50. After the EMA crossover happened, then look for selling opportunities.
The conviction behind this moving average strategy relies on multiple factors. After the EMA crossover happened, we need to exercise more patience.
Never forget that no price is too high to buy in trading. And no price is too low to sell.
Note* When we refer to the “zone between 20 and 50EMA,” we actually don’t mean that the price needs to trade in the space between the two moving averages.
We just wanted to cover the whole price spectrum between the two EMAs. This is because the price will only briefly touch the shorter moving average (20-EMA). But this is still a successful retest.
Now, we still need to define where exactly we are going to sell. This brings us to the next step of the strategy.
Step #4: Sell at the market when we retest the zone between 20 and 50 EMA for the first time.
We go ahead and sell at the market price. We now have enough evidence that the bearish momentum is strong to continue pushing this market lower.
Now, we still need to define where to place our protective stop loss and where to take profits. This brings us to the next step of the strategy.
Step #5: Place the protective Stop Loss 20 pips above the 50 EMA
After the EMA crossover happened, and after we had two successive retests, we know the trend is down. As long as we trade below both exponential moving averages the trend remains intact.
In this regard, we place our protective stop loss 20 pips above the 50 EMA . We added a buffer of 20 pips because we understand we’re not living in a perfect world. The market is prone to do false breakouts.
The last part of our EMA strategy is the exit strategy. It is based again on the exponential moving average .
Step #6: Take Profit once we break and close above the 50-EMA or you determine the TP strategy
In this particular case, we don’t use the same exit technique as our entry technique, which was based on the EMA crossover.
If we waited for the EMA crossover to happen on the other side, we would have given back some of the potential profits. We need to consider the fact that the exponential moving averages are a lagging indicator.
The exponential moving average formula used to plot our EMAs allow us to still take profits right at the time the market is about to reverse.
Note** The above was an example of a SELL trade. However, because the market goes down much faster, we sell on the 1st retest of the zone between 20 and 50. After the EMA crossover happened.Use the same rules – but in reverse – for a BUY trade except wait for 2 retest of 20/50 ema zone then enter on the 3rd retest. The two successful retest of the zone between 20 and 50 EMA gives the market enough time to develop a trend.
