Zcoin (XZC) Cryptocurrency Strategy – 3L-R Trade PatternZcoin XZC 30m
The 3L-R reversal is a four-bar pattern and it means three lows (3L) followed by a reversal (R).
The main characteristics of this reversal chart pattern are the three consecutive lower low candles. The high price of these three particular candles doesn’t matter; the only thing that matter is that each low is lower than the prior low.
The fourth bar of the reversal chart pattern needs to have the high bigger than the highest high of the previous 3 candles. We’re not concerned about the low of the last bar.
Step #1: Identify Three Consecutive Lower Low Candles
The first component of this reversal pattern is the three consecutive lower low candles. At this point we’re not concerned about the highs of the three candles.
However, you’ll notice that most of the time each consecutive high is also lower than the previous high.
What is great about the Zcoin (XZC) cryptocurrency strategy is the fact that it’s designed to catch market reversals right at the moment they occur.
Step #2: The fourth candle breaks above the first bar high in the reversal pattern
The immediate candle after the three lower lows needs to be a bullish candle and secondly it needs to break above the first bar high in the pattern.
Normally, the highest high of the first three bars is made by the first bar, however, in the event that this is not the highest high we need to wait until the fourth candle breaks above the highest high of the previous 3 candles.
Note* It’s important that the 4th candle breaks above the first candle high, not the 5th or the 6th because that will invalidate the reversal pattern. We need to be very precise when trading reversal patterns like the 3L-R pattern.
Even though we said that we’re not concerned with the low of the fourth bar, it does matter if the low is higher than the third bar’s low. Through our backtesating results we have found out that this yields better trading performance.
Step #3: How to buy Zcoin: Buy if the fourth candle closes above the last three candles highest high
Before we pull the trigger and buy cryptocurrency Zcoin we need for the fourth candle to also close above the first candle high or above the last three candle highest high point, whichever that might be.
Now is the time to convert this reversal setup into profit and buy Zcoin when the fourth candle closes above the last three candles highest high.
Step #4: Place your protective Stop Loss below the 3L-R pattern low
Trading reversals have lots of benefits and among other things it offers us the possibility to really use a very tight stop loss. If the trade doesn’t work the market will tell you very quickly and it will produce only very little damage to your account balances.
Like with any reversal pattern, if you want to keep the stop very tight you need to place your protective SL below the reversal pattern aka below the 3L-R pattern low.
Step #5: Take profit should be at least two times bigger than your Stop Loss
If you trade this reversal pattern on intraday charts, it’s best to simply take profit once the Zcoin price will give you a return that is two times more than your stop loss. In other words, you have a risk to reward ratio of 1:2.
Alternatively, if you use higher time frames the exit strategy should be based on a trailing stop.
Note** the above was an example of a BUY trade using the best Zcoin XZC cryptocurrency strategy. Use the same rules for a SELL trade – but in reverse.
PM me if you would like to read the complete strategy.
Takeprofit

NZDUSD 4H SMA TRADESPair is at the bottom above the 50 sma
Price can move up to the 100 sma
Long trade
Buy Stop @ .6800
Long Take Profit @ .6858
You place SL
Price can break below 50 sma
Short trade
Sell Stop @ .6773
Sell Take Profit @ .6691
You place SL

GBPAUD 4H SHORT TRADEPrice is in between 50 sma and 100 sma.
Price fell half way to 100 sma and returned to 50 sma
Price should fall toward 100 sma
Price at 100 sma will either cross below 100 sma or consolidate sideways
Sell stop below 100 sma @ 1.7795
Take Profit @ 1.7728
SL as shown
If price crosses above 50 sma trade void

XVGBTC a good chance to open long positionVerge is one of the top coins, which can demonstrate good growth during 2018. Decrease to Fib 0.786 support level opens opportunity to open long position. Today, most markets are down, many other top coins also provide a good entry opportunity, but first of all we recommend to pay attention to XVG.
Bullish divergence of 4-hour scale can push the market to test the 0.00000725 level within a week.

SCBTC Wave of growth is comingIn the 1-day timeframe, the chart looks positive and demonstrates good trading opportunities. Stoch RSI indicates a small decrease right to our buying zone. The majority of technical indicators show that there should be a new wave of growth to the mentioned in the signal targets. SMA, EMA in all ranges are very bullish, Bull-Bear power, HMA are in the buy state. MACD levels confirm the upcoming growth. Fundamentals are also great the coin is listing on OKex in 3 days.
Risk are medium as there are only systematic and inherited from the whole crypto market caused by BTC fluctuations due to decrease of market capitalization.Coin specific risks are currently very low

USDCAD 4H SHORT TRADESPrice has broken below 50 sma and went about half way
Price could continue to 100 sma or rise back up to the 50 sma
Sell limit placed if price returns to 50 sma
Sell Stop placed if price continues to 100 sma
SL placed
Take Profit is the 100 sma
Watch Macd

USDJPY Short Trade SetupUSDJPY moved as we expected it to. Our long trades made good profit and we are now looking for the entry to the downside. We can see an impulse down to A on the left and then a 3 wave corrective structure up to B which has now broken to the downside. I am looking for a retest of the structure for a short entry where my target will be C which should break the previous low at A. There I will start looking for signs of a reversal and a long entry to the upside where we could see a break of the highs.

EURUSD 4H RANGE TRADESPair is in a range
Price fe back below 100 sma
Price will either down to 50 sma
Or price will cross above 100 sma and return to the top of range
If price falls and crosses 50 sma it will continue to bottom of range
Determine your own SL

HOW TO TRADE ELLIOTT for BEGINNEERSStep #1 Wait until you can spot at least a 3 wave Elliott Wave sequence
Since we always advocate trading in the direction of the trend, as explained above, we’re only
attempting to catch the last wave 5.
So, in order to find our Elliott Wave entry points we need to let the market tip his hands off and
wait to develop the first 3 waves of a five Elliott Wave pattern
We must verify that each wave complies with the Elliott Wave strategy rules in order to confirm
the validity of our Elliott Wave count. In the figure above, we’ve spotted a bearish Elliott wave
count that complies with the Elliott Wave strategy rules, which means we’re looking for a sell
setup.
Step #2 Sell between 38.2% and 50% Fibonacci retracement of Wave 3
One of the Elliott wave rules states that, ideally, wave 4 should retrace between 38.2% and 50%
Fibonacci retracement of wave 3. Our Elliott Wave entry points are at 38.2% because we never
know for sure how far the market will retrace and we don’t want to miss the move.
We’re pretty much sure that with experience you can fine tune your Elliott Wave entry points and
get even better entries.
Now, we can note that wave four retrace a little bit above the 50% retracement. Since the market
is never a perfect place where rules are respected to the pip there will always be small
variations and the Elliott Wave strategy is no exception from the rule
Step #3 Place the Protective Stop Loss few pips above the Wave 1 Ending Point
In the section “How to trade Elliott Wave” we highlight the importance of wave 4 never entering
into the wave 1 territory. In this regard, it’s smart to place our stop loss exactly where the Elliott
Wave pattern will be invalidated.
Step #4 Take Profit when Wave 5 is equal to Wave 1 or when we break below
wave 3
With the Elliott Wave strategy is all about experimenting new trade ideas and we encourage you
to find your own set of rules because once you have a firm understanding how to trade Elliott
Wave you can develop many Elliott Wave strategies around it.
In this regard, we don’t have a set in stone take profit strategy because the Elliott Wave strategy
looks to maximize profits and the only way you can do this is through flexibility because no two
Elliott Wave structure is the same
Note** The above was an example of a SELL trade… Use the same rules – but in reverse – for a
BUY trade.
PM me if you want to read the complete strategy.

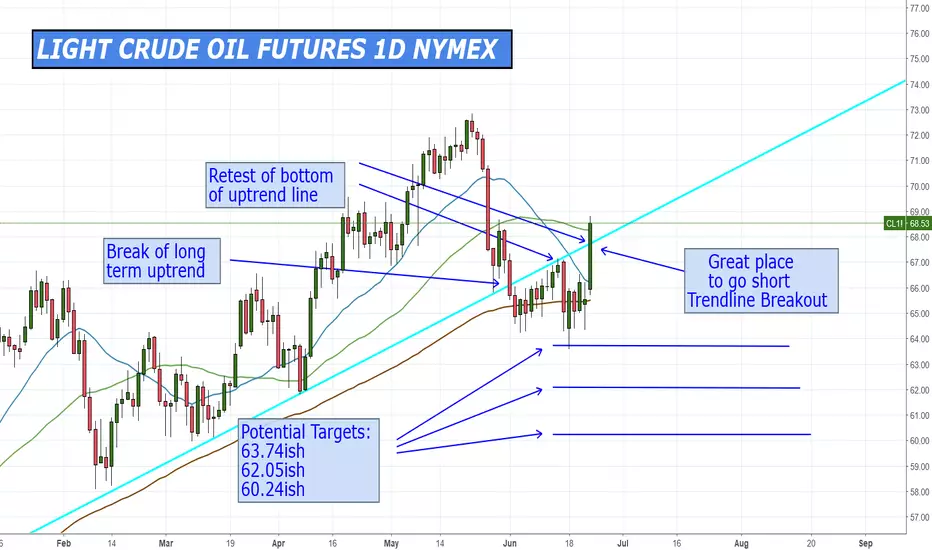
Crude is retesting the broken up trend lineCrude broke a year long up trend line earlier this month. It has now tested the bottom of the up trend line several times and looks ripe for drop.
Take your loss on a daily candle close back above the trend line .
Target the three indicated levels. You can even hold a portion of the trade for the June 2017 low.
Follow your stops as the trade moves in your direction.
Be sure to size your trade according to your risk parameters. NEVER BET THE FARM!
No trade is guaranteed 100% to work. You NEVER know what the market will do.
Your first job is to protect your trading account.
ADAUSD 1h CARDANO STRATEGYStep #1: Cardano ADA price needs to trade BELOW the 200-day moving average
The first condition that Cardano requires to satisfy is to trade BELOW the 200-day moving average.
When price trades BELOW the 200-day moving average we know we have a strong premise for a bearish trend to be put in place.
The more time Cardano price spends below the 200-day moving average and the biggest the distance between the Ada price and the 200-day moving average the stronger the trend is.
Step #2: Volume needs to be above average and twice as much volume compared with previous volume bars needs to come in
We need to look for instances when the volume bars are above the average volume (the red moving average). But this is not all; we also need the buying volume to be twice as much as previous volume bars.
Wait for trading situations where the selling volume is increasing considerably. This really shows institutional buying that has the power to move the Ada coin price.
Step #3: After volume has increased, sell at the opening of the next candle
When to sell Cardano ADA is quite intuitive if you have followed this cryptocurrency step-by-step guide.
The moment we see institutional selling presence we want to be sure we’re not left out. In this regard, after the volume has increased, we sell at the opening of the next candle preceding the big volume candle.
Usually, you’ll be selling right after the first bearish candle that often is the starting point of a new trend. Don’t be afraid to sell on the way down as this will pay handsomely in the long run.
Step #4: Place protective Stop Loss above the 200-day moving average
Hide your protective stop loss above the 200-day moving average.
A market that has a strong bearish trend should not drop above the most powerful moving average aka the 200-day moving average. By hiding your stop loss above the 200 moving average, we’re minimizing risk as much as possible.
Note* as the trend progresses you can also trail your stop loss below the 200-day MA.
Step #5: You decide or Take Profit when we break and close above the 200-day Moving Average
The 200-day moving average can serve us as a significant trigger for our exit strategy.
When we break above the 200 moving average, that’s the first sign that the trend is about to change the tide. When these happen make sure you take profits.
Note** the above was an example of a SELL trade using the Cardano trading strategy. Use the same rules for a BUY trade – but in reverse.
PM me if you want to read the complete strategy

USDJPY 15M DONCHIAN CHANNEL STRATEGYStep #1: Attach the Donchian channel indicator to your chart. Preferred setting 20 periods.
For the purpose of this example, we’re going to plot the Donchian channel on the 15-minute time frame. The preferred Donchian channel settings is 20-periods, which means that the channel lines will be calculated based on the price action from the last 5 hour candles
Note* The Donchian indicator is a free pre-build technical indicator that comes free with most trading platforms.
Step #2: Wait until the price crawls along the upper Donchian Channel. The price should not go below the middle band during this stage.
It’s quite easy to visualize the Crawling Along pattern. When the price action touches the upper Donchian channel, and it stays glued to the upper line, we create the price effect where the price looks like it’s crawling along the top Donchian line.
If you think in terms of supply and demand, when the price is crawling along the upper Donchian channel, without departing too far away it means there are lots of buyers that try to push the price higher. This eventually will lead to seller capitulating once the breakout happens.
Another characteristic of the Crawling pattern is that during this stage, the price shouldn’t go below the middle Donchian band.
Note* The closer the price action moves along the upper band, the stronger the trend is.
If you spot this type of price action, then you know this day trend has a big potential for following through.
Step #3: Buy1 when the price pulls back to the middle Donchian band. Buy2 when the price pulls back to the lower Donchian band.
The channel width gives us a measurement of the market volatility. When we have high volatility in the market, this will be shown on the chart by wide channel bands, whereas low volatility will be displayed on the chart by a narrow channel.
Like with all technical indicators the Donchian channel can be subject to false signals from whipsaws and sizeable market swings. Breakouts are very hard to trade, and that is the reason why we prefer to enter on pullbacks.
We recommend splitting your trade into two parts as this will give you a better average entry price.
The first buy order is deployed when the price pulls back to the middle Donchian band, while the second buy order is deployed when the price retraces all the way to the lower Donchian band.
Our entry strategy will give us the opportunity to implement a proper risk management
This entry strategy is a good way of framing a trade. So, you have a very specific entry point
By sticking to this entry rules, you will realize this is not a bad trade to take because you trade in the direction of the prevailing trend
Step #4: Hide your protective Stop Loss below the lower Donchian band
Your stop loss can be placed below the lower Donchian band. The catch is that you need to move to the left side of the chart and find the first part of the lower Donchian band where it is flat.
You’ll find that often times the Donchian channel will plot perfectly flat lines. This can provide us with excellent spots to hide our stop loss.
Step #5: Take profit at the end of the day or if you want to ride the trend more take profit when
The beauty of the Donchian trading strategy is that you can apply multiple exit strategies so you can maximize your profits.
Now, that we know that the supply and demand balance is skewed to the upside, we can expect buyers to step in far quicker on retracements than they have before. This can indicate that we’ll have a buy explosion to the upside.
The first proposed exit strategy is to liquidate your position at the end of the day. Since we’re trying to take advantage only of the intraday trends we don’t want to have any overnight exposure.
Secondly, you can wait until the price breaks below the most recent flat lower Donchian band.
Note** the above was an example of a BUY trade using our Donchian Channel Strategy PDF. Use the same rules for a SELL trade – but in reverse.

DOGEUSD DAY STRATEGYStep #1: Wait until you can spot a bar that has its daily range smaller than the previous three days
The first rule requires you to have the patience until the Nr4 pattern develops on the Dogecoin chart. When we have a daily trading range that is narrowed than the previous trading ranges it means that the price is contracting.
Based on our backtesting results we have found out that there is a high probability of a trend move after you spot this type of contraction. This is kind of a general rule because the markets do move from periods of contractions to periods of expansion.
This is the reason why this short-term price pattern is so powerful.
Step #2: Mark the High and the Low of the 4th day and switch to the 1 hour time frame
Our trade is taken the next day after the Nr4 pattern showed up. In order to have a clear view of the short-term price action we need to switch our focus to the 1 hour time frame. Before you switch the time frames make sure you mark on your chart the high and the low of the 4th day.
Step #3: How to buy Dogecoin: Buy only if the breakout of the Nr4 high happens during the first 5 trading hours.
We use the Opening Range Breakout technique to time the market and have an effective trade entry. The ORB is even more profitable if it occurs after inside days that have a smaller trading range than the previous 3 days.
Our Dogecoin trade doesn’t have an inside day, but nevertheless we want to buy only after we break above the Nr4 day high. Also, we want to make sure the breakout happens during the first five trading hours of the next day.
Trades based on the ORB – Nr4 pattern will show you a profit instantly.
Now, if the trade is not showing you a profit right away than your trade becomes more vulnerable. As a general rule, if after the first trading hour your trade is not in the green, you can safely close the trade at the market.
Of course, you can only do that if your stop loss hasn’t been triggered in the meantime.
Step #4: Place your protective Stop Loss below the Nr4 day low
You can hide your protective stop loss below the Nr4 day low. Alternatively, you can also place your stop loss below the current day low as this will give you a better risk to reward ratio.
The ORB – Nr4 pattern tends to precede strong trend day activity, so your stop loss should be rarely hit. Both of these patterns can be traded individually, but when combined they tend to produce even more powerful trades.
Step #5: Take profit at the close of the first 1-hour bearish candle
Our take profit strategy is fairly easy and it’s slightly modified from the original strategy highlighted in the “Day Trading with Short Term Price Patterns and Opening Range Breakout” book written by Toby Crabel.
Even though the ORB pattern tends to lead to trend trading days we’re more conservative and want to quickly take profits. So as soon as the first bearish candle shows up we close the trade and enjoy our daytrade profits.
Alternatively, you can keep the trade open until the end of the day if you want to extrapolate more profits from the cryptocurrency market.
Note** the above was an example of a BUY trade using our Dogecoin cryptocurrency strategy. Use the same rules for a SELL trade – but in reverse.
PM me if you want to read the complete strategy.

NEM XEM RSI CRYPTO STRATEGYRate of Change indicator or simply put it the ROC indicator is another momentum indicator and as the name suggests it measures the rate of a crypto’s change in price and predicts future price movements.
Our RSI is applied over the ROC. So the RSI line is derived from ROC not the price.
Step 1 - Step #1: Wait until the RSI has a value of less than 30
At this stage, we need to use the RSI readings from the daily chart. Just wait until the RSI has a value of less than 30. You’ll have to wait for the daily close to get the RSI reading.
Obviously, this means that you’ll always buy XEM the next day.
Once you spot an RSI reading less than 30 we switch to a lower time frame which brings us to the second rule of the Nem (XEM) cryptocurrency strategy.
Step #2: Switch to the 1-hour chart and wait again until the RSI shows a reading of less than 30.
The second rule that needs to be satisfied before pulling our trigger is to wait again for the RSI indicator to show a reading of less than 30 but this time on the 1-hour time frame.
Remember, this should be the next day after the RSI posted less than 30 readings on the daily chart.
Step #3: How to buy XEM: Buy at the opening of the next candle after the RSI went below 30 levels.
The original momentum Pinball pattern uses a different entry method. We have done some backtesting and found that we can achieve superior returns if we follow a different entry strategy.
How to buy XEM with our cryptocurrency trading strategy is much more eloquent because it uses the concept of multiple time frame analysis.
Buy at the opening of the next candle after the RSI posted a reading of less than 30.
Step #4: Place your protective Stop Loss below the previous day low
After the buy EOS order is triggered, we need to have a strategy to protect our bottom line.
The best Nem XEM price to hide your protective stop loss is below the previous day low. The Nem XEM price should not come to this point.
Step #5: Take profit should be 2 or 3 times larger than your stop loss
Again, our exit strategy is slightly different than the original momentum Pinball pattern.
Be sure to close your Nem trade once the take profit is two or three times larger than your stop loss.
Alternatively, you can use the initial exit strategy which requires taking profits when we break above the previous day high. Don’t limit yourself to either of these two strategies, but instead make the best out of them and use the one that suits the most the current trading environment.
Note** the above was an example of a BUY trade using our Nem (XEM) cryptocurrency strategy. Use the same rules for a SELL trade – but in reverse.
PM me if you want to read the complete strategy.

GBPUSD 1H STRIKE TRADER ELITE PULSE INDICATOR SIGNALSStrike Trader Elite Pulse Indicator is a Macd based signal indicator
Green vertical line indicates Macd signal
Entry is based on a delayed amount of pips before a Buy Stop order Yellow line is painted on chart
Buy Stop Loss Red line is painted on chart from a pre-determined amount of pips from entry
Buy Take Profit Green line is painted on chart from a pre-determined amount of pips from entry
PM me if you are interested in reading about this indicator

NZDUSD 4H RANGE TRADESNZDUSD is in an bullish uptrend.
It has moved sideways in a range
Watch Macd for direction
Bullish Range Breakout Trade
Buy Stop .7073
Take Profit .7150
SL below Range top
Bearish Range Trade
Enter below 100 sma
Sell Stop .6965
Take Profit .6902
SL above 100 sma

Big 3 Indicator Short TradeBig 3 Indicator shows a red/yellow/green back ground to tell you training bias direction.
15m show entry point
1H shows a support level take profit
PM me if you want to read the complete Big 3 Indicator Strategy.

DGBBTC Great fundamentals and possible breakoutIt is a perfect moment to buy this coin cheap. Technical and Fundamental analysis are great.
DGB is in the triangle now it is going to break from it up or down around June 14th. However we forecast that the price will move upward as there are two great fundamental motives.
- Hard Fork on June 21st
- New Exchange Listing on June 30th
Systematic and specific risks are medium. It is a mid term trading recommendation. Buy in the suggested zone sell closer to the dates of events.

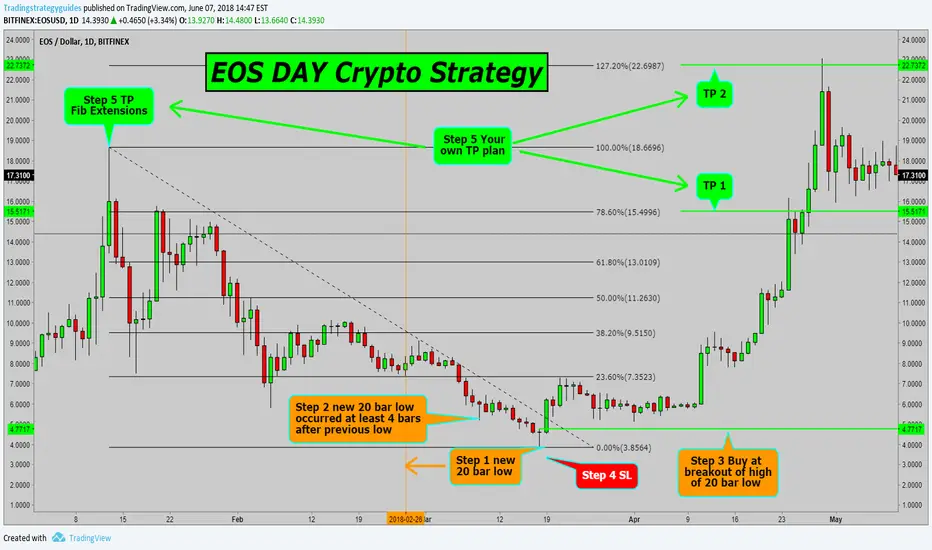
EOS DAY CRYPTO STRATEGYStep #1: EOS coin price must make a new 20-bars low
You have to wait until cryptocurrency EOS makes a new 20-bars low.
This is essential because we want to make sure that the prevailing trend is “well established.”
The only reason why we trade against the original 20-bar rule is because we know that the original Turtle system has a very low win rate. So, you can make a failed pattern work for you if you do the exact opposite thing of what the initial pattern was supposed to do.
Step #2: The previous low must have occurred at least 4 bars earlier than the current 20-bar low
The second rule that needs to be satisfied before pulling our trigger is that the previous low must happen at least 4 bars earlier than the current 20-bar low.
Basically, this trading rule is trying to point out that we need the EOS price to have a sharp move when it does the 20-day low.
Why do we need the EOS price to have an abrupt move?
If you’re an avid reader of our TSG blog, you probably know through our teachings that the more reliable reversal happens after a trend ends with a sharp move.
The Turtle Soup reversal pattern satisfies all trading conditions outlined above which mean that we can move forward and describe how to buy EOS coin.
Step #3: How to buy EOS: After the market drops below the 20-bar low, place a buy order above the prior 20-bar high
Now, the original Turtle Soup pattern uses a slightly different entry method. Instead of buying at the prior 20-bar low we buy at the previous 20-bar high.
This entry strategy ensures that we’re getting into the market while the market has stopped falling and it’s starting to get traction on the upside. This is one way we’re going to capture the potential trend reversal.
Important note* If the buy EOS order is not triggered during the same day you must cancel the order
Secondly, when trading EOS tokens with our strategy, your entry will be not too far from the low, which means that you’ll be able to use a very tight stop loss.
Step #4: Place your protective Stop Loss below the current swing low
After the buy EOS order is triggered, you have to place your initial stop loss below the current swing low. If the EOS price makes a new low, then we want to get out of our trade because the Turtle Soup pattern got invalidated.
This cryptocurrency strategy allows us to maintain a very low risk profile on all of our trades. Professional traders and hedge fund managers always look first to protect their capital and this trading strategy enable you to accomplish that for yourself.
Step #5: Take profit when you can count 20 bars from the 20-bar low or use your own exit strategy
Again, our exit strategy is slightly different than the original Turtle Soup system. We take profits after the market has advanced at least 20 bars from the 20-bar low.
Alternatively, you can use the initial exit strategy which requires for you to trail your stop loss. Due to the volatility of this reversal pattern your trade will last on average between 4 hours and a few days, so trade with caution.
Note** the above was an example of a BUY trade using our EOS cryptocurrency strategy. Use the same rules for a SELL trade – but in reverse.
PM me if you would like to read the complete strategy.
Gold Prices Go Up as Safe Haven Demands PeakToday, the idea is to stay bearish below $1,306 with a stop above $1,309 and a take profit of $1,290, whereas, buying is preferred above $1,289. All the best!

EURUSD 4H SHORT TRADE REVISEDPrice moved above 100 sma
Price has 2 options besides moving sideways
Option 1 - Price continues up into Pending Sell area 1.1809 & 1.1830 - Sell from here - SL 1.1845
Option 2 - Price falls into Sell Stop @ 1.1767 - Take Profit @ 1.1730
If price continues bullish move above 1.1850 wait for new setup
If price falls below 50 sma
Sell Stop @ 1.1625
Take profit @ 1.1535
Watch Macd for direction and signs to close trade

EURUSD 4H SHORT TRADEPrice has been above 50 sma
If price breaks below 50 sma I have a sell stop waiting @ 1.1647
Take Profit @ 1.1555
Stop Loss @ 1.1747
Need Macd to cross below Red signal and zero lines. Also blue dotted +80 Stoch line - over bought
Close trade if Macd crosses above Red signal line and if market indecision makes small bodied bars hovering above
50 sma.

AUDUSD 15M BEARISH CONTINUATION TRADEPair is in a bearish move.
Market has paused and not broken above the 50 sma
I have a sell limit @ .7627 if price breaks above the 50 sma
If price stays below then I have a Sell Stop @ .7605
Take Profit @ .7575
SL @ .7647
Macd to cross below blue dotted +80 Stoch line and Red signal line
