SALTBTC combination of positive factorsWe gave the signal yesterday, combination of positive indicators status and bullish patterns started an impulse growth which brought the price to our 3rd target, there is one more impulse left be ready to fix profit. We will provide you with profit report later.
Takeprofit

TRXBTC another Gartley butterflyThe price went down significantly due to overall market crash, however it managed to consolidate and demonstrated a nice growth and profit from our previous signal. There was a Gartley Butterfly pattern and price grew up. Currently another similar pattern is forming. Tron is a nice coin to buy when it is at dip as it has great fundamentals and is suitable for mid and long term trade

We work by levelsAfter our price has come out of the triangle, we observe how the levels are worked out.
At the moment, as we expected the price went up, but found a resistance level near the mark of 1.2380. And after yesterday's trading, the support level is 1.23000.
We expect that our pair will again test the resistance level and try to consolidate above the 1.24 mark. So at the moment you can search for points to enter long positions and set take profit at a level around 1.24

AUDUSD 4H RNGE SHORT TRADESENTER NOW ON 15M
15M BREAK-HOOK-GO COMPLETED
SELL STOPS LISTED
TAKE PROFITS LISTED

CARDANO CRYTO STRATEGY - 5 ENTRIESStep #1: Cardano ADA price needs to trade above the 200-day moving average
The first condition that Cardano requires to satisfy is to trade above the 200-day moving average.
When price trades above the 200-day moving average we know we have a strong premise for a bullish trend to be put in place.
The more time Cardano price spends above the 200-day moving average and the biggest the distance between the Ada price and the 200-day moving average the stronger the trend is.
Step #2: Volume needs to be above average and twice as much volume compared with previous volume bars needs to come in
We need to look for instances when the volume bars are above the average volume (the red moving average). But this is not all; we also need the buying volume to be twice as much as previous volume bars.
In our Cardano chart we can note five instances where the volume was not just above average, but it was also double as the previous volume bars. In this case, we’re dealing with five possible buying levels.
Wait for trading situations where the buying volume is increasing considerably. This really shows institutional buying that has the power to move the Ada coin price.
Step #3: After volume has increased, buy at the opening of the next candle
When to buy Cardano ADA is quite intuitive if you have followed this cryptocurrency step-by-step guide.
The moment we see institutional buying presence we want to be sure we’re not left out. In this regard, after the volume has increased, we buy at the opening of the next candle preceding the big volume candle.
Usually, you’ll be buying right after the first bullish candle that often is the starting point of a new trend. Don’t be afraid to buy on the way up as this will pay handsomely in the long run.
Step #4: Place protective Stop Loss below the 200-day moving average
Hide your protective stop loss below the 200-day moving average.
A market that has a strong bullish trend should not drop below the most powerful moving average aka the 200-day moving average. By hiding your stop loss below the 200 moving average, we’re minimizing risk as much as possible.
Note* as the trend progresses you can also trail your stop loss below the 200-day MA.
Step #5: Take Profit when we break and close below the 200-day Moving Average
The 200-day moving average can serve us as a significant trigger for our exit strategy.
When we break below the 200 moving average, that’s the first sign that the trend is about to change the tide. When these happen make sure you take profits.
Note** the above was an example of a BUY trade using the Cardano trading strategy. Use the same rules for a SELL trade – but in reverse.

WAVESBTC A strong coin with a great potentialFundamental analysis of this coin is very strong, that is why we started more thorough analysis of this coin. We found out that there is a combination of bullish patterns: cup and handle and bullish flag. Moreover indicators: MA, EMA, Aroon and Stoch are positive, volume is also rising. Combining all factors together with Fib retracement levels we forecast the ascending price movement

PIVXBTCAnother opportunity to make a good profit via this coin. At the 1-hour time frame chart the price touched ascending trend line and is ready to bounce from it. Indicators are positive and chart patterns are bullish. There is a double bottom formed right on the trend line forming a strong willingness of market players to see a higher price of this coin.

Bulls are returningAfter completing of the correction in the markets, we can observe the inverted figure "Head and shoulders" on the 4-hour chart.
Since it has not come to the end, we can locally enter long positions. The MACD and Stochastic indicators confirm the upward movement.
So Take Profit will be placed at the level of 1.2360 and the Stop Loss will be set below the level of 1.23. Also today the producer price index for March will be published. It is better not to enter the market during publication.

ADXBTC in two timeframes trend confirmedYesterday we gave the signal on ADX, and now the trend is confirmed, we earned a little profit already, and expect to have far more in the short term. Trend analysis and technical indicators are positive. There is a BB contraction which may lead to impulse growth according to the retrospective analysis and overall trend, however Ichi cloud is flat and the price may follow sideways trend for a while.

HMQBTC profitable opportunityTechnical analysis shows that the coin has cyclical XABCD + Cup&Handle formations. The price is at its bottom and according to ADX, PPO it is going to bounce again soon. However Stoch RSI and MACD signal that there should be a consolidation before bulls run
The signal is already in the Premium channel

ASTBTC Three drivesWe found a confident breakout which started formation of Bull Flag with possible three drives scenario. Volume is rising and technical indicators are positive. We recommend this position for a mid term trade.

PPTBTC a start of impulse growthPopulous is a very interesting coin we bought it at its ICO and made a huge profit in the end of January. The coin went down after a sharp rise and now found its support. There was a possible H&S formation however it was broken and now it all seems like a start of an impulse growth. However indicators show a possibility of consolidation before it. But around specified in the signal zone and sell right at the targets in order to get profit from price movement waves.

SNGLSBTC continuous XABCDAfter Gartley Butterfly pattern was formed the price went up to the 0.00000850 level. We expect another XABCD pattern will be formed, hence the price should decrease to the buying zone in the signal. If it happens the price will go up from mentioned zone and will reach our targets. Momentum, MACD (12, 27), EMA (10), SMA (10, 20, 30) and HMA are in the bullish state. This is a good mid term trading opportunity

IOTABTCIOTA went dip on April 1st and we waited till it forms a support to open this trade. Currently we see a good trading opportunity, indicators are positive and the price is near to the right vertex of the triangle. Moreover double (triple) bottom was formed.

LITECOIN 30M CRYPTO CLAW PATTERN STRATEGYStep #1 Wait for Bitcoin Signal indicator to issue an Up-green arrow – Buy signal or Down-red arrow - Sell signal.
Our proprietary indicator can issue clean and accurate buy/sell signals that can immediately make you a PRO cryptocurrency trader.
This indicator helps you analyze the market on any time frame in a matter of seconds.
We have a feature that will allow for pop up alert signals whenever a buy/sell signal is found so you won’t miss any Crypto trading opportunity.
Step #2 Place Protective stop loss above/below the Bitcoin Claw Pattern
The initial protective stop loss is always placed above/below the red box drawn by our Crypto Signal indicator.
You also have the option to trail your stop loss, a brand new feature we added to the Crypto Signal Indicator.
The way it works is that when you turn this feature on in the settings the indicator will continue to show you where to place your trailing stop loss. So that if your trade never reached your target, and it ended up turning against you, you will at least protect some of the trade since you locked in the profits.
Step #3 Take Profit when we break below Bitcoin signal channel
Our take profit strategy is straightforward!
Take profits and close your long Bitcoin trade once the Bitcoin signal channel is broken to the downside. If you use the built-in trailing SL function you can automate the whole TP process. Basically, you can accomplish the same results if you use the trailing SL option.
Note* The Crypto Signal Indicator has many more customizable settings that can make your life easier.
If you have any question PM me and I will be happy to help.

4H LITECOIN OBV TRADING STRATEGYThe only indicators you need are the following:
On Balance Volume or the OBV – The OBV indicator is based on the idea that both the volume and the price activity are equally important. In this regard, the OBV combines both price and volume to show you the total amount of money going in and out of the Litecoin.
The main idea behind the On Balance Volume indicator is that the Litecoin price will follow where the volume flow is going, volume precedes price!
So, if Litecoin price is moving up, we want to see the OBV indicator rising signaling an inflow of money. Conversely, if the Litecoin price is moving down, we want to see the OBV indicator falling indicating an outflow of funds.
We’ll also plot a 20-day moving average which it will be used to differentiate between what is normal volume activity and what it’s abnormal trading activity.
The use of the 20-day moving average can also signal how severe the change in Litecoin price trend may be.
Step #1: Wait for the OBV indicator to enter into a prolonged period of consolidation at the bottom of the window. In other words, what we look for is for the OBV indicator to spend some time in “oversold” territory. Technically the OBV doesn’t show overbought and oversold conditions in the market but, we only use these terms to describe the OBV location on the chart.
The On Balance Volume indicator as the name suggests shows the volume activity, and when we see the OBV consolidating, usually this means the market is in accumulation process.
But what is accumulation?
Very simple, accumulation is the buying up of cryptocurrencies by the professionals. The buying it’s usually done in a manner that doesn’t attract attention on the price chart which is the reason why we use the OBV indicator to spot when the institutional buying happens.
Step #2: Wait for a breakout above the OBV consolidation zone.
When the professionals accumulate a cryptocurrency, it will usually trade sideways. The OBV indicator is the best indicator to outline when Litecoin is being accumulated.
These ranges are deliberately created by the smart money to use fear and panic to shake out weak holders so they can grab as much of the available cryptocurrency at the lowest price.
When all the available supply of a cryptocurrency is exhausted, then the smart money will mark up the Litecoin price or any other cryptocurrency. This process can be best visualized on the OBV indicator when we have a breakout above the consolidation zone created.
The OBV indicator performs better if it’s used in conjunction with other indicators as well as your own judgment and common sense which brings us to the next step of our Litecoin strategy.
Step #3: Buy Litecoin when we close above the 20-day Moving Average.
We’re going to use the 20-day moving average indicator to confirm the OBV readings further.
After the OBV indicator breaks above its consolidation and right away the Litecoin price breaks and closes above the 20-day moving average, we initiate a buy order.
Step #4: Hide the Protective Stop Loss below the most important support level .
Knowing where to place your protective stop loss is as important as knowing when to enter the market. That’s the way you manage risk!
The best strategy to apply in this case is to place your protective stop loss below the most recent support level . If the smart money were really behind this move than the support level should hold. Otherwise, a break below will invalidate our market view, and we better be out of the market than fighting a losing trade.
Step #5: Take Profit when Litecoin price closes below the 20-day Moving Average or according to your trade plan.
We take profits at the first sign that the market is about to reverse. When the litecoin price breaks and closes below the 20-day Moving average, that’s the most appropriate moment we want to take profits or according to your trade plan rules.

USDCAD 4H RANGE BREAKOUTPrice has broken out of bottom range trendline
15m waiting for a break-hook-go to re-enter
Take Profit shown
SL above breakout candle
Look at Macd for direction

XVGBTC a nice Cup&HandleThere were 5 impulse Elliott waves since the end of March. At this moment a nice Cup&Handle was formed. This bullish pattern is enforced by Ichi Cloud state and rising volume. The price went above of BB, hence uptrend should continue. In order to earn profit accurately follow targets one by one.
MACD (12,27), exponential and simple moving averages (10, 20, 30 ,50, 100, 200) and HMA are in bullish state
Safe buy zone is between 0.00000600-650 we recommend to buy around 0.00000650. Targets are presented in the signal that was shared with analysis in the Telegram channel 2 hours ago

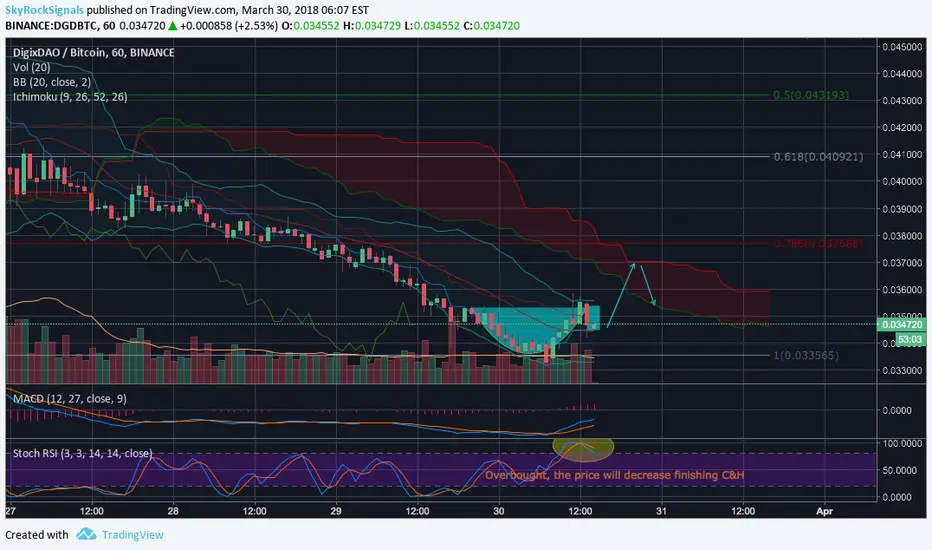
DGDBTC A brilliant cup and handleWe detected a Bollinger Bands contraction and decided to do a deeper analysis. We found unfinished Cup&Handle formation and according to indicators status it was going to be finished soon. Currently 2 hours after we gave the signal in the Premium channel we see that it is finished, the price should enter Ichi Cloud and touch upper edge of it.
BCHUSD 4H BULLISH REVERSAL TRADEIF - the 2nd fractal low holds and price begins to move up
Bullish Fractal Breakout Trade is setting up
IF - price breaks above the 1st fractal high level
Wait for a bullish break-hook-go on either a 15m or 30m then enter long
Stop loss below 2nd fractal low
Take profits listed

AMPBTCAMP has just touched its trend line. H&S was broken and indicators are bullish: Stoch RSI and Ichi cloud show a growth opportunities. Our team has analyzed price oscillator and found that there is a hidden bullish divergence .
Indicators are positive, trend and market players behaviour analysis are positive too. It seems that even at this unstable market AMP can bring good profit

LomoCoin (LMC) : Day Chart : 1st TargetLomoCoin (LMC) 1st Target offers a potential profit of around 90 - 95%.
Target:
~0.00001200 - 0.00001250
100% Potential Profit

AION : Next Target : 100% PotentialNext expected target for AION on Binance:
~0.0006000 - 0.0006050
100% Potential Profit
Now's the best time to buy..
Holding onto it wouldn't be a bad idea, but to maximize profit, look to sell near the target level..
