BTC Bulls, this one is for you ;)As most of you know, I’ve been bullish on Bitcoin for quite a while now. And today, I want to show you exactly which resistance levels I’m watching if the breakout continues.
On the weekly BTC/USDT chart, I’ve marked out five key upside targets, all based on Fibonacci extension levels — not just random lines, but technical zones that often attract serious reaction from the market.
Let’s break them down:
🔸 Target 1 — $124K
This lines up with the 141.4% Fibonacci extension and also happens to match the projected move of a textbook Cup & Handle pattern. It’s the first big checkpoint.
🔸 Target 2 — $137K
Here we’ve got the 227.2% Fib level — a classic continuation zone if momentum remains strong.
🔸 Target 3 — $145K
Next up is the 241.4% extension, where we could see some heavier resistance and price interaction.
🔸 Target 4 — $155K
One of the strongest zones on the map. Why? Because it merges four separate Fibonacci extensions in one cluster. A real decision point.
🔸 Target 5 — $167K
And the final target (for now) — the 261.8% extension. If BTC gets here, it’ll be a major event.
🎯 My View:
This isn’t hopium. These levels are based on market structure, Fibonacci math, and historical behavior. As always, I’ll adjust based on price action, but these are the areas I’m preparing for.
Targets

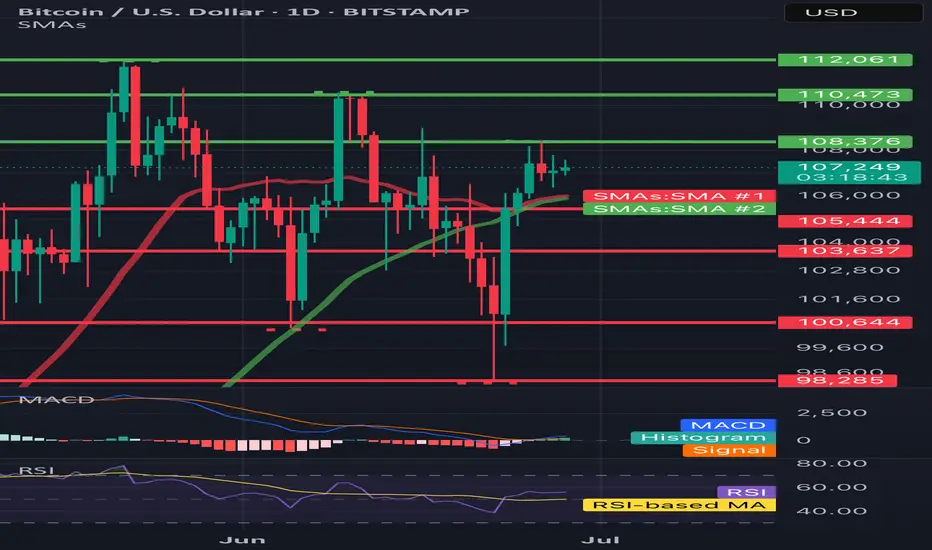
BTC/USD 1DHello everyone, let's look at the 1D BTC chart to USD, in this situation we can see how the 3rd peak formed us and we are currently fighting to maintain the price or a potential output up if we do not see a try to break out, you can expect a stronger relief.
However, let's start by defining goals for the near future the price must face:
T1 = 108376 $
T2 = 110473 $
Т3 = 112061 $
Let's go to Stop-Loss now in case of further declines on the market:
SL1 = 105444 $
SL2 = 103637 $
SL3 = 100644 $
SL4 = 98285
Looking at the RSI indicator, we see
As we entered the upper part of the indicator again, however, there is still a place to try to grow.
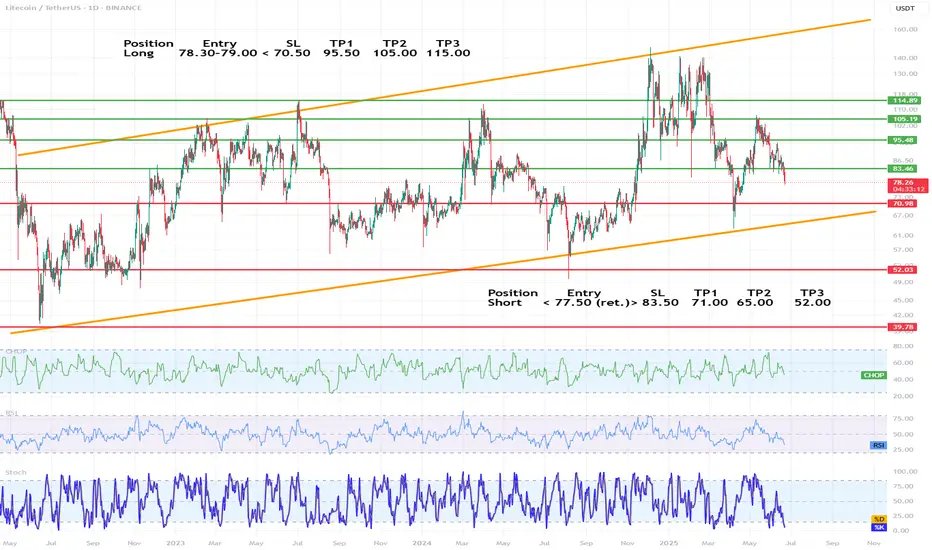
LTC/USDT chart technical analysis (1D)🔷 1. Trend and market structure
🔺 Main channels:
The chart is moving in an ascending channel (orange lines), the lower and upper limits of which have been respected since mid-2022.
The current price (around 78.3 USDT) is in the middle range of the channel, with a downward trend in recent weeks.
🔁 Market phase:
The price is in consolidation in a broader uptrend.
The last upward swing did not break through the previous peak (~135 USDT), which may indicate weakening momentum.
🔷 2. Key horizontal levels (support/resistance)
✅ Resistance levels (green lines):
83.46 USDT – the nearest resistance, currently being tested from below.
95.48 USDT – strong resistance from March-April 2024.
105.19 USDT – a level tested many times in the past.
110.00 USDT – a psychological level.
115.83 USDT – a local high from December 2023.
🛑 Support levels (red lines):
78.30 USDT – currently tested support level.
70.98 USDT – a key defensive level for bulls.
52.03 USDT – strong historical support.
39.78 USDT – the last line of defense, consistent with the lows from 2022.
📐 Dynamic support (orange line):
The lower boundary of the ascending channel – currently falls around 65 USDT and increases over time.
🔷 3. Technical indicators
📊 CHOP (Choppiness Index)
Oscillates near the lower values → the market is starting to leave the consolidation phase.
Potential directional movement soon, most likely downward (due to momentum).
📉 RSI (Relative Strength Index)
RSI below 50, currently around 40–45 → supply advantage.
Not oversold yet, but momentum is downward.
🔄 Stochastic
Well below 20, i.e. in the oversold zone.
Potential for a short-term bounce, but it can also go lower with a stronger sell-off wave.
🔷 4. Technical scenarios
🟢 Growth scenario (long):
Condition: Defending the level of 78.3 USDT and a quick return above 83.46.
Targets:
TP1: 95.48
TP2: 105.19
TP3: 115.83 (upper border of the channel)
SL: below 70.98 USDT
🔴 Bearish scenario (short):
Condition: Break 78.3 and retest as resistance.
Targets:
TP1: 70.98
TP2: 65 (lower channel line)
TP3: 52.03 (large accumulation zone)
SL: return above 83.46
🔷 5. Swing strategy proposal
Long
Entry 78.30–79.00
SL < 70.50
TP1 95.50 TP2 105.00 TP3 115.00
Short
Entry < 77.50 (ret.)
SL > 83.50
TP1 71.00 TP2 65.00 TP3 52.00
🔷 6. Additional comments
It is worth observing the price reaction at 70.98 USDT - this could be a capitulation level or a strong rebound.
The formation on the daily chart resembles a head and shoulders (H&S) - a warning signal for bulls.
DOGE/USD 1H Short-term1. General situation on the chart
Trend: The last few dozen candles show a sideways movement with a stronger upward impulse, which was quickly corrected. We are currently seeing declines after the previous upward wave.
Current price: Approx. 0.1847 USDT.
Last structure: After the upward movement (peak around 0.205), the price dropped quite a bit, now consolidating below 0.19.
2. Formations and structures
Formation:
No clear classic formation (e.g. head-and-shoulders, triangle, flags) on the last candles.
However, something like a local peak ("double top") is visible around 0.203–0.205 — the price touched these areas twice and fell off, which suggests that this is a strong resistance.
Support and resistance:
Support: 0.1800–0.1820 — here is the last local low and the area where the price stopped before the previous upward movement.
Next support: 0.1740–0.1750 — the next low from the previous movements.
Resistance: 0.1900–0.1910 — here was the last consolidation, and then a sharp decline.
Strong resistance: 0.2030–0.2050 (recent highs).
3. Indicators
RSI:
RSI value close to 40 and is heading slightly down, but it is not oversold yet. This may suggest that there is potentially room for further decline.
MACD:
Histogram below the 0 line, MACD line below the signal, the bearish signal is still maintained.
4. Signals and potential scenarios
Base scenario (downside):
If the price breaks below 0.1820, the next target is around 0.1750.
Stop loss in this scenario: above the last resistance, e.g. 0.1910.
Alternative scenario (rebound):
If the price does not break 0.1820, and a demand reaction occurs - we may see an attempt to return to 0.1900, or even to the peaks in the area of 0.2000–0.2050.
Stop loss below 0.1800 (in the case of a long play).
5. Potential targets (by price action):
Short:
TP1: 0.1820 (nearest support, you can take some profit)
TP2: 0.1750 (next low, main target)
Long:
TP1: 0.1900 (nearest resistance)
TP2: 0.2000–0.2050 (highs, if the movement is strong)
Summary
Currently, the chart suggests a bearish scenario.
This is confirmed by the candlestick pattern, negative dynamics and indicators (RSI, MACD).
Key level to watch: 0.1820 – if it falls, we will probably go down to 0.1750.
If there is strong demand for 0.1820, a rebound to 0.19+ is possible.

BTC/USD 1H chartHello everyone, let's look at the 1H BTC chart for USD, in this situation we can see how the price moves over a strong growth trend line. However, let's start by defining goals for the near future the price must face:
T1 = 109164 $
T2 = 110207 $
Т3 = 111463 $.
Let's go to Stop-Loss now in case of further declines on the market:
SL1 = 107264 $
SL2 = 106314 $
SL3 = 105578 $
SL4 = 104781 $
Looking at the RSI indicator, we see
Return above the upper limit, which can cause an attempt to relax at the coming hours.

LTC/USDT 4H ChartHello everyone, let's look at the 4H LTC to USDT chart, in this situation we can see how the price is moving in a specific yellow triangle, in which we can see an attempt to exit from the bottom. On the other hand, the blue lines mark the main channel of the downtrend and here we can see how the price is fighting with its upper limit, but it is a strong resistance.
Let's start by defining the goals for the near future that the price has to face:
T1 = 101 USD
T2 = 111 USD
Т3 = 124 USD
Т4 = 147 USD
Now let's move on to the stop-loss in case the market continues to fall:
SL1 = 90 USD
SL2 = 80 USD
SL3 = 63 USD
The RSI indicator shows a rebound, but the movement remains around the middle of the range, which further leaves room for a potential deepening of the rebound.

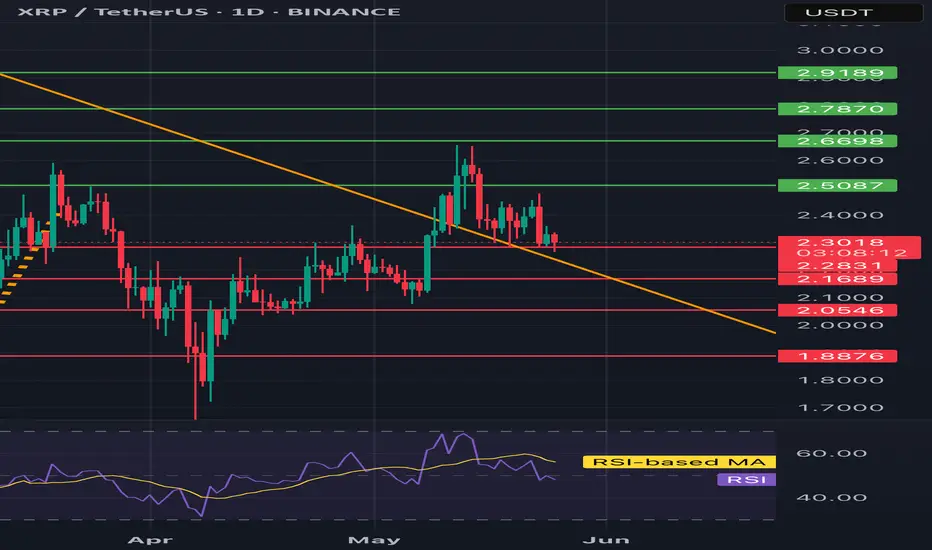
XRP/USDT 1D chart reviewHello everyone, let's look at the 1D XRP chart to USD, in this situation we can see how the price lasts above the downward trend line.
Going further, let's check the places of potential target for the price:
T1 = $ 2.51
T2 = $ 2.67
Т3 = 2.79 $ t4 = $ 2.92
Let's go to Stop-Loss now in case of further declines on the market:
SL1 = $ 2.31
SL2 = $ 2.17
SL3 = $ 2.06
SL4 = $ 1.89
Looking at the RSI indicator, you can see how he reacted and returned to the middle of the range, which creates a place for a panty growth.
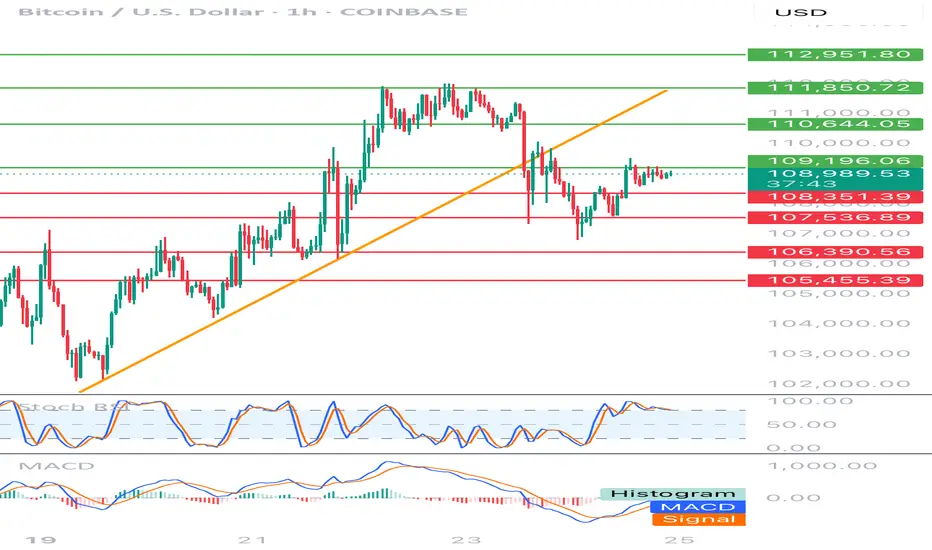
BTC-USD 1h chart targets and stoplossHello everyone, let's look at the 1H BTC chart to USD, in this situation we can see how the price dropped below the local upward trend line. Going further, let's check the places of potential target for the price:
T1 = 109196 $
T2 = 110644 $
Т3 = 111850 $ t4 = 112951 $
Let's go to Stop-Loss now in case of further declines on the market:
SL1 = 108351 $
SL2 = 107537 $
SL3 = 106390 $
SL4 = 105455 $
Looking at the RSI indicator, we see staying over the upper limit, which can give price drops, while the MacD indicator lasts at the bottom of the range and is close to returning to the upward trend.
BTC/USD 4H Chart targets and stoplossHello everyone, let's look at the 4H BTC to USD chart, in this situation we can see how the price has come out of the downtrend channel on top, and the upward movement after leaving the channel is close to the height of the downtrend channel.
Let's start by defining the targets for the near future that the price has to face:
However, at the beginning we can see how the price is struggling with a strong resistance zone from $103882 to $108349. Next, we have potential targets:
T1 = 112,740 USD
T2 = 116,525 USD
Т3 = 120,000 USD
Now let's move on to stop-loss in case the market continues to fall:
SL1 = 100,551 USD
SL2 = 97,446 USD
SL3 = 92,525 USD
SL4 = 88,286 USD
The RSI indicator shows that in the 4H interval, the movement is at the upper limit of the range, which clearly affects the sideways movement on the chart.

LTC-USDT 1W chart ReviewHello everyone, let's look at the 1W LTC chart to USDT, in this situation we can see how the price approached the upper limit of the inheritance trend channel, only when it manages to get out of it, the price will be able to go further towards the inheritance trend line.
Going further, let's check the places of potential target for the price:
T1 = $ 105
T2 = $ 115
Т3 = 129 $
T4 = $ 147
Let's go to Stop-Loss now in case of further declines on the market:
SL1 = $ 97
SL2 = 80 $
SL3 = $ 63
Looking at the RSI indicator, we see
As he approached the center of the range, but we still have enough space for the price to definitely move up.

SOL-USD 12h Chart ReviewHello everyone, let's look at the 12h SOL to USD chart, in this situation we can see how the price came out sideways from the downtrend line, then formed a downtrend channel, the exit from which gave a strong rebound creating a new uptrend.
Let's start by defining the targets for the near future that the price must face:
T1 = 172 USD
T2 = 195 USD
Т3 = 218 USD
Т4 = 252 USD
Now let's move on to the stop-loss in case the market continues to fall:
SL1 = 151 USD
SL2 = 130 USD
SL3 = 115 USD
SL4 = 96 USD
It is worth paying attention to the Stoch RSI indicator, where you can see how the current correction has strongly reacted on the indicator, which may give room for another stronger uptrend.

DOGE/USDT 1D chart reviewHello everyone, let's look at the 1D dog chart to USDT, in this situation we can see, the price reflection here can be seen how the price continues under the downward trend line.
Going further, let's check the places of potential target for the price:
T1 = 0.246 $
T2 = 0.282 $
Т3 = 0.319 $ t4 = 0.369
Let's go to Stop-Loss now in case of further declines on the market:
SL1 = 0.229 $
SL2 = 0.195 $
SL3 = 0.157 $
Looking at the RSI indicator, you can see that when the indicator came out the top, it gave the relief for the price and now when the price lasts in a slight side trend, the indicator collects energy for a new move.

LINK/USDT 1W chart reviewHello everyone, let's look at the 1W link to USDT, in this situation we can see how the price is fighting for the mountain from the downward trend line over which we are currently.
Going further, let's check the places of potential target for the price:
T1 = $ 18.38
T2 = $ 21
Т3 = $ 23.53
Let's go to Stop-Loss now in case of further declines on the market:
SL1 = 15.31 $
SL2 = $ 13.17
SL3 = 10.53 $
Looking at the RSI indicator, we see a clear increase on the indicator and a return to the upper part of the range, but there is still room for continuing the ongoing strong growth.

BTC/USD 1D chart ReviewHello everyone, let's look at the 1D BTC chart for USD, in this situation we can see how the price came out of a strong downward trend, which gave a strong upward movement for the price. Going further, let's check the places of potential target for the price:
T1 = 96592 $
T2 = 101878 $
Т3 = 109442 $
Let's go to Stop-Loss now in case of further declines on the market:
SL1 = 92363 $
SL2 = 89028 $
SL3 = 83498 $
SL4 = 79350 $
Looking at the RSI indicator, we can see that despite a small price change, the indicator strongly reacted what potentially can give energy to further price increases in the coming weeks.

LTC/USDT 12H chart reviewHello everyone, let's look at the 12H LTC chart to USDT, in this situation we can see how the price came out of the downward trend and currently you can see the movement of the newly created upward trend line. Going further, let's check the places of potential target for the price:
T1 = $ 89
T2 = $ 97
Т3 = $ 109
Let's go to Stop-Loss now in case of further declines on the market:
SL1 = 85 $
SL2 = $ 77
SL3 = $ 67
SL4 = $ 63
Looking at the RSI indicator, we see
Return to the lower limit, which can potentially give energy to make the price re -perform upward movement.

BNB/USDT 1D chart Hello everyone, let's look at the 1D BNB chart to USDT, in this situation we can see how the price moves in a triangle where there is still space to keep the currently ongoing side trend. Going further, let's check the places of potential target for the price:
T1 = $ 599
T2 = $ 617
Т3 = $ 644
Let's go to Stop-Loss now in case of further declines on the market:
SL1 = $ 580
SL2 = $ 559
SL3 = $ 542
SL4 = 521 $
Looking at the MacD indicator, you can see an attempt to return to the upward trend, but here we do not have clear confirmation, which is why it is worth being careful.

MKR/USDT 4h chart ReviewHello everyone, let's look at the 4H MKR chart to USDT, in this situation we can see how the price moves on the created upward trend line. Going further, let's check the places of potential target for the price:
T1 = $ 1576
T2 = 1657 $
Т3 = 1714 $
Let's go to Stop-Loss now in case of further declines on the market:
SL1 = $ 1529
SL2 = $ 1499
SL3 = $ 1450
SL4 = 1372 $
Looking at the RSI indicator, we see
How slight relaxations give space for further increases by living in the upward trend of price.

LINK/USDT 4H Chart ReviewHello everyone, let's look at the 4H chart LINK to USDT, in this situation we can see how the price was moving in a downward channel, from which we saw an exit to the top and the formation of a new local uptrend line.
Let's start by defining the targets for the near future that the price has to face:
T1 = 15.08 USD
T2 = 16.87 USD
Т3 = 17.93 USD
Т4 = 19.07 USD
Now let's move on to the stop-loss in case the market continues to fall:
SL1 = 13.98 USD
SL2 = 13.12 USD
SL3 = 11.74 USD
SL4 = 10.76 USD
SL5 = 9.48 USD
If we look at the RSI indicator we can see how the price correction gave a strong rebound on the indicator, which could potentially give strength for new growth.

ATOM/USDT review chart 4HHello everyone, let's look at the 4H ATOM chart for USDT, in this situation we can see how the price has affected from the upper limit of the downward trend channel, however, staying in the upper part of the channel. Going further, let's check the places of potential target for the price:
T1 = $ 4.79
T2 = $ 5,26
Т3 = 5.63 $
Let's go to Stop-Loss now in case of further declines on the market:
SL1 = $ 4.29
SL2 = $ 4.02
SL3 = $ 3,57
Looking at the RSI indicator, you can see a healthy relaxation crossing the lower limit, which produces space for a potentially new growth movement. The MacD indicator that has returned to the center of the range, which also creates potential for upward movement.

ETC/USDT 4h chart Hello everyone, let's look at the 4h graph etc to USDT, in this situation we can see how the price came out of the top of the lasting downward trend. Going further, let's check the places of potential target for the price:
T1 = $ 17.44
T2 = $ 18.75
Т3 = 20.73 $
T4 = 22.48 $
Let's go to Stop-Loss now in case of further declines on the market:
SL1 = $ 16.25
SL2 = $ 15.05
SL3 = $ 13.74
SL4 = $ 12.66
Looking at the RSI indicator, we see
As we entered the upper part of the range again, which apparently affected the slow price of the price.

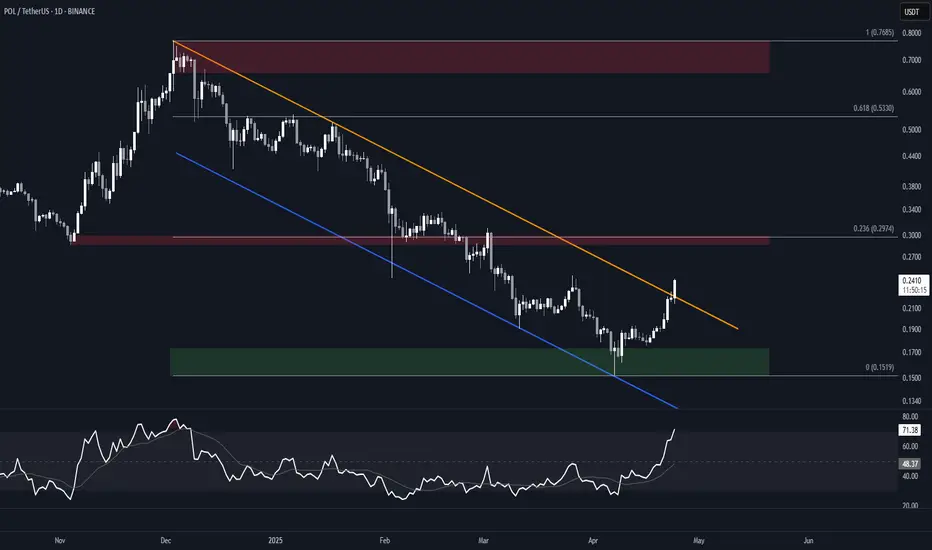
POL (MATIC) Falling Channel BreakoutBINANCE:POLUSDT is attempting a breakout from a nearly 6-months long falling channel. A daily close above the resistance would offer confirmation.
Watch for a potential retest of the resistance as support, as the overbought Daily RSI could signal an imminent pullback.
Key Levels
Aside from the support, these are all good candidates for partial TPs.
• $0.15-$0.17: Bull order block and current support
• $0.30: Previous S/R, 0.236 fib of the move down, and HVN. Will likely offer resistance.
• $0.53: Previous S/R, and 0.618 fib of the move down.
• $0.66-$0.77: Main supply zone, and December 2024 high.
FIL RectangleBINANCE:FILUSDT has been trading in a rectangle since August 2022. It recently below the demand zone, swept liquidity to $2 and regained support.
Key Levels to Watch
• $2.4-$3.0: Support and multi-year demand zone, recently tested and regained.
• $10.5-$11.8: Resistance and multi-year supply zone.
Measured Rectangle Targets
• Breakout: $20.0, also a support dating back to December 2020.
• Breakdown: $0.5
Filecoin is still lagging behind other alts, but, if you're looking for something you don't need to chase, it could already offer a nice long entry, with interesting R/R and a clear invalidation (lower low below $2.0).

LINK/USDT 8H - targets and stoplossHello everyone, let's look at the 8h chart LINK to USDT, in this situation we can see how the price has come out on top from the local downtrend line and how it is currently moving in a local sideways trend.
Let's start by defining the targets for the near future that the price has to face:
T1 = 12.65 USD
T2 = 13.13 USD
Т3 = 13.87 USD
Т4 = 14.40 USD
Now let's move on to the stop-loss in case the market continues to fall:
SL1 = 11.91 USD
SL2 = 11.05 USD
SL3 = 10.36 USD
SL4 = 9.66 USD
The MACD indicator shows an attempt to return to the uptrend, but here we can see a struggle that gives a sideways trend on the chart.
