BNB is climbing the trend lineHello everyone, let's take a look at the 1H BNB to USDT chart as you can see the price is moving above the local downtrend line.
Let's start by setting goals for the near future that we can consider:
T1 - $ 227
T2 - $ 237
T3 - $ 254
and
T4 - $ 271
Now let's move on to the stop loss in case of further market declines:
SL1 - $ 220
SL2 - $ 212
SL3 - $ 207
SL4 - $ 201
and
SL5 - $ 193
Looking at the CHOP indicator, we can see that we have a lot of energy in the 1H interval, and the MACD indicates that we can enter a local upward trend.
Targets

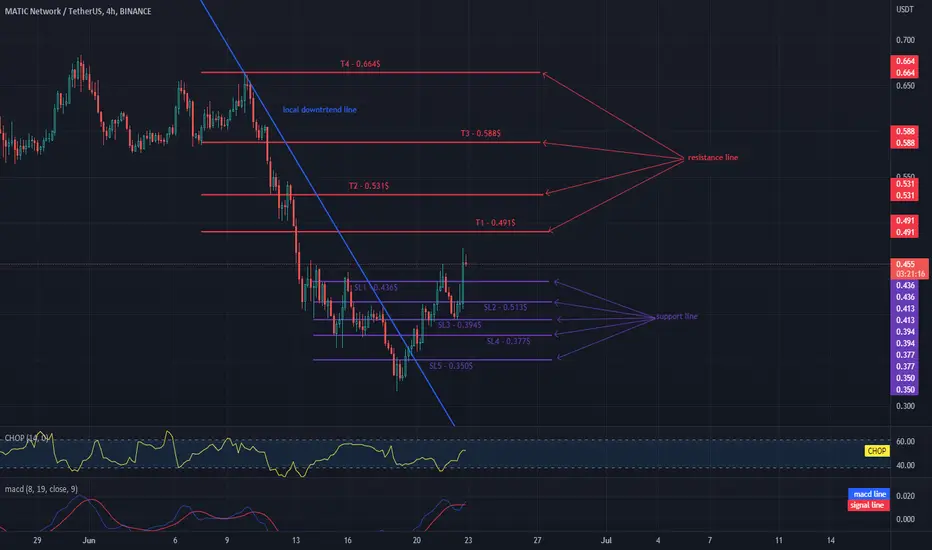
MATIC in the local uptrend!Hello everyone, let's take a look at the 4H MATIC to USDT chart as you can see the price has come above the downtrend line.
Let's start by setting goals for the near future that we can consider:
T1 - $ 0.491
T2 - $ 0.531
T3 - $ 0.588
and
T4 - $ 0.664
Now let's move on to the stop loss in case of further market declines:
SL1 - $ 0.436
SL2 - $ 0.513
SL3 - $ 0.394
SL4 - $ 0.377
and
SL5 - $ 0.350
Looking at the CHOP indicator, we can see that in the 4H range we collect more and more energy, and the MACD indicator shows that we are in a local upward trend
DOT / USDT loklanie changes the trend to a downward trendHello everyone, let's take a look at the 4H DOT to USDT chart as you can see the price has come above the downtrend line and back below that line.
Let's start by setting goals for the near future that we can consider:
T1 = $ 7.91
T2 = $ 8.29
and
T3 = $ 8.77
Now let's move on to the stop loss in case of further market declines:
SL1 = $ 7.60
SL2 = $ 7.38
SL3 = $ 7.16
SL4 = $ 6.86
and
SL5 = $ 6.47
Looking at the CHOP indicator, we can see that in the 4H range the energy slowly starts to rise, while the MACD indicator shows a change in the local trend to a downward trend.

WILL LUNC / BUSD BEAT THE TARGETSHello everyone, let's take a look at the 4H LUNC to BUSD chart as you can see the price is approaching exiting the channel marked with the blue lines.
Let's start by setting goals for the near future that we can consider:
T1 = $ 0.00005988
T2 = $ 0.00006536
T3 = $ 0.00006958
T4 = $ 0.00007394
and
T5 = $ 0.00008027
Now let's move on to the stop loss in case of further market declines:
SL1 = $ 0.00005115
and
SL2 = $ 0.00004089
Looking at the CHOP indicator, we can see that in the 4H range we still have some energy, while the MACD indicates that we are maintaining the local upward trend.

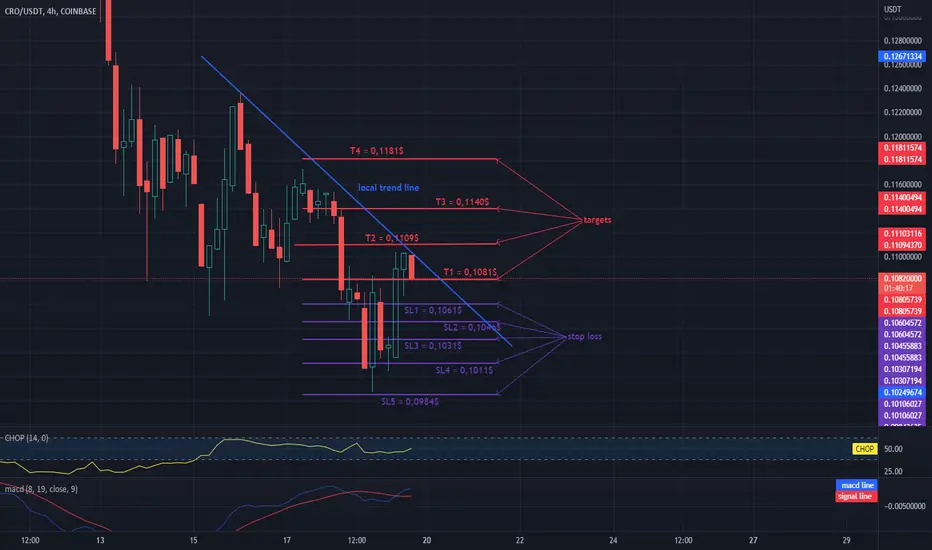
LOCAL REFUND OF THE PRICE CROHello everyone, let's take a look at the 4H CRO to USDT chart as you can see the price is moving below the local downtrend line.
Let's start with setting targets for the near future that we can take into account:
T1 = $ 0.1081
T2 = $ 0.1109
T3 = $ 0.1140
and
T4 = $ 0.1181
Now let's move on to the stop loss in case of further market declines:
SL1 = $ 0.1061
SL2 = $ 0.1046
SL3 = $ 0.1031
SL4 = $ 0.1011
and
SL5 = $ 0.0984
Looking at the CHOP indicator, we can see that at the 4H interval, the energy slowly begins to increase, while the MACD indicator indicates a local upward trend.
BTC bearish projection target. 16560$ or 12588$ ?I'm looking at weekly scale. All projected targets are shown on the chart.

ICICIBANK technical analysisNSE:ICICIBANK
In ICICIBANK
I used auto harmonic pattern to predict the market if u also want to use this then follow the steps:
1) open "indicator" and search "auto harmonic pattern" and click on it.
2) open "settings" and go to "style" and remove "table".
3) this indicator will automatically generate targets.
And if u want to understand more then follow us and observe how we give targets and find levels:-
👇👇👇👇👇👇👇👇👇
If it breaks downward level (* 715* ) as you can see in the chart above, then our :-
Targets :-- * 685 * ,* 625 *.
Make sure that market may retrace after achieve target.
For more such information stay connected with us.🤘🤘🤘

HDFCBANK JuneNSE:HDFCBANK1!
In HDFCBANK
above you can see the important levels and by *auto harmonic patterns* ( cypher ).
On its basis and some analysis we mentioned some targets.
If * 1400 * level break then our
Target 1 ------ 1420
And if upward movement remains continue then our
Target 2------ 1465
And if * 1380 * level break then our
Target 1 ------ 1345
Target 2 ------ 1285
Target 3 ------ 1195
I hope it will help you.👍👍👍
For more such analysis stay connected with us and Checkout our new updates 🤘🤘🤘

STOP LOSS AND TARGETS FOR ADA / USDTHello everyone, let's take a look at the ADA vs USDT chart over the 4 hour timeframe. As you can see, the price is moving above the local trendline.
Let's start by designating the support line and as you can see the first stop is fate at:
SL1 - $ 0.5988
SL2 - $ 0.5688
SL3 - $ 0.5405
and
SL4 - $ 0.4986
Now let's move on to the targets that we can set for the nearest future:
T1 - $ 0.6527
T2 - $ 0.7121
and
T3 - $ 0.7979
Looking at the CHOP indicator, we can see that in the 4-hour interval we have a lot of energy, while the MACD indicator shows that we have entered a local downward trend.

USDJPY Update (134.000 Hit)A while ago, o made a production on USDJPY, with a projected target at 134.000. Well this is just an update, today we have hit the target with several reasons why the push is this heavy including Japan's monetary policy, the Dollar strength and others.

GMT in the local uptrend, SHORTHello everyone, let's take a look at the GMT to USDT chart over the 4 hour timeframe.
As you can see, the price is moving above the local trendline.
Let's start by identifying the stop loss we have in the near future:
SL1 - $ 0.9975
SL2 - $ 0.9070
SL3 - $ 0.7979
Now let's move on to the goals we may consider:
T1 - $ 0.9994
T2 - $ 1.0598
T3 - $ 1.1099
T4 - $ 1,7579
Looking at the CHOP indicator, we can see that in the 4H interval most of the energy was used, while the MACD indicator indicates a local upward trend.

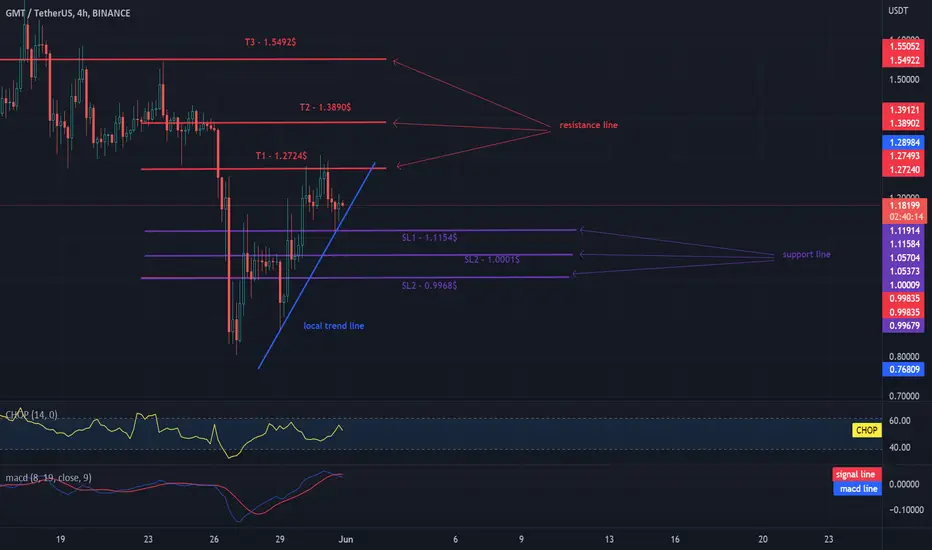
GMT has rebounded from resistance and is gaining energy. 4HCHARTHello everyone, let's take a look at the GMT to USDT chart over the 4 hour timeframe.
As you can see, the price is moving above the local trendline.
Let's start by identifying the stop loss we have in the near future:
SL1 - $ 1.1154
SL2 - $ 1,0001
SL2 - $ 0.9968
Now let's move on to the goals we may consider:
T1 - $ 1.2724
T2 - $ 1.3890
T3 - $ 1.5492
Looking at the CHOP indicator, we can see that in the 4H interval we have a lot of energy for the next move, while in the MACD indicator we see that the blue line crosses the red one from above, which could potentially lead to a further decline in the price.
Be careful and use stoploss in the short-term game.
Just my 1st ideaJust my 1st idea after a year of TA studies... Any comments are more then welcome...

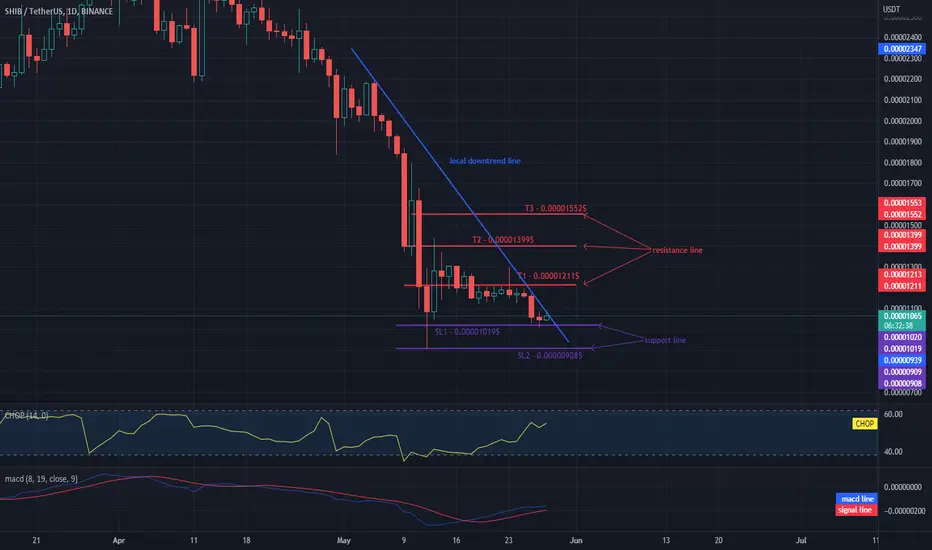
Will SHIB recover from declines?Hello everyone, let's take a look at the SHIB to USDT chart on a 1 day time frame. As you can see, the price is moving below the local downtrend line and is approaching its side exit.
It is worth starting with setting a stop loss, which we should take into account in the coming hours. As you can see, we chose 4 stop losses:
SL1 - $ 0.00001170,
SL2 - $ 0.00001109,
Now let's move on to defining the goals of price and as you can see, the first is at the T1 level - $ 0.00001211, which the price is currently struggling with, the next is at the T2 - $ 0.00001399 level, the next is T3 - $ 0.00001552.
Looking at the CHOP indicator, we can see that we collect more and more energy in the 1-day interval, and the MACD indicator does not indicate a downward trend.
GMT at 15m intervalHello everyone, let's take a look at the GMT to USDT chart on the 15 minute time frame.
As you can see, the price is moving below the local downtrend line.
Let's start by determining the stop loss we have in the near future:
SL1 - 0.807 $$
SL2 - $ 0.208
Now let's move on to the targets we can consider:
T1 - $ 0.998
T2 - $ 1,103
T3 - $ 1,188
T4 - $ 1,272
T5 - $ 1,389
Looking at the CHOP indicator, we can see that in the 15-minute interval most of the energy has been used.

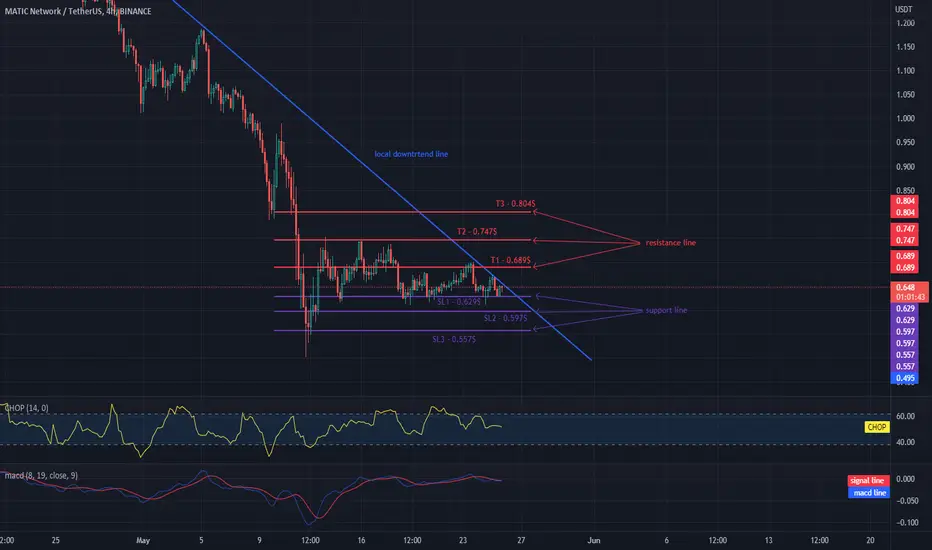
MATIC on 4H interval, target and stop lossHello everyone, let's take a look at the MATIC to USDT chart over the 4 hour timeframe. As you can see, the price is moving below the local downtrend line.
Let's start with determining the stop loss that we should take into account in the short term and, as you can see, we can set the following stop loss:
SL1 - $ 0.629
SL2 - $ 0.597
SL3 - $ 0.557
Now it is worth going to the targets that we should take into account when playing short-term, we see individual targets:
T1 - $ 0.689
T2 - $ 0.747
T3 - $ 0.804
Looking at the CHOP indicator we can see that in the 4-hour interval some energy has been used up, but we have a little bit to continue the movement.
However, please remember that the market can be dynamic and you should always be careful with the market and analysis.
If BTC is stable, GMT may start to go upHello everyone, let's take a look at the BTC to USDT chart over the 4 hour timeframe. As you can see, price is moving above the local uptrend line.
Let's start with the designation of the support line and as you can see the first support in the near future is SL1 - $ 1.29, if the support breaks, the next one is SL2 - $ 1.17 and SL3 - $ 1.02.
Now let's move from the resistance line, as you can see, the first resistance is T1 - $ 1.62, if you can break it, the next resistance will be T2 - $ 2.10 and T3 - $ 2.50, T4 - $ 2.90.
Looking at the CHOP indicator, we can see that on the 1-day interval we are starting to recover energy, and the MACD indicator indicates an upward trend

TSLA - time to buy? Not yet.. careful with sells however, we have met a MM. I have some buy entries lower, but that is risky. Reasons to buy on the chart will be a breach of 700 and midline of the current down channel, but be ready to get out at other side of channel in case we go lower. A break out of the down channel top and consolidation or 2 failed attempts to go lower again will be the classic buy set up with targets noted above. A breach below will put my next value area in the mid 500s to look for the run up. This one is way more volatile than AAPL etc, so be careful with it and trade smaller lot size (is my suggestion).

BTC/USD ShortQ2 5-19-K22 We have a potential short opportunity. If Bitcoin fails to hold its 30K level with declining volatility. Then, we may see a correction back to 25K to validate or Invalidate the next level of psychological support. In terms of a ''short'' context that is.
(Note) Please do your DD before application of a position. This is Idea is highly aggressive and vouched for by @Ra_way leader of the guild.
BINANCE:BTCUSDT
THI$ I$ THE WAY
EN -30,455
SL- 32.5K
TP 1 - 27K
TP 2- 26K

SCUSD - Investing - TargetsLong Order
Order 1: 0.00463
Long Target
Target 1: 0.13717
Target 2: 0.48339
Target 3: 0.74838
Target 3: 16.72349

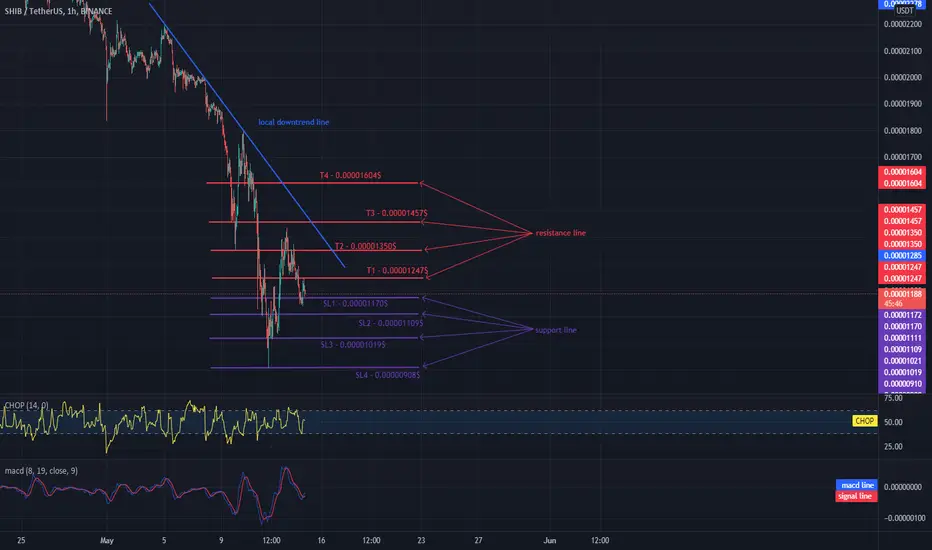
SHIB right on the support!Hello everyone, let's take a look at the SHIB to USDT chart in 1 hour. As you can see, the price broke above the local downtrend line.
It is worth starting with setting a stop loss that we should take into account in the coming hours. As you can see, we chose 4 stop losses:
SL1 - $ 0.00001170,
SL2 - $ 0.00001109,
SL3 - $ 0.00001019,
SL4 - $ 0.00000908.
Now let's move on to determining the goals that price has in front of him and as you can see, the first is at the T1 level - $ 0.00001247, which the price is currently struggling with, the next is at the T2 - $ 0.00001350 level, the next is T3 - $ 0.00001457 and T4 - $ 0.00001604 .
Looking at the CHOP indicator, we can see that some energy has been used within 1 hour, but we have a little to continue the movement. On the other hand, the MACD indicator shows an upward trend.
BTC on the border of the support zoneHello everyone, let's take a look at the BTC to USDT chart over the 4 hour timeframe. As you can see, the price is moving in a downtrend.
Let's start with the designation of the support line and as you can see the price has dropped below the support zone and the first support in the near future is SL1 - $ 28,373, if the support breaks down, the next is SL2 - $ 27,596 and SL3 - $ 26,716.
Now let's move on to setting targets for the coming hours and you can see that T1 - $ 29,250, if you can break it, the next T2 - $ 29,594 and T3 - $ 29,867 and T3 - $ 30,139.
Looking at the CHOP indicator, we can see that there is still a lot of energy in the 4-hour interval, while the MACD indicator is just before the red line crosses from above, which would confirm the downward trend.

Luna short term $0.008 to $0.028 fib targetUsing fib targets can Luna hit the $0.008 or next $0.028 fib targets? Is this token even going to be around? I am not an expert on Luna but I keep hearing they are trying to fix it and then others say no fix in sight. Please be cautious in playing with a platform that has lost this much market share so quickly.
