Earnings Heat Up - 6300 and 6200 SPX Key Levels RemainMarket Update
SPX Key Levels
-SPX poked 6300 Tuesday, Thursday, and poked higher Friday (but settled back to 6300)
-6200 support remains a key level
-6050/6000/5800 next floor levels, I'll be looking for dips
I can see the market slowly (and I mean SLOWLY) grinding higher but preparing for a
reasonable seasonal selloff through end of July into end of September window
July 28-August 1 is a monster week in the markets
-Megacap Earnings (MAG7 Tue/Wed/Thu)
-Wed July 30 - FOMC (Pause expected but Powell's Press Conference is important)
-Friday August 1 - Non-Farm Payroll, Tariff Deadline
I'm hitting fresh YTD highs so I'm not complaining about this melt-up and grind, I'm simply wanting to allocate positions and add to my positions at better levels and with a slightly
higher VIX to help take advantage of the expected move being greater than the actual move
Have a great weekend and thank you watching!!!
Tariff

Trump’s 50% tariff sparks USD/BRL breakout The Brazilian real weakened sharply against the U.S. dollar after US President Trump announced 50% tariffs on Brazilian exports, effective 1 August.
In response, Brazilian President Luiz Inacio Lula da Silva announced Brazil would retaliate with the same rate on U.S. imports. Trump has already pledged to retaliate if Brazil retaliates.
USD/BRL rallied from just under 5.44 to a high near 5.63. On the 1-hour chart, the pair is now retracing but perhaps consolidating in a narrow range between the 61.8% and 38.2% Fibonacci zones.
With tariffs set to begin in under a month and both sides not ready to back down, USD/BRL remains sensitive.

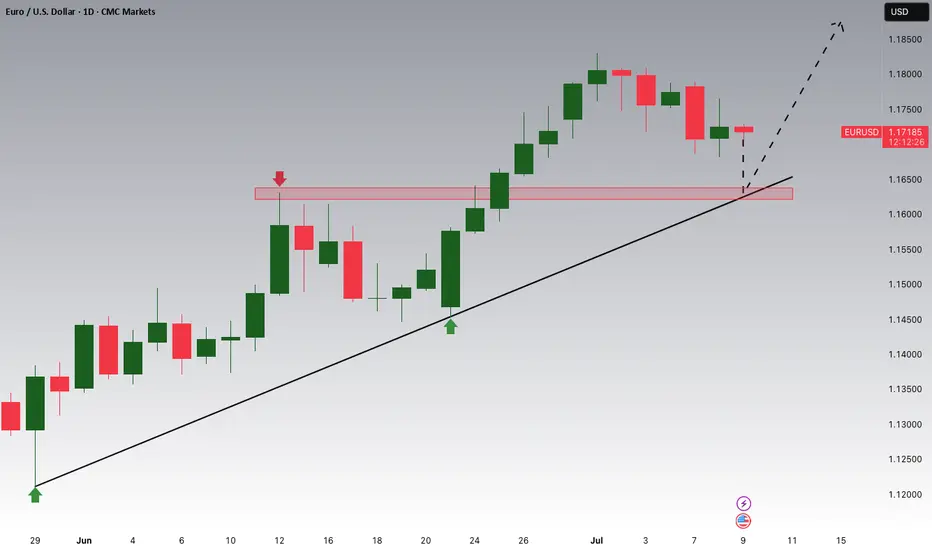
EURUSD is Approaching an Important Support!!Hey Traders, in today's trading session we are monitoring EURUSD for a buying opportunity around 1.16400 zone, EURUSD is trading in an uptrend and currently is in a correction phase in which it is approaching the trend at 1.16400 support and resistance area.
Trade safe, Joe.
Gap below… but copper’s breakout still in playCopper markets erupted higher this week following President Trump's proposal to impose a 50% tariff on copper imports. The price ripped from just above $5.20 to nearly $5.80 in a single 4-hour candle.
Now, copper could be forming a bullish flag or pennant on the 4-hour timeframe. After the vertical spike, price is consolidating in a tight, potentially downward-sloping channel between ~$5.45 and ~$5.60.
If confirmed with a clean breakout above the flag’s upper trendline - perhaps near $5.62—the next leg could project toward the previous high near $5.80
There’s also a gap below current price action, between $5.20 and $5.35, formed during the explosive move up. While gaps can act as support zones, they also tend to get revisited.

All-Time Highs (3% Up) or US/China Trade Gap (4-5% Down)?It's summer time (1st week of June)
Brutally slow price action thus far, Non-Farm Payroll hits this Friday
Next week will be more US Inflation Date (CPI, PPI)
S&P and Nasdaq are only 3% (or slightly less) away from all-time highs
Melt-up momentum says it's the path of least resistance
US/China Trade Agreement Gap (that silly little Monday announcement) is 4-5% lower
Whatever we hit, there will be disappointed traders and investors - the ultimate pain trade :)
I'm not bearish, I'm ridiculously cautious as a bull and wanting to see a pullback. I can tell
because it's actually annoying watching the market grind so slow to the upside shrugging
off every bad news bite and sense of reality
The big beautiful tax bill is losing support (see Elon Musk's latest comments)
The Trump Administration has pivoted so hard the other way the market is virtually
ignoring tariff news now
Let price be your guide. I'm connecting the April 7 lows forward and if the bears cross it and price sweeps some lows, there might be some pullback potential in the cards
Plenty to watch - be patient - opportunities await. Not forcing anything for now and I'm
doing the "boring" stuff for income trading.
Thanks for watching!!!

change trendwe have a break of first support at 3252 signaling an impulsive downtrend followed by news of US court blocking Trump's tariffs, says president exceeded his authority and this is a main bearish news for gold, the projection is widening based on dashed trendline and lower hights with lower lows, if price holds lower than 3252$ we have to lookout for next liquidity areas at lq 1-2-3

Momentum builds in GBP/USD and NZD/USD following tariff delayThe U.S. dollar weakened sharply in recent sessions as President Trump's announcement that the proposed 50% tariffs on EU imports will now be delayed until July 9, giving markets temporary relief.
GBP/USD edged toward 1.3600, testing levels last seen three years ago. The RSI sits just under 60, suggesting there’s still room before overbought conditions are reached. Volume has been gradually increasing, potentially reinforcing the strength of the breakout.
Risk-on flows also lifted the Australian and New Zealand dollars. NZD/USD has broken above the Ichimoku cloud and rose 0.62% on the day. Price is well above the Tenkan-sen (blue) and Kijun-sen (red), indicating strong upward momentum. However, the pair is pulling back slightly after the sharp breakout, suggesting short-term consolidation.

Big bill, big debt, bullish goldGold recently broke above a descending trendline and reclaimed the 0.382 Fibonacci level at $3,333.05. The bullish momentum now faces resistance near the 0.618 retracement at $3,366.29 and the $3,389.94 zone (0.786). A clean breakout could open the way toward the $3,440–$3,507 area, aligning with the 1.0 and 1.618 Fib extensions.
The rally follows rising trade tensions, as President Trump announced 50% tariffs on EU imports from June 1st and threatened Apple with 25% tariffs unless it relocates iPhone production to the U.S.
Further fuel for gold comes from the proposed ‘One Big Beautiful Bill Act,’ which includes major tax cuts and spending reforms. Expected to add $3–5 billion to U.S. debt, the bill passed the House and now moves to the Senate.

American Airlines Group Inc.Key arguments in support of the idea.
International routes continue to show strong demand. While the U.S. domestic market is facing challenges—especially in the low-cost carrier (LCC) segment—the company is capitalizing on inbound foreign tourism. However, it's worth noting that the U.S. Travel Association (USTA) reports the opposite trend: domestic tourism demand from U.S. citizens remains strong. We expect conditions in domestic flights to improve by summer 2025. During the reporting period, American Airlines highlighted that its premium offerings continue to drive revenue growth, and demand from American travelers for international flights remains steady.
AAL continues to rebuild its indirect sales channels, which is helping to expand its flight schedule in the short term. Following an acknowledgment of operational missteps in summer 2024, this recovery is not only helping to sustain current sales levels but also enabling the airline to better monetize its loyalty program.
Progress in tariff negotiations has given the stock a strong boost. Currently, AAL shares are trading with an RSI near overbought territory. However, if political progress continues, this momentum could very well be sustained. The recent formation of a technical "double bottom" pattern supports this possibility.
The 2-month target price for AAL is $14.9. We recommend setting a stop loss at $10.4.

REJECTION OF $292Tesla's stock ( NASDAQ:TSLA ) has faced multiple rejections at key resistance levels. To establish a strong upward trend, it may require forming a triple bottom pattern. This would indicate a solid foundation for potential growth. It is anticipated that the stock will retest the $270 and $250 levels before making a decisive move.

Noise, S&P Scenario, Gold BubbleThank you to the tradingview community for engaging and supporting my content.
After another rough start to the week, we have a bit of a crossroads ahead for the S&P
1) We revisit the April 7 lows and poke lower with bear trap opportunities
2) We hold Monday April 21 lows and grind back up to gap fill and revisit 5400-5500 resistance
3) We go nowhere with a lot of intraday volatility and noise (between the April 7 low and the April 9 high)
The markets are on high alert
DXY
Gold
Bitcoin
US Bonds vs Treasuries (yields rising)
Trump is more vocal about threatening the FED or firing Powell and the concern is truly unprecedented
Trade War pause is still ongoing, China is being vocal as well to make sure countries don't simply line up to support the US. For all of this to calm down, US and China have to play nice. China is likely able to hold the line longer than the US in the near-term
Thanks for watching!!!

S&P 500 - Key Levels and April 7-11 Weekly Candle StructureApril 7-11 will easily be remembered in 2025 as one of the craziest weeks in modern history.
Intraday swings were face ripping all from a Monday "fake news" becoming Wednesday "real news" with the US pausing tariffs for 90 days
5500 major resistance on S&P
4800 major support on S&P
I believe the market will struggle to provide any clear direction in the coming weeks without some shift in narrative (for better or worse). I'm sure most traders are hoping for an optimistic tone but be prepared to be disappointed as the world's alliances and economies are being strained with massive uncertainty and angst.
There are trading opportunities in the short-term, but I'm not taking any major risks. If I can survive, the upside will be easier and a pleasant surprise.
I expect the weekly candles to dance inside the April 7-11 low and high levels and hopefully it provides some ventilation to a VIX > 30

EURJPY TO BREAK 2022 LOWThe ascending channel is the first sign that indicates that price have a high chance to break 2022 low. After price impulsively broke the channel price formed a continuation of which I expect an impulsive break to the downside.

ECB decision shadowed by tariff risk Markets will be closely watching the European Central Bank’s (ECB) interest rate decision on April 17, with expectations for a seventh consecutive rate cut.
Despite this expectation, the euro surged to a three-year high against the US dollar last week, as traders continued to pull away from US assets.
The dollar index has dropped 4% since President Trump’s “Liberation Day” tariff announcements on April 2, falling below the key 100 level too.
At this stage, market participants will be looking for any signals on how the ECB might respond to the potential spillover effects of President Trump’s tariff measures. While some guidance may emerge around already-announced policies, the risk of further unpredictability remains high.
Trump being Trump, it is perhaps unlikely we have seen the last of his volatility-inducing tariff announcements. This can weigh further on the dollar, eroding confidence in the world’s reserve currency.

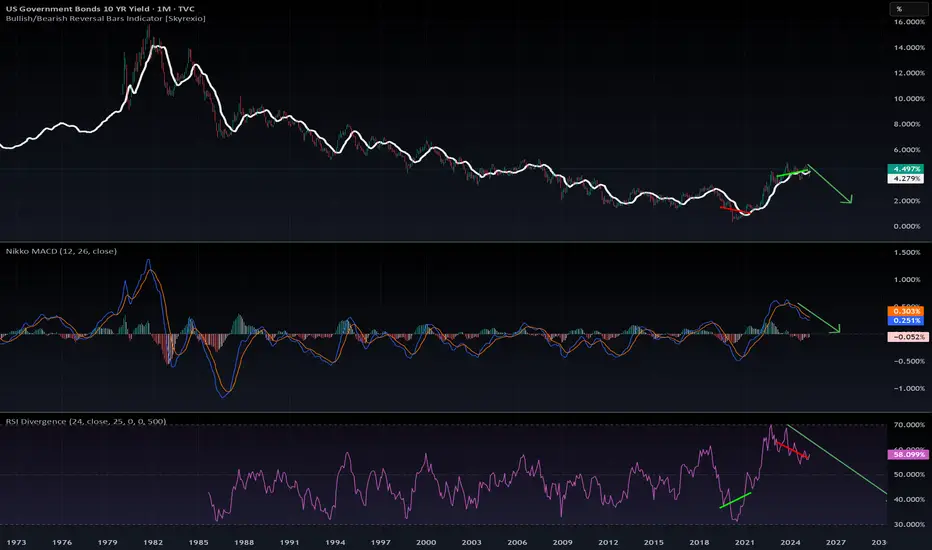
10YR Bond Yields: Panic on LTF, Calm on HTF📉 10YR Bond Yields: Panic on LTF, Calm on HTF
Yes, the recent spike in the 10-Year Yield is causing some short-term panic. But if you zoom out to the monthly timeframe, the bigger picture looks far more constructive.
🔍 Here’s what the chart says:
The MACD and RSI on the monthly are both pointing down.
Yields touched 4.5%, historically a key recession threshold.
We’re now seeing a MACD bearish crossover and a clear bearish divergence—classic signs of a trend reversal.
💡 What does this mean?
If no new fear or shock hits the market, yields are likely headed down, potentially toward the 2% range in the coming months. This would naturally ease pressure on equities and crypto.
📉 Conclusion:
This recent spike in yields seems to be transitional, not structural.
The chart suggests that the top is in, and the market is correcting from an overextended zone.
The Fed might not even need to intervene—the bond market is likely to correct on its own.
Stay calm. Stay rational. Always zoom out.
#10YearYield #BondMarket #MacroAnalysis #InterestRates #RecessionWatch #MarketPanic #MACD #TechnicalAnalysis #FederalReserve #CryptoMarkets #StockMarketInsights #StayCalmZoomOut #DYOR
Trump Tariffs - Trade War - High Volatility - Key LevelsEasy trading for 2025, right? Haha
We are seeing some of the wildest swings ever in the markets
Extreme intraday swings and volatility is getting everybody's attention
This video discusses all key levels and current seasonality
Hoping for the best and preparing for the worst

Trump Pump Just Broke the Charts12% Up in a Day. Now What?
What a difference a headline makes.
Monday:
Markets dump. Panic. Retail sells the low.
We hit our bearish targets like clockwork.
Wednesday:
Markets explode like they found a cheat code.
SPX rallies 9.5% in a day.
Nasdaq? A completely unhinged 12% up.
All because… tariffs might be paused again.
You can’t make this stuff up.
But you can trade it.
When Euphoria and Edge Collide
The Trump Pump Parade
After last week’s fake-news-induced dump, we now have headline euphoria.
No earnings beat. No rate cut. No macro shift.
Just one rumour:
“Trump might pause tariffs.”
Cue the biggest one-day rally since 1933.
Nasdaq: +12%
SPX: +9.5%
SPX now kissing the 5400 bull trigger level
Financial media?
Throwing a rave.
Retail?
FOMOing back into the top.
It’s madness.
But it’s not structure.
The System Trader’s Reality
Meanwhile, in the AntiVestor camp…
The bear swing is still on but under review.
Why? Because we trade levels, not vibes.
And 5400 has always been our pivot.
We’re now sitting right on it, with overnight futures starting to drift lower – like the market just realised it left the oven on.
The decision zone is here.
Hold 5400?
It’s time to shift gears.
Bull thesis activates. Tag ‘n Turn setups. Bull Pulse Bars. GEX Bulls Eye trades.
Lose 5400?
We go right back to feeding the bears.
It’s not emotional. It’s mechanical.
This is what system trading looks like.
---
Expert Insights: The Market Owes You Nothing
Mistake:
Getting emotional after missing a rally or overstaying a short.
Fix:
Use a system with defined levels.
5400 was always the line.
You don’t need to guess the pivot. You just need to trade it when it confirms.
This rally may be overblown.
But until the market proves otherwise, you don’t fight the tape – you ride it with structure.
---
Fun Fact
The last time the Nasdaq moved more than 10% in a day?
March 13th, 2020 – the height of COVID panic buying.
That rally was followed by… a further drop.
Then a V-bottom.
Then a massive bull market.
So… is this the start of something new?
Or just another overcaffeinated bounce?
History says: Don’t decide early. Let price confirm.

Will 3 Times Be The Charm For GBPUSD??We can see FX:GBPUSD retrace a tad further up to the Volume Imbalance that was created over the weekend of April 4th - 7th. After Price made its High @ 1.3207, it was immediately rejected back down below the Past Level of Support that is now showing signs of Resistance!
- Following that Higher High not only resulted in a Lower Low but also sent the RSI under 50 into Bearish Territory!
Now in the ICT Methodology of Volume Imbalances, Price is likely to Test or Fill the Imbalance, then once satisfied, has a high potential to turn the opposite direction. Now a Pullback to Fill the Imbalance would land Price right at the 38.2% Fibonacci Level @ 1.28984 where if Bulls are unable to push Price back above, would be an excellent Shorting Opportunity for Bears to overcome.
- RSI is now below the 50 suggesting Bulls have lost steam and strengthens the potential for more downside to occur but that would call for a Break and Retest Scenario on the Rising Support.
Fundamentally, the Federal Reserve will be releasing the CPI y/y and m/m results where analysts believe there to be a .3% decrease in inflation forecasting a 2.5% CPI for March from the previous 2.8% for February. Given this, the FOMC " do not plan to come to rescue Trump with rate cuts" and insist that all the Tariff pressure will actually be a reasoning for Inflation to Rise! So if CPI ends up printing Hotter than Expected (Higher), we could see a renewed strength in the USD.

Amazon I Technical & Tariff Analysis Welcome back! Let me know your thoughts in the comments!
** Amazon Analysis - Listen to video!
We recommend that you keep this pair on your watchlist and enter when the entry criteria of your strategy is met.
Please support this idea with a LIKE and COMMENT if you find it useful and Click "Follow" on our profile if you'd like these trade ideas delivered straight to your email in the future.
Thanks for your continued support!Welcome back! Let me know your thoughts in the comments!

Retests, Rallies, and Bear Swings LoadingYou know what’s better than nailing a trade?
Not having to flip, flop, hedge, unhedge, reverse, scalp, and do the full Hokey Cokey just to survive.
Today was one of those days – the kind where the plan just works.
Futures? Wild.
Down 143, up 188, then back to flat - all before most traders finished their first sip of coffee.
But while price whipsaws, I’m not chasing shadows.
I’ve got my line out.
My bear swing is on.
And I’m just waiting for the exit alert to ding.
---
Let’s break down what happened:
Yesterday’s tariff chaos acted like a Mr. Miyagi market prank.
“Tariff on.”
“Wait, just kidding.”
“Tariff off.”
The move up?
Landed exactly at Monday's news spike and the days 5250 gamma flip level – which we had marked and mapped.
Perfect resistance.
Retest. Rejection.
Bear pulse bars triggered.
And now the swing is on.
Trade location: Dialled in.
Directional bias: still bearish under 5400.
Execution: GEX levels + pulse bar structure.
Retests, Not Reversals
Tuesdays action also gave us something sneaky:
An intraday retest of the recent lows.
Now, if you’ve been around since the 2020 V-turn era, you’ve seen this before.
Panic sell.
Sharp bounce.
Retest the low to check for real conviction.
Then make the real move.
This retest could be the prelude to a bull thesis - but not yet.
Structure comes first. Bias second.
Until we break clean above 5400, I stay bear-biased.
---
Expert Insights: Don’t Trade Like You’re in a Dance-Off
The Mistake:
Overtrading volatility. Flipping bias every 15 minutes. Trading like it’s a talent show.
The Fix:
Pick your structure. Define your invalidation.
Enter once, scale in if needed, and let it play out.
No need to “turn around and shake it all about.”
Leave the Hokey Cokey for weddings.
---
Fun Fact
During the 2015–2020 bull run, the average false breakout-to-retest cycle happened within 3 sessions after a panic reversal.
Translation?
Markets often retest panic lows before deciding the next big move.
This isn’t new. It’s just noisy. And totally tradable.
...Another fun fact
Did you know?
The 104% tariff imposed by the U.S. on Chinese imports is among the highest in modern history, reminiscent of protectionist measures not seen since the early 20th century.

VIX Clips 60 as Market Volatility and Tariff UncertaintyThe VIX Clips 60 as Market Volatility and Uncertainty Surge on Tariff Announcement
The CBOE Volatility Index (VIX), often dubbed the “fear gauge,” surged past the 60 threshold this week—the highest level since August 5, 2023—as markets reacted violently to an unexpected announcement by the U.S. President regarding global tariffs. The sharp rise in the VIX, which measures market expectations of 30-day volatility, underscores the profound uncertainty now gripping investors, with the Dow Jones Industrial Average plummeting over 1,000 points and the S&P 500 entering correction territory. The trigger? A sweeping tariff policy unveiled by the administration on Liberation Day, a symbolic holiday marking a shift in economic strategy, which has sent shockwaves through global markets.
The VIX at 60: A Sign of Extreme Fear
The VIX typically hovers around 15-20 under normal conditions, reflecting moderate uncertainty. However, readings above 30 indicate heightened anxiety, and levels above 50 are rare, historically occurring during major crises like the 2008 financial collapse or the 2020 pandemic sell-off. This week’s spike to 60 marks a dramatic escalation, signaling a market gripped by fear. Analysts attribute this to the suddenness and scale of the President’s tariff announcement, which caught investors off guard after a period of relative calm.
The Liberation Day Tariff Announcement
On Liberation Day—a holiday commemorating historical freedoms—the administration announced a 25% tariff on a broad range of imports from key trading partners, including China, the EU, and others, effective immediately. The move, framed as a “national economic security initiative,” aims to curb perceived trade imbalances and protect domestic industries. However, its immediate impact has been severe:
Scope and Speed: The tariffs apply to $500 billion in goods, targeting sectors like semiconductors, automotive parts, and consumer electronics. The abrupt implementation, with no prior warning or negotiation, has left businesses scrambling to adjust supply chains.
Political Context: The announcement coincided with domestic political tensions, including debates over inflation and job creation. The White House argued the tariffs would “level the playing field” for American workers, but critics warned of retaliation and inflationary pressures.
Market Chaos: Sectors Under Siege
The tariff shockwave rippled across asset classes:
Equities: The S&P 500 fell 2+% on Monday, its worst single-day drop since March 2020. The Nasdaq, heavily weighted in tech stocks reliant on global supply chains, plunged over 5%.
Sectors: Semiconductor firms like Intel and AMD tanked, while automakers such as Ford and Tesla declined sharply.
Expert Analysis: A Volatility Tipping Point
Historical Parallels and Economic Risks
The current volatility mirrors past crises:
2008 Financial Crisis: The VIX hit 80 as Lehman Brothers collapsed, but the current crisis stems from policy, not financial contagion.
2020 Pandemic Sell-Off: The VIX spiked to 82 as lockdowns paralyzed economies, but today’s uncertainty is self-inflicted.
However, the tariff-driven uncertainty poses unique risks:
Inflation: Higher import costs could push inflation back above 4%, complicating the Fed’s rate-cut path.
Global Growth: The World Bank warns that trade wars could shave 2% off global GDP by 2025. Emerging markets, reliant on exports, face currency crises.
Looking Ahead: Can Calm Return?
Markets may stabilize if the administration signals flexibility. Potential pathways include:
Negotiations: A G20 summit in September offers a venue for de-escalation, though diplomatic progress is uncertain.
Policy Reversal: If tariffs are delayed or narrowed, the VIX could retreat. However, the President’s rhetoric suggests a hardline stance.
Corporate Adaptation: Companies might pivot to domestic suppliers, but such shifts take years, prolonging volatility.
Conclusion: A New Era of Uncertainty
The VIX at 60 marks a pivotal moment. Markets are now pricing in not just the immediate tariff impact but a broader shift toward protectionism and policy-driven instability. For investors, the path forward is fraught with uncertainty. While short-term volatility may ebb with reassurances, the long-term consequences—trade wars, inflation, and geopolitical friction—could redefine global economics for years.
With Liberation Day’s tariffs reshaping the landscape, one thing is clear: the era of low volatility is over. The question now is whether policymakers can navigate this new turbulence—or if markets will remain hostages to fear.

Review and plan for 8th April 2025 Nifty future and banknifty future analysis and intraday plan in kannada.
This video is for information/education purpose only. you are 100% responsible for any actions you take by reading/viewing this post.
please consult your financial advisor before taking any action.
----Vinaykumar hiremath, CMT

SPX500: The trendline show a bottom in Sept 2025 at 4700 We're being magnetically pulled toward the trendline bottom around 4700.
Based on the current MACD and RSI signals, the bearish scenario could continue until September–October 2025. This correction is very similar to the one from 2022.
There will be some dead cats bounces, but do not be fooled, the MACD is reseting hard.
Stay sharp. Be ready.
DYOR.
