Pound steady as UK inflation surgesThe British pound posted gains earlier but has failed to consolidate. In the European session, GBP/USD is trading at 1.3395, up 0.03% on the day. The pound has gained 1.1% this week and earlier today rose as high as 1.3468, its highest level since Feb. 2022.
UK inflation jumped to 3.5% y/y in April, up sharply from 2.6% in March and above the market estimate of 3.3%. This was the highest annual inflation rate since Jan. 2024 and was driven by higher prices for transport, housing and energy. Monthly, inflation soared to 1.2%, up from 0.3% and above the market estimate of 1.1%.
The news wasn't much better from core CPI, which rose to 3.8% from 3.4% and was higher than the market estimate of 3.6%. This was the highest reading since April 2024. Monthly, the core rate jumped to 1.4%, up from 0.5% and above the market estimate of 1.2%.
The rise in inflation can be partially attributed to the increase in the energy price cap and the Easter holidays, but is a disappointment for the government and for the Bank of England, as inflation had been trending lower.
The BoE will be concerned by the rise in core inflation, which will complicate plans to further reduce rates. The BoE trimmed the cash rate by a quarter-point earlier this month by 0.25%, but rates are still higher than other major central banks, with the exception of the Federal Reserve.
The Federal Reserve is taking a wait-and-see attitude before it lowers rates again, especially with the uncertainty swirling around US tariff policy. Atlanta Fed President Raphael Bostic said this week that even reduced tariffs would be "definitely economically significant" and said he favored one rate cut this year.
Tariffs

VAGX ETF: A Hidden Gem in an Era of Economic UncertaintyIn a world of shifting economic tides, investors are constantly searching for assets that offer both stability and growth potential. The Vanguard Global Aggregate Bond UCITS ETF (VAGX) may be one such opportunity, quietly accumulating strength amid global economic fluctuations.
Understanding VAGX ETF’s Accumulation Phase
VAGX tracks the Bloomberg Global Aggregate Float Adjusted and Scaled (CHF Hedged) index, which includes a diversified mix of corporate and government bonds. Since its inception in September 2021, the ETF has steadily grown, accumulating assets and reinvesting interest income to enhance long-term value. With 8,891 holdings and a low expense ratio of 0.10%, it offers broad exposure to global fixed-income markets.
Macroeconomic Landscape: Tariffs, Inflation, and Interest Rates
The global economy is at a critical juncture, with policy shifts and trade tensions shaping investment strategies. Key factors influencing VAGX’s potential include:
Tariffs & Trade Tensions: Recent tariff escalations have heightened uncertainty, impacting global trade and economic growth. This environment makes bond-based ETFs like VAGX attractive as investors seek stability.
Inflation Trends: Inflation is projected to moderate slightly in 2025, but remains a concern for central banks. Bond ETFs, particularly those with investment-grade holdings, can serve as a hedge against inflationary pressures.
Interest Rate Outlook: The Federal Reserve’s stance on interest rates has been influenced by inflation and trade policies. While rate cuts may be delayed, fixed-income assets like VAGX can provide a reliable store of value in uncertain times.
Why VAGX Could Be a Strong Long-Term Holding
Diversification: Exposure to global bonds mitigates risk compared to single-market investments.
Accumulating Nature: Interest income is reinvested, compounding returns over time.
Hedged Against Currency Fluctuations: CHF hedging reduces volatility from exchange rate movements.
Low Expense Ratio: At 0.10%, it remains cost-efficient for long-term investors.
Final Thoughts
As the global economy navigates inflationary pressures, trade uncertainties, and interest rate shifts, VAGX ETF stands out as a stable, accumulating asset with strong long-term potential. Investors looking for a reliable store of value and gradual appreciation may find this ETF an attractive addition to their portfolios.
SIX:VAGX INDEX:BTCUSD SP:SPX TVC:DXY OANDA:XAUUSD BITSTAMP:BTCUSD $ EURONEXT:N100 SIX:SMI TVC:SXY

Euro jumps as Eurozone core CPI risesThe euro is sharply higher on Monday. In the North American session, EUR/USD is trading at 1.1250, up 0.79% on the day.
Eurozone headline inflation was confirmed at 2.2% y/y and 0.6% m/m in April, unchanged from the preliminary estimates. The core rate was also confirmed at 2.7% y/y and 1% m/m. Services inflation rose to 3.9% from 3.5%.
The European Central Bank will be pleased that inflation was unchanged in the final April release but remains concerned about services inflation, which remains persistently high. The ECB trimmed its key rate by a quarter point to 2.25% last month and meets next on June 5. The markets have priced in another rate cut, as the ECB looks to take advantage of stable inflation and lower rates in order to boost economic growth.
The ECB can be expected to be cautious with its rate path and continue its data-driven approach. There is much uncertainty surrounding President Trump's tariffs, which has made it difficult for the ECB to make inflation and growth projections. What is clear is that eurozone growth has taken a hit from the tariffs and the outlook and the outllook for global growth has been revised downwards. The damage from the tariffs could be mitigated if the US and China can reach an agreement which removes the tariffs betweeen them.
The uncertainty surrounding US trade policy has also pushed the Federal Reserve into a wait-and-see stance, despite Trump's loud calls for a rate cut. The Fed held rates at this month's meeting and is widely expected to stay on the sidelines again in June. The Fed is waiting for more clarity on the tariff front, but any surprises from inflation or employment data could have a signifcant impact on rate policy.

IHSG AFTER BREAKMarket globally is crashed because of the new tariff that US applied. IHSG might as well crashed after this break, approaching 58xx. But i believe after this correction IHSG Will back in action and reach 67xx.

Food Prices Since Liberation Day - Is Up with Tariffs or PausedWhat is happening to the food prices since liberation day.
Soybeans are a benchmark for food prices — not only because China and many of us consume large quantities, but also because the U.S. exports a significant amount to China.
After the Liberation Day announcement on 2nd April, soybean prices initially dropped but quickly rebounded and surged higher.
Even after a successful trade agreement between the U.S. and China — which reduced reciprocal tariffs for 90 days — soybean prices continued to climb.
So why do food prices seem to trend higher, whether tariffs are in place or paused?
Micro Soybean Futures
Ticker: MZS
Minimum fluctuation:
0.0050 per bushel = $2.50
Disclaimer:
• What presented here is not a recommendation, please consult your licensed broker.
• Our mission is to create lateral thinking skills for every investor and trader, knowing when to take a calculated risk with market uncertainty and a bolder risk when opportunity arises.
CME Real-time Market Data help identify trading set-ups in real-time and express my market views. If you have futures in your trading portfolio, you can check out on CME Group data plans available that suit your trading needs www.tradingview.com
Trading the Micro: www.cmegroup.com

Tariffs Shocked the World, But Look What Happened NextTrump's “Liberation Day” reciprocal tariff announcement triggered a sharp selloff in the S&P 500 on the 2nd April. A classic policy shock! But the market has since clawed back every point.
So what now? Let’s break it down by strategy.
🔎 Long-Term Investors: Stay the Course
1) This recovery reinforces one truth: When you own quality businesses, Volatility ≠ Risk. Policy creates opportunity, not exit signals.
2) Stick with great companies, buy on fear, and ignore the noise. The next 10 years won’t be won by panic.
⚡ Momentum Traders: Technical Reversal Delivered
1) S&P 500 bounced above its 30-day MA. With the May 12th’s bullish gap (post temporary tariff pause) confirming the trend shift.
2) This was a textbook momentum setup. But if you didn’t plan for the whipsaw, you missed the edge.
📈 What This Means Now
Short-term volatility is likely to continue as tariffs, rates, and elections are all on the table.
Watch for pullbacks into structure and keep risk tight as news-driven moves will be fast and brutal.
Choose your timeframe. Respect the trend. Don’t confuse noise with signal.
The edge now isn’t in prediction — it’s in preparation.

An Unharmonious Outlook for the New WeekGold Bullish? Sure, go ahead, but let me explain where we are and so on... 🤔
1. Newswise 📰
Tariffwar:
Trade tensions between the U.S. and China have intensified following President Trump's tariff hikes. The U.S. increased tariffs on Chinese imports to 145%, while China retaliated with tariffs up to 125% on U.S. goods. Despite these escalations, both countries have engaged in high-level negotiations in Geneva, aiming to de-escalate the situation. However, a recent abrupt withdrawal by the Chinese delegation has cast doubt on the progress of these talks. Analysts caution that even if an agreement is reached, it may offer only temporary relief, leaving markets exposed to prolonged trade tensions.
Federal Reserve does not cut interest rates:
President Donald Trump has been vocal in his criticism of the Federal Reserve’s decision to keep interest rates unchanged, calling Fed Chair Jerome Powell a “fool” for not lowering them. 😡 Trump argues that with falling energy prices, stable employment, and low inflation, the Fed should cut rates to stimulate economic growth. 📉
The Federal Reserve, however, remains cautious. 🏦 Officials have expressed concerns that recent tariffs could increase inflation, making premature rate cuts risky. They emphasize the need for clearer economic data before making further policy adjustments. 🧐
In summary: While Trump pushes for immediate cuts to boost the economy, the Fed is taking a measured approach, prioritizing long-term stability over short-term political pressure. ⚖️
War in Ukraine remains tense:
Western leaders, alongside President Zelensky, are calling for a 30-day ceasefire starting May 12. Russia has shown a willingness to negotiate but demands an end to Western military aid — a condition firmly rejected. 🚨
Conclusion: The coming days will be critical. A ceasefire could open the door to new peace efforts. If rejected, expect tougher sanctions and further escalation. 💥
India–Pakistan Conflict:
Tensions between India and Pakistan have escalated sharply following a militant attack on Indian tourists in Kashmir on April 22, 2025. India responded with airstrikes, prompting mutual accusations of missile and drone attacks. 💣 Despite a U.S.-brokered ceasefire announced on May 10, violations followed within hours. Both countries, nuclear-armed, have mobilized troops along the Line of Control. ⚔️ Global powers — including the U.S., U.K., China, and G7 — have urged restraint and offered to mediate. 🌍
2. Technicalwise 📊
1h Timeframe – Bearish Anti-Gartley Pattern
15m Timeframe – Bearish Anti-Butterfly Pattern
That’s not a sign of gold being bullish in the short term. 🚫
Let’s take a look at RSI values across timeframes:
- 5m – 31 – Down ⬇️
- 15m – 37 – Down ⬇️
- 30m – 43 – Down ⬇️
- 1h – 45 – Down ⬇️
- 4h – 46 – Down ⬇️
- 1d – 55 – Up ⬆️
Interpretation of RSI Values 🧐
5m to 4h (31 to 46 – all “Down”)
→ These low RSI values (below 50) across short- to mid-term timeframes indicate ongoing selling pressure and downward momentum. Although not yet in oversold territory (<30), this still signals relative weakness. ⚠️
1d (55 – “Up”)
→ On the daily chart, the RSI is above 50 and rising, suggesting a possible trend reversal or early signs of recovery — a bullish signal over the longer term. 📈
Overall Meaning 🧠
This points to short-term weakness within a broader potential uptrend. The market is soft on lower timeframes — likely in correction or consolidation — while the daily chart begins to show strength. It's a classic pullback setup in an uptrend. 🔄
Possible Strategy Consideration 💡
If you're leaning bullish, look for reversal signals on the smaller timeframes to align entries with the daily trend — such as RSI divergences or breakouts above local resistance. 📊
My Bias 🤔
Bearish sentiment dominates in the short term. Over the next week, I aim to enter short positions targeting $3,200. 📉
If sentiment shifts or key news emerges, a target of $3,400 becomes more realistic. 🚀
-------------------------------------------------------------------------
This is just my personal market idea and not financial advice! 📢 Trading gold and other financial instruments carries risks – only invest what you can afford to lose. Always do your own analysis, use solid risk management, and trade responsibly.
Good luck and safe trading! 🚀📊

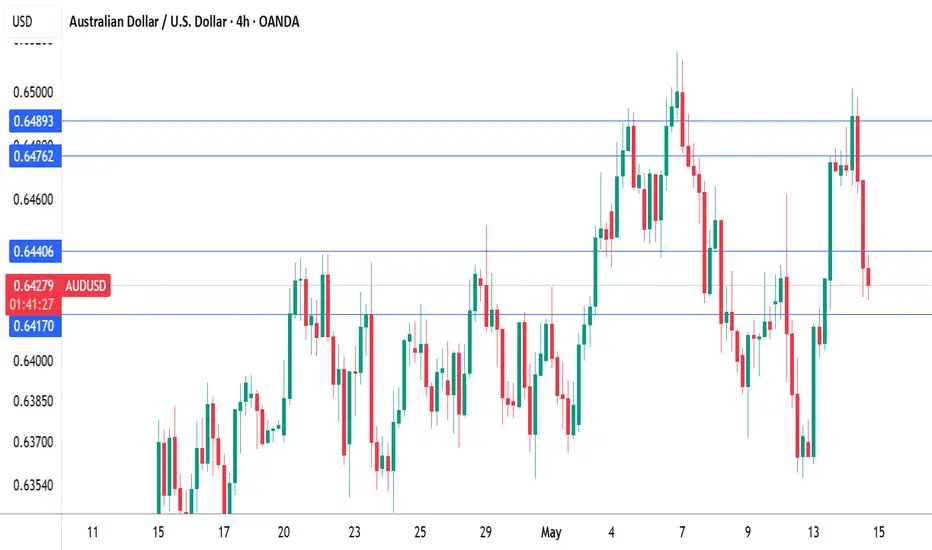
Australian dollar loses ground, jobs report nextThe Australian dollar has declined on Wednesday. In the North American session, AUD/USD is trading at 0.6441, down 0.45% on the day. This follows the Australian dollar's massive gains of 1.5% a day earlier.
Australia's wage growth accelerated in the first quarter. Annually, the Wage Price index gained 3.4%, up from 3.2% in Q4 2024 and above the market estimate of 3.2%. The gain was driven by stronger wage growth in the public sector. On a quarterly basis, wage growth rose 0.9% q/q, up from 0.7% and above the market estimate of 0.8%. This is the first time since Q2 2024 that annual wage growth has accelerated.
The higher-than-expected wage report comes before next week's Reserve Bank of Australia's rate decision. Currently, it looks like a coin toss as to whether the Reserve Bank will maintain or lower rates.
Australia releases employment data on Thursday. Employment change is expected to ease to 20 thousand in April, down from 32.2 thousand in March. The unemployment rate is expected to remain at 4.1%. The labor market has been cooling and if it continues to deteriorate, there will be pressure on the Reserve Bank to lower rates.
At last week's Federal Reserve meeting, Fed Chair Powell said that he would take a wait-and-see attitude in its rate policy. Trump's erratic tariff policy must be frustrating for the Fed, as it makes it difficult to make reliable growth and inflation forecasts.
This week's surprise announcement of a tariff deal between the US and China is a case in point at Trump's zig-zag trade policy. The two sides have been engaged in a bruising trade war and slapped massive tariffs on each other's products. Suddenly, the tariffs were slashed, leading to a sigh of relief in the financial markets. The deal is only for 90 days, and what happens then is very much up in the air.
Japanese yen tumbles to five-week low on US-China tariff dealThe Japanese yen has started the week with sharp losses. USD/JPY is trading at 148.18, up 1.9% on the day. Earlier, the yen strengthened to 148.59, its strongest level since April 3.
The US and China have reached an agreement to slash tariffs on each other's products for 90 days. This would be a major de-escalation in the bruising tariff war between the world's two largest economies. Under the agreement, the US and China will slash tariffs by 115%, leaving US tariffs on China at 30% and China's tariffs on the US at 10%.
The tariff agreement has boosted risk appetite, sending global stock markets higher. The deal has weighed on safe-haven assets like the yen, which is sharply lower on Monday. Gold, another safe-haven, has plunged 3.1% today.
In Japan, household spending and wage growth were down in March. Household spending decelerated to 0.4% m/m, down sharply from 3.5% in February. Average Cash Earnings declined to 2.1% y/y, down from a downwardly revised 2.7% a month earlier. There was more bad news as service-sentiment for April eased, reflecting concern over US tariffs.
These numbers support the case for the Bank of Japan to continue its wait-and-see stance before raising interest rates. The BoJ wants to see inflation remain sustainable at 2%, which will require higher wage growth and stronger consumer spending.
Over the weekend, a host of Fed members made public statements. New York Fed President John Williams and Fed Governor Adriana Kugler both noted that current rate policy was in an appropriate place and suggested patience was needed. This message echoed Fed Chair Powell's remarks at last week's FOMC meeting, when he said the Fed would take a wait-and-see attitude due to the uncertainty over US tariffs.
USD/JPY has pushed above resistance at 146.83 and 147.48 and is testing resistance at 148.47. Above, there is resistance at 149.04
146.11 and 145.36 are the next support levels

Liberation, Altercation & Boom: US China Trade talks CME_MINI:ES1!
Pointing to our previously written blog post (Liberation, Altercation or Doom) on March 31st. A mix of all scenarios played out.
Global universal tariffs with reciprocal tariffs layered on top. It resulted in a huge sell-off on April 2nd.
After months of tit-for-tat tariffs and growing economic friction, the US and China have agreed to hit pause. In a joint statement that’s given markets some breathing room, both countries announced a 90-day suspension on a large portion of their punitive tariffs—an initial step toward dialing back tensions and restarting dialogue.
Key Tariff Measures from US-China Joint Statement (90-Day Pause)
US Tariff Reductions:
Tariffs on Chinese goods were reduced from 145% to 30% for a 90-day period.
24 percentage points suspended, leaving a 10% base tariff in place.
China Tariff Reductions:
Tariffs on US goods reduced from 125% to 10% for the same 90-day period.
China also suspends 24 percentage points of additional ad valorem duties.
Retains a 10% baseline tariff on US imports.
Non-Tariff Measures: China to suspend or remove all non-tariff countermeasures imposed since April 2.
Includes sanctions on certain US companies.
Lifts export controls on some critical minerals.
Timeline & Commitment:
Both parties agree to implement these actions by May 14.
Commitment to continue trade and economic talks through a new bilateral mechanism.
Talks may be held in alternating locations (US/China) or via third-party venues.
No Agreement On:
Currency policy.
E-commerce “de minimis” exemptions.
Sector-specific tariff frameworks.
Future Key Dates and Timeline:
May - Potential US semiconductor tariffs.
May/June - Potential US pharmaceutical tariffs.
July 8th - 90-day tariff lowering for "worst offenders" expires.
July 14th - US tariffs on Mexican agriculture goes into effect.
August 10th - US-China tariff relief expires.
Was this really mutual or just a game of chicken?
There’s an argument to be made that this is more of a tactical pause than a full reconciliation. With China’s GDP in purchasing power parity terms now surpassing that of the US, and its continued technological advancements across sectors like aerospace, semiconductors, and critical minerals, the balance of economic leverage is shifting. For investors, this isn’t just about tariffs—it’s about the evolving structure of global trade.
Geopolitical undercurrents continue to shape the backdrop. China’s strategic influence in regional security, technology supply chains, and commodity access adds another layer to its negotiating position. Recent developments—such as China's reassertion of dominance in strategic corridors and growing control over key mineral exports—suggest its economic posture is becoming more assertive. This, in turn, has implications for US firms dependent on Chinese inputs or facing retaliatory restrictions.
In short, the 90-day window presents a tactical opportunity, but the structural story remains complex. Investors would be wise to monitor not just tariff updates, but broader shifts in trade alliances, export controls, and supply chain vulnerabilities—especially in sectors like tech, energy, and defense-adjacent industries.
ES Futures:
ES Futures and risk on assets are positive across the board following this announcement.
Key Levels:
Key LVN/ Key LIS: 5861-5837.25
200 Day MA: 5872.99
0.786 Fib Retracement level: 5921.75
0.618 Fib Retracement level: 5688.75
pWkHi: 5741
mCVAL 2025: 5639.75
Expectations for the week ahead:
US CPI and Retail Sales data on the docket this week along with slew of FED speakers.
Scenario 1: Risk on
ES Futures get back above 200-day moving average clearing the key LVN resistance zone and our key LIS, head towards 0.786 Fib retracement level before pulling back and consolidating for the remainder of the week.
Example trade:
Entry: 5861
Stop: 5837
Target: 5921.75
Risk: 96 ticks
Reward: 243 ticks
Risk/Reward ratio: 2.5 R
Scenario 2: Further consolidation
Markets consolidate below the key LVN resistance zone and prior weekly high.
Example Trade:
Entry: 5837
Stop: 5861
Target: 5741
Risk: 96 ticks
Reward: 384 ticks
Risk/Reward ratio: 4 R
Glossary:
VA: Value Area
VPOC: Volume Point of Control
VAL: Value Area Low
C: Composite (used as a prefix: VA, VAL, VAH, VPOC, etc.)
mC: micro Composite (used as a prefix: mCVA, mCVAL, etc.)
LNV: Low Volume Node
LIS: Line in Sand
Important Notes:
These are example trade ideas not intended to be a recommendation to trade, and traders are encouraged to do their own analysis and preparation before entering any positions.
Stop losses are not guaranteed to trigger at specified levels, and actual losses may exceed predetermined stop levels.

Canadian dollar shrugs after mixed employment numbersThe Canadian dollar is steady on Friday, after a two-day slid in which the loonie declined by 1%. In the North American session, USD/CAD is trading at 1.3911, down 0.09% on the day. On the data calendar, Canada released the employment report and there are no US economic releases.
The April employment report didn't show much change and the Canadian dollar has shown little reaction. The economy added 7.4 thousand jobs, rebounding from the loss of 32.6 thousand in March and above the market estimate of 2.5 thousand. At the same time, the unemployment rate climbed to 6.9%, higher than the market estimate of 6.8% and above the March reading of 6.7%. This was the highest level since Nov. 2024.
The rise in unemployment is likely a reflection of the US tariffs. Canada's exports to the US were down in March, hurting businesses that export to the US. If the tariffs remain in place, weaker demand from the US could significantly damage Canada's economy.
The Bank of Canada released its Financial Stability Report on Thursday. The BoC said that the financial system was strong but warned that a prolonged trade war between Canada and the US could lead to banks cutting back on lending, which would hurt consumers and businesses and damage the economy. The report said that the unpredictibility of US trade policy could cause further market volatility and was a risk to financial stability.
The Federal Reserve maintained rates earlier this week and Fed Chair Powell said the Fed was in a wait-and-see-stance due to the uncertainty over the US tariffs. We'll hear from seven Fed members on Friday and Saturday, who may provide some insights on where rate policy is headed. The markets have priced in a rate hike in June at only 18%, down sharply from 58% a week ago.
USD/CAD is testing resistance at 1.3928. Above, there is resistance at 1.3935
1.3922 and 1.3915 are the next support levels

Nightly $SPY / $SPX Scenarios for May 8, 2025🔮 Nightly AMEX:SPY / SP:SPX Scenarios for May 8, 2025 🔮
🌍 Market-Moving News 🌍
🇺🇸 Fed Holds Rates Steady Amid Economic Uncertainty
The Federal Reserve maintained its benchmark interest rate at 4.25%-4.5%, citing concerns over rising inflation and economic risks. Fed Chair Jerome Powell emphasized a cautious approach, indicating no immediate plans for policy changes.
🤝 U.S.-China Trade Talks Scheduled
Treasury Secretary Scott Bessent and chief negotiator Jamieson Greer are set to meet China's economic head He Lifeng in Switzerland, marking a potential step toward resolving trade tensions. The announcement has positively influenced global markets.
📈 Record $500 Billion Share Buyback Plans
U.S. companies have announced a record-breaking $500 billion in share buybacks, reflecting growing hesitation to make capital investments amid economic uncertainty driven by President Trump's trade policies. Major contributors include Apple ( NASDAQ:AAPL ), Alphabet ( NASDAQ:GOOGL ), and Visa ( NYSE:V ).
⚠️ Recession Warnings from Economists
Former IMF chief economist Ken Rogoff warns that a U.S. recession is likely this summer, primarily driven by President Donald Trump's aggressive tariff policies. He suggests that markets are overly optimistic and not adequately accounting for the risks.
📊 Key Data Releases 📊
📅 Thursday, May 8:
8:30 AM ET: Initial Jobless Claims
8:30 AM ET: Continuing Jobless Claims
8:30 AM ET: Nonfarm Productivity (Q1 Preliminary)
8:30 AM ET: Unit Labor Costs (Q1 Preliminary)
10:00 AM ET: Wholesale Inventories (March Final)
10:30 AM ET: Natural Gas Storage
⚠️ Disclaimer:
This information is for educational and informational purposes only and should not be construed as financial advice. Always consult a licensed financial advisor before making investment decisions.
📌 #trading #stockmarket #economy #news #trendtao #charting #technicalanalysis

BMW: Stability, Innovation, and Opportunity in a Changing WorldIn times of market turbulence, great opportunities often lie hidden beneath temporary setbacks. Recent tariff-related ripples may have rattled BMW’s price, but for those looking to invest for the long haul, this dip is a golden opportunity to buy into one of the world’s most reliable automakers.
www.youtube.com
Resilient Amid Tariff Turbulence
Global trade frictions and tariff uncertainties have impacted many companies, and BMW is no exception. Yet, unlike many peers that retreat during such times, BMW remains steadfast—confident in its strategy and outlook. With industry insiders predicting that these tariffs are only temporary, BMW’s fundamentals remain ironclad. Its robust global presence and proactive planning have positioned it to weather these short-term shocks and bounce back stronger.
A Diverse, Future-Ready Product Lineup
While some high-profile names in the auto space chase trends with empty promises, BMW consistently delivers. Rather than focusing solely on electric vehicles like Tesla, BMW offers a balanced portfolio:
- Low-Emission Fossil Fuel Cars: Advanced, efficient engines that still serve a significant market segment.
- Hybrid and Electric Vehicles: Designed for the evolving demand for cleaner mobility, these models blend performance with environmental responsibility.
- Pioneering Hydrogen Technology: In collaboration with strategic partners, BMW is blazing a trail in hydrogen-powered vehicles—a potential game changer that ensures adaptability as the energy landscape shifts.
This diverse lineup not only meets current market needs but also positions BMW at the forefront of future mobility, delivering real, tangible products that work.
World-Class Manufacturing and Advanced Robotics
BMW’s reputation for engineering excellence isn’t just about beautiful design—it’s rooted in its state-of-the-art manufacturing. The company has embraced advanced robotics and automation, ensuring precision, efficiency, and consistent quality. With production facilities spanning the globe—including significant plants in the United States—BMW solidifies its stature as a truly international enterprise.
A Stable, Dividend-Paying Investment
In a market that often rewards volatile “meme” stocks and empty promises, BMW stands apart as a beacon of stability. Unlike Tesla, which currently pays no dividends, BMW offers a juicy dividend yield of over 5%, providing investors with regular, attractive returns. This dividend, coupled with its solid operational fundamentals, makes BMW a safe bet—one that rewards shareholders consistently even during turbulent times.
The Time to Invest Is Now
BMW is more than just a carmaker—it’s a symbol of resilience, innovation, and pragmatic progress. While market chatter may cast doubt amid temporary tariff-induced lows, the company’s diversified product mix, global manufacturing footprint, and commitment to delivering real, advanced technology create a compelling investment thesis.
For investors seeking stability, reliability, and the promise of long-term growth, BMW offers an opportunity to ride out the storm and benefit from a future where the company’s innovations in hybrids, electrics, and hydrogen continue to shape mobility worldwide. Now is the time to look beyond short-term market jitters and invest in a legacy built on quality, performance, and consistent returns.
Embrace the opportunity—BMW’s bright future is not just a promise; it’s already in motion.
XETR:BMW SIX:BMW NASDAQ:TSLA NYSE:GM NYSE:F

Is this an Asian currency crisis in reverse? The Taiwan Dollar surged more than 5% against the U.S. dollar on Monday, briefly pushing USD/TWD below the 29.00 mark.
The two-day rally—totaling nearly 10%—is the sharpest in over three decades. But Taiwan isn’t alone. A broader wave of U.S. dollar selling has lifted several Asian currencies, including the Singapore Dollar, South Korean Won, Malaysian Ringgit, Chinese Yuan, and Hong Kong Dollar.
Goldman Sachs reported on Tuesday that investor positioning has shifted significantly, with clients moving from short yuan positions to long ones—suggesting a growing expectation of continued U.S. dollar weakness.

US Stocks Pare Back All Tariff-Fueled Losses. Are We So Back?Remember “Liberation Day”? The one that felt more like Liquidation Day ? When markets tanked, tickers turned red, and you were afraid to check the markets on the next day? Well, turns out the rumors of the market’s demise were — once again — greatly exaggerated.
If the average recession 10 years ago lasted two years, this year’s recession was approximately 37 minutes (more or less, depending on the day).
Just a month ago, the S&P 500 SP:SPX started crumbling to the point it entered into correction territory (and then got out of correction territory ).
Long story short, it took the punches, went down 15%, stood back up, and is now throwing jabs with a nine-day winning streak — its longest since 2004, when iPods were still a thing and Facebook was just for Harvard students.
So… are we back? Like, really back? Let’s dig in.
💰 Trillions Lost, Trillions Found
On April 2, President Donald Trump dropped the hammer — or rather, the online post — unveiling his “reciprocal tariffs,” which, in true Trumpian fashion, sounded equal parts policy and promo PR.
Markets didn’t take it well. Global stocks collectively threw a tantrum. The S&P 500 dropped like it had a brick in its pocket . Financials cratered, energy took a gut punch, and tech? See for yourself — we don't want to talk about it .
But now? The dip buyers are shopping up, scooping up, snapping up everything from banks to oil stocks to beleaguered megacaps. Suddenly, all those stock discounts look like missed opportunities, and the cash-on-the-sidelines traders are jumping in.
👌 Jobs Data: Not Too Hot, Not Too Cold
Friday was a good day. Why? Because April’s nonfarm payrolls ECONOMICS:USNFP report came in at 177,000 jobs — not too strong to trigger Fed-tightening fears, not too weak to imply economic decay. It was the goldilocks print.
The number was a drop from March’s revised 185,000, but what mattered was the beat: economists had pencilled in just 135,000. Markets took that as permission to throw a party.
The S&P 500 jumped 1.5%, reclaiming the level it had before Trump’s tariff tirade and putting an emphatic end to the selloff. Nine green days in a row? That’s a bull flex Wall Street hasn’t seen in two decades.
💥 Truth Social Posts That Move Markets
Not to be left out of the celebration, Trump hopped onto Truth Social with his usual caps lock enthusiasm:
“THE FED SHOULD LOWER ITS RATE!!!”
Sounds familiar?
Still, even without a rate cut (for now), the market got what it wanted: signs that the US labor market isn’t collapsing, trade talks might be back on the table, and the economy hasn’t lost its way.
😌 A Global Sigh of Relief
While the US led the rally, global markets also joined the rebound chorus. China’s commerce ministry chimed in Friday, saying Washington had expressed a “desire to engage in discussions.” In market-speak, that translates to: "Everyone calm down — we might not blow this up after all."
It doesn’t take much to change sentiment. A tweet here, a headline there, a hint of diplomatic progress — suddenly risk appetite returns and everyone forgets they were panic-selling just three weeks ago.
But don’t go lining up the espresso martinis just yet — not everything is fully recovered. The US dollar, for example, remains nearly 4% below its pre-tariff-announcement level.
🤔 We Are So… Back?
So are we officially back? Short answer — “put the word out there that we back up” for now . Markets are up, volatility is down, and everyone’s pretending they didn’t sell the dip at the worst possible time.
But — and you knew there’d be a “but” — caution still applies. Trade tensions aren’t over. The next Trump post could shake things again. The Fed hasn’t made its next move (that’s coming this Wednesday). And geopolitics remains a powder keg.
Still, what this rebound tells us is clear: the market has resilience. Maybe not logic. Maybe not grace. But resilience? Yes.
It also reminds us that trying to time news-driven selloffs is a dangerous game. Often, the best trades happen when fear peaks and everyone else is running for the hills.
👉 Final Thoughts: Watch the Calendar, Not the Chaos
The key takeaway from this tariff-to-rally rollercoaster? Markets can move fast — but they can also recover faster. If you panicked, you probably sold low. If you stayed focused, checked the earnings calendar , and remembered that market narratives shift like wind direction, you're probably doing well right now.
We’re so back — for now. But stay sharp. This market may have nine lives, but it also has the attention span of a toddler.
Your move : Did you ride the dip? Buy the bounce? Or just mute the chaos and sip your coffee? Drop your best “Liberation Day to Redemption Rally” trade below.

Is the Golden Arches Losing Its Shine?McDonald's, a global fast-food icon, recently reported its most significant decline in U.S. same-store sales since the peak of the COVID-19 pandemic. The company experienced a 3.6 percent drop in the quarter ending in March, a downturn largely attributed to the economic uncertainty and diminished consumer confidence stemming from President Donald Trump's tariff policies. This performance indicates that the unpredictable nature of the trade war is prompting consumers to curb discretionary spending, directly impacting even seemingly resilient sectors like fast food through reduced customer visits.
The link between sinking consumer sentiment and tangible sales figures is evident, as economic analysts note the conversion of "soft data" (sentiment) into "hard data" (sales). While some commentators suggest that McDonald's price increases have contributed to the sales slump, the timing of the decline aligns closely with a period of heightened tariff-related anxiety and a contraction in the U.S. economy during the first quarter. This suggests that while pricing is a factor, the broader macroeconomic environment shaped by trade tensions plays a critical role.
In response, McDonald's emphasizes value offerings to attract and retain customers navigating a challenging economic landscape. The company's struggles mirror those of other businesses in the hospitality sector, which also report reduced consumer spending on dining out. The situation at McDonald's serves as a clear illustration of how complex trade policies and the resulting economic uncertainty can have far-reaching consequences, affecting diverse industries and altering consumer behavior on a fundamental level.

MARKETS NOT OVERSOLD CAUTION! UPDATE!This is a monthly chart and TV keeps forcing "Target reached" on my updates. As such i am reposting this chart I first issued back on April 1st, 2025, before our "LIBERATION DAY" FACEPALM!
We are still not oversold on a monthly chart!
WARNING!
Click Boost, follow, subscribe!

USOIL CAUTION! BREAK - TEST - GO!This is my new updated chart of Oil.
Trump's "Drill baby Drill" interfering with the free market is the absolute worst thing he could do. His ridiculous tariffs will put us in an economic depression!
Oil prices are driven by demand! As I have mentioned here on TV so many times before! Increasing supply while heading into a recession is the dumbest thing possible! You never want to consume your own oil when you can consume others first! Simultaneously, F your own nation's oil company's profit margins and gov tax revenue!
This is why we shouldn't put toddlers as POTUS!
Anyway!!! This is a break test go! setup!
If you haven't seen it before, here is an example I recently posted with AAPL.
Click Boost, follow, subscribe! Let's get to 5,000 followers so I can help them navigate these crazy markets too. ))

DXY ReturnOne half of an inverse head and shoulders formed on the 1D chart. Pattern could complete on talks of tariffs calming. Ukraine mineral agreement will be good for USD long term.

SPX: Good push at EOD 4/30, but…Possible H&S? Hear me outGood push at end of day on 4/30 at close.
Zooming out, it’s starting look like it’s forming a H&S. I’m starting to see a lot of people flipping bearish as well. But, also near close today, volume was not promising, declining at the close.
I swung short-term puts on SPY, I like SPX puts for a day trade due to this formation but this H&S can possibly out within the end of week with more data and uncertainty or the following week.
I’m short at the touch of the light red line: 5655.79 to the downside.
Gaps below 5354.76, 5206.44
Would say by EOW to next week, if we pull back, may form/complete the right shoulder.
Do your DD!
Let me know your thoughts! #NFA

DXY Printing a Bullish Triangle??The DXY on the 1 Hr Chart is forming a potential continuation pattern, the Bullish Triangle!
Currently Price is testing the 99.6 - 99.8 Resistance Area and battling with the 200 EMA and 34 EMA Band. The reaction to this conjunction could be pivotal in who overcomes: Buyers or Sellers.
Now during the formation of the potential pattern, Price on the RSI has stayed relatively Above the 50 mark being Bullish Territory suggesting Buyers could win the Bull-Bear battle.
Until Price breaks either the Resistance Area or the Rising Support, we will not have a definitive direction in which USD will strengthen or weaken.
*Wait For The Break*
-If Price breaks the Resistance Area, USD will strength possibly heading to the 100.8 - 101 Area
-If Price breaks the Rising Support, USD will weaken possibly heading to the 98.5 - 98.3 Area
Fundamentally, it is said China and USA are possibly getting closer to potentially ending the Reciprocal Tariff War going on with both sides willing to negotiate.
With the USA being the #1 Consumer of Goods globally, other economies can not afford us to not buy their things so I continue to see the Tariff War more as a Strong-Arm for the USA to be able to negotiate better terms!
USD News:
JOLTS - Tuesday, Apr. 29th
GDP - Wednesday, Apr. 30th
Unemployment Claims / ISM Manu. PMI - Thursday, May 1st
Non-Farm Employment Change / Avg Hourly Earnings / Unemployment Rate - Friday, May 2nd
For all things Currency,
Keep it Current,
With Novi_Fibonacci

MAGS SUPER STRUCTURE FORMING CAUTION!We have MEGA superstructures forming everywhere. H&S Eiffel Towers, etc.. None will be more devastating to 401ks and people's portfolios than the MAGS breaking down from this mammoth structure.
Last chance to GTFO forming.
CAUTION is in order!
Click Boost, Follow, Subscribe. Let's get to 5,000 followers ))

Navigating Trump Tariffs on the Dow JonesNavigating the movements of the **US30 (Dow Jones Industrial Average)** can be challenging, especially amid shifting economic policies. The Dow, which tracks 30 major U.S. companies, is highly sensitive to trade policies, corporate earnings, and geopolitical risks. Trump’s plan to impose **10% across-the-board tariffs** and **60%+ tariffs on Chinese goods** has sparked concerns about inflation, supply chain disruptions, and retaliatory trade measures. Investors are closely watching how these policies could impact multinational companies within the index, particularly those reliant on global trade, such as **Boeing, Apple, and Caterpillar**.
For everyday Americans, higher tariffs could mean **rising prices on imported goods**, from electronics to household items, worsening inflation. While tariffs aim to protect domestic industries, they often lead to **higher production costs** for businesses that rely on foreign materials, potentially triggering job cuts or reduced consumer spending. The stock market’s reaction—volatility in the US30—reflects these uncertainties, as investors weigh the risks of slower growth against potential benefits for U.S. manufacturers.
Traders navigating the US30 must monitor **Fed policy, corporate earnings, and trade war developments**. If tariffs escalate, defensive stocks (utilities, healthcare) may outperform, while industrials and tech could face pressure. Long-term investors might see dips as buying opportunities, but short-term traders should prepare for turbulence. Ultimately, Trump’s tariff policies could reshape market dynamics, making adaptability key for those trading the Dow.
