AL JOUF CEMENT – BUY PLAN (TADAWUL: 3091)📈 AL JOUF CEMENT – BUY PLAN (TADAWUL: 3091)
✅ Current Status:
Price: 7.09 SAR
Action: Initial entry taken — some shares added to My portfolio.
🔍 Technical Overview:
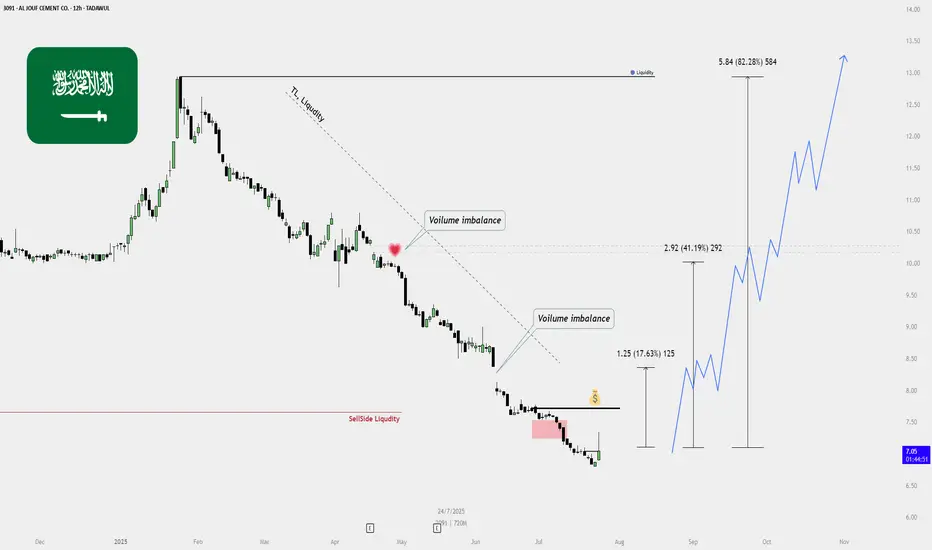
Sell-side Liquidity Cleared:
Previous lows taken out, triggering liquidity sweep.
Strong reversal suggests potential shift in market sentiment.
Volume Imbalances (Voids):
Bullish targets marked based on unfilled volume gaps:
📍 Target 1: 8.34 SAR (➕17.63%)
📍 Target 2: 10.01 SAR (➕41.19%)
📍 Target 3: 12.93 SAR (➕82.28%)
Trendline Liquidity Above:
Long-term descending trendline can act as a magnet for price, drawing it upward.
Bullish Confirmation:
Price has reacted from a bearish fair value gap.
Clean bullish engulfing and strong volume — suggests start of reversal.
🎯 Buy Strategy Breakdown:
Step Action
✅ Partial buy/entry completed (accumulation started)
📉 Wait for small pullback or bullish continuation to add more
🛡️ Stop Loss: Below recent swing low (around 6.50 SAR)
🚀 Targets: TP1 – 8.34, TP2 – 10.01, TP3 – 12.93
🔁 Re-evaluate plan if price closes below 6.70 with volume
TASI
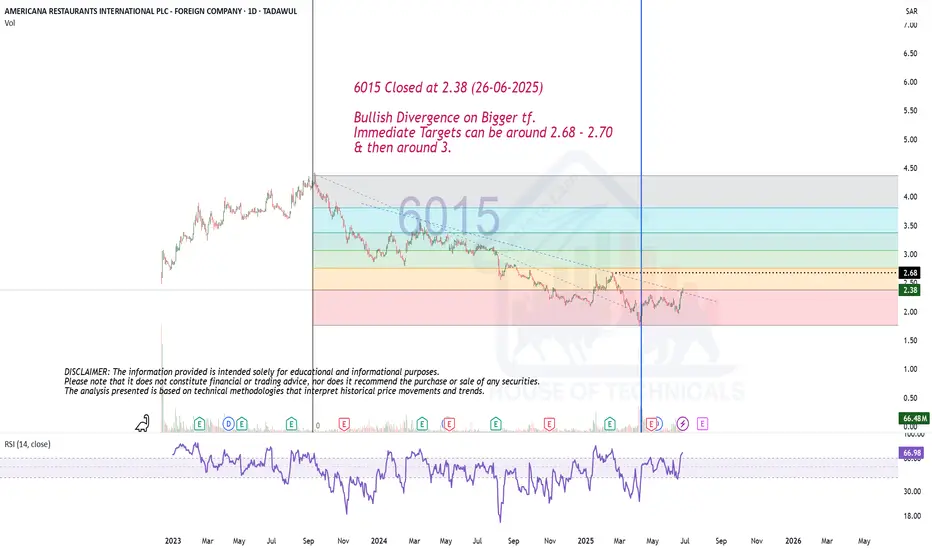
Bullish Divergence on Bigger tf.6015 Closed at 2.38 (26-06-2025)
Bullish Divergence on Bigger tf.
Immediate Targets can be around 2.68 - 2.70
& then around 3.
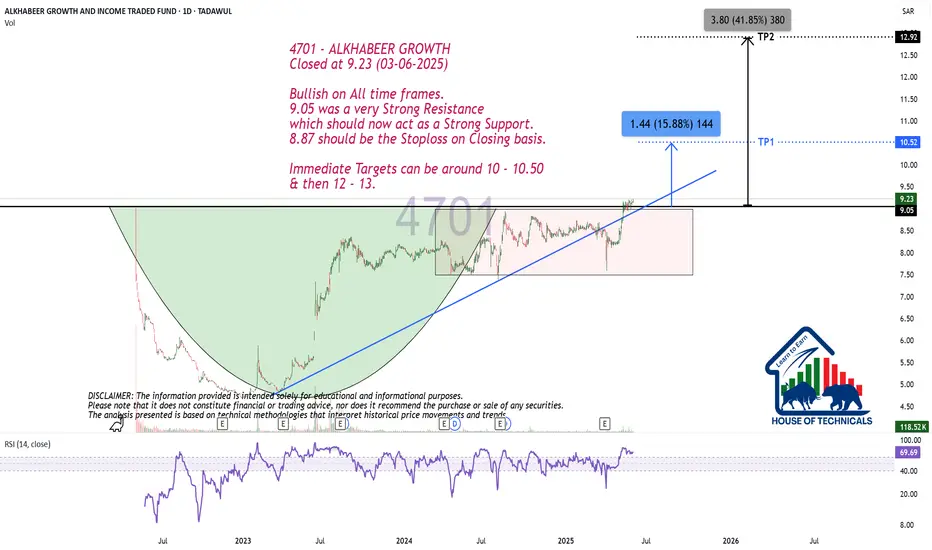
Bullish on All time frames.
Closed at 9.23 (03-06-2025)
Bullish on All time frames.
9.05 was a very Strong Resistance
which should now act as a Strong Support.
8.87 should be the Stoploss on Closing basis.
Immediate Targets can be around 10 - 10.50
& then 12 - 13.
Bullish
Bullish Divergence on Daily tf.
Immediate resistance is around 83 - 83.50
Very important to cross & sustain 86 - 87
for further upside.
However, should not breakk 65.50 , otherwise
we may witness further selling pressure.

Bullish Divergence on Monthly TF.Bullish Divergence on Monthly TF.
Weekly Support seems to be around 30.
& Important Resistance is around 32-33.
Though a re-testing of breakout done. but
Important to Sustain 24.90
As of now, Stock is in sideways movement;
& it will be Bullish once it will cross 36.
A positive point is that there are multiple
bullish / hidden bullish divergences on
different time frames.

BUY TASIAnd yes, here is the opportunity y'all been waiting for, you can buy TASI now and set your levels as set on my chart!
This is one of the 7 trades I shared to my cients, you can follow so whenever I drop the others you can take them!

TASI Weekly Outlook – Bullish Play in Progress!📈 TASI Weekly Outlook – Bullish Play in Progress! 💥
After forming a solid base around the Monthly Type 2 Zone, TASI is showing bullish signs of accumulation. We're now watching a potential explosive move toward the Context Target at 12,895.754 🚀.
The current structure suggests a short-term pullback before continuation—ideal for bulls waiting for a clean entry. Eyes on the prize as we aim for higher highs. 🔥
🧠 By: Asif Brain Wave

SAUDI ARAMCO BASE OIL - Daily Chart (TADAWUL)SAUDI ARAMCO BASE OIL - Daily Chart (TADAWUL)
"After a long bearish phase, the market finally pauses to breathe. If the next bullish leg confirms, it will unlock the roadmap to higher targets. With strong conviction, I believe the 2025 low is already in place. Eyes on 107.4 first, then 111.8. Let price reveal the story.

4081 Naifat Finance (TADAWUL)📊 Trade Idea Overview – Weekly Timeframe
✅ Key Technical Levels:
Demand Zone: Clearly marked between 12.00 – 13.00, showing strong historical buyer interest.
Current Price: 13.38
Fibonacci Retracement Levels: Price is reacting near the 0.705 - 0.79 zone, which often acts as a bullish reversal area.
Target Price: 18.40 — Identified as Buy-Side Liquidity Zone (BSL) and a previous significant high.
Resistance Zone: Around 18.40, where liquidity is likely to get captured by smart money.
📌 Narrative & Market Context:
Price has shown a bullish reaction from the Demand Zone, indicating accumulation or potential bottom formation.
Fibonacci confluence with demand strengthens the bullish setup.
Once price breaks above 14.00, a bullish market structure shift will be confirmed.
The chart also visualizes a projected path toward 18.40, indicating a strong bullish impulse wave ahead.
📈 Expected Price Path (as shown in chart):
Minor pullback toward 13.00 area (retest demand / Fibonacci zone).
Breakout above 14.00 – a key structural shift.
Bullish continuation toward 18.40 Buy-Side Liquidity.
📍 Trading Plan Suggestion:
Entry Zone: Between 13.00 – 13.20 (ideal demand re-entry).
Stop Loss: Below 12.00 (invalidate demand structure).
Take Profit: 18.40
Risk-Reward Ratio: Excellent (Potentially 1:3+ R:R)

TASI IS PREPARING AN ENTRYAfter that TASI has taken the liquidity at 11,553, it just gave us an indication that it will start going bullish, no clean entry for now, but we'll keep waiting.
Meanwhile, my clients and I have taken other trades on 3 other stocks that are still in a safe zone, waiting for them to go higher so I can share them to the public.
As soon as I catch the entry and share it to my clients, I will share it to the public.
If you really care about taking clean entries, you must wait for the confirmation of the up movement then you can have a safe entry.
Follow for more!


@ Important Support LevelDouble Bottom Formation on Daily TF.
45.50 if Sustained on Weekly basis,
Next Targets can be around 47 initially.
It may test 41.90 - 42 again, prints a
double bottom on Shorter TF & then bounce.
However, 41.50 should not be broken.

TASI IS PREPARING A BULLISH MOVEMENTCouple days ago, I posted that TASI will come lower to 11,535.390, and here it is now on the level in which it will probably create us an entry to take to target higher levels.
Follow so you don't miss the future updates!

Bullish on 2382 ADES TASI Fake breakout on 1H and close daily above Monthly level (orange line)
Wait for retest and target 17.18 price level

Wait for retrace on 7020 MOBILY TASI Wait for retrace to test old high + Weekly FVG
Then looking for entry

Different Time FramesMonthly View:
Monthly Support is around 11200 - 11500
Important Resistance is around 12500 -12700
Weekly View:
Weekly Closing above 12000 is Important for
touching the Resistance of 12500 - 12700.
Daily View:
Hidden Bullish Divergence has appeared which
is a positive sign.
If the Selling Pressure continues, we may expect a
bounce back from 11500 - 11600. Otherwise
today's Closing above 11820 can be a Positive Sign.

Currently in Bearish Trend. Currently in Bearish Trend.
H&S Pattern in play targeting around 40ish.
Weekly Closing above 70 may be a Positive
sign. However, if the selling pressure continuous,
we may witness 67 & then 63.
In my view, it should test 74 - 75 once before going
down (if it has to).
Important Resistance is around 75 - 76.
Important Supports are 67 - 69 & then around 63.
One positive sign is that there is a double Bullish
Divergence on Shorter Time Frames. If it plays now,
we may see 73 - 75 (which is again a Resistance level).

Make it or Break it Situation.
Currently at Rectangular Channel Bottom.
Few Green Candles at Current level may bounce
the price but 254 - 257 is a Resistance area that
needs to be Crossed & Sustain.
Next Important Resistance level is around 288 - 290.
However, if the Current Level is broken, we may
see further selling pressure & it may touch 240 & then
may be the range of 210 - 222 in worst case.

Morning Star formation on Daily TF but..Morning Star formation on Daily TF.
Monthly Closing above 29 would be a Positive Sign.
However, 28 - 29 can be a Good Support Zone.
28.50 should not be broken, otherwise further
Selling Pressure can be witnessed.
On the flip side, 32 - 32.50 is an Important Resistance.
However, only Morning Star formation is not enough, because
it is currently at Strong Resistance around 32 - 32.5, so
let it sustain this level.
Sustaining this level may give 2-4 riyals gain.

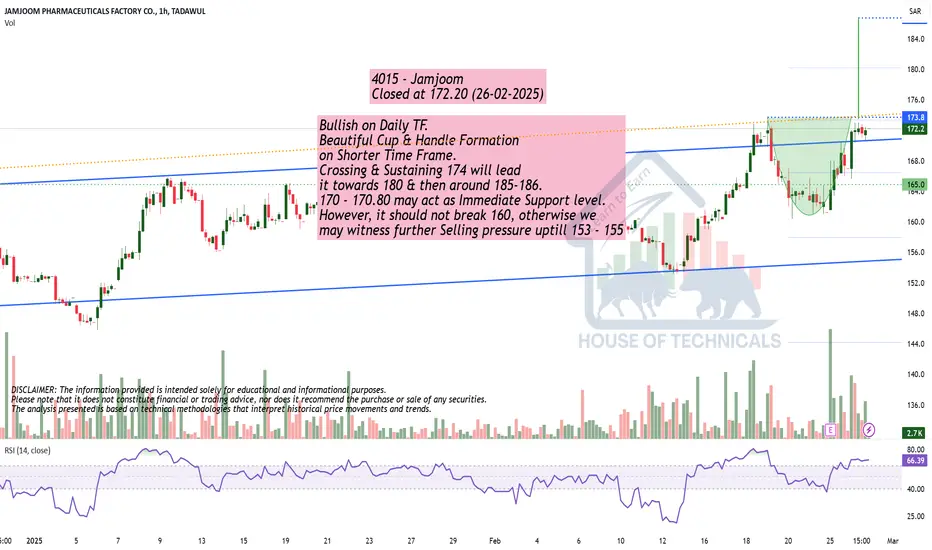
Bullish on Daily TF.Bullish on Daily TF.
Beautiful Cup & Handle Formation
on Shorter Time Frame.
Crossing & Sustaining 174 will lead
it towards 180 & then around 185-186.
170 - 170.80 may act as Immediate Support level.
However, it should not break 160, otherwise we
may witness further Selling pressure uptill 153 - 155
TASI IS GOING BEARISHAs you can notice on the chart, TASI as I told you in older posts, it grabbed the LQ at 12,302.190-12,333.861, gave us an entry point and now it is heading towards the level 11591.374 where it will grab the LQ.
For the people who have already bought, you can close and enjoy your profits, and for those who are willing to buy, the wise thing to do is hold your funds.
For further questions, don't hesitate to ask!
Follow for more!

#3090 #Tabuk CementBased on the pattern identified on the weekly chart, a bullish flag pattern is currently forming. This suggests a continuation of the previous upward trend. Given the characteristics of the pattern, we can plan entries on a medium to long-term timeframe by closely monitoring the identified levels on the chart. Entries only a breakout.
"Non financial advice, do your own research"

2281: Bullish Reversal from POC_Golden Pocket2281
Continuously in downtrend. Earlier estimations of reversal from bearish flag completion and support levels did not sustain (Bears dominated).
However, current price movement (green candles) at POC is confirming the interest of buyers.
This is in confluence with 50% fib (Golden Pocket)
Entry can be taken now (HH) or after formation of HL (conservative)
Keep SL intact as identified.
