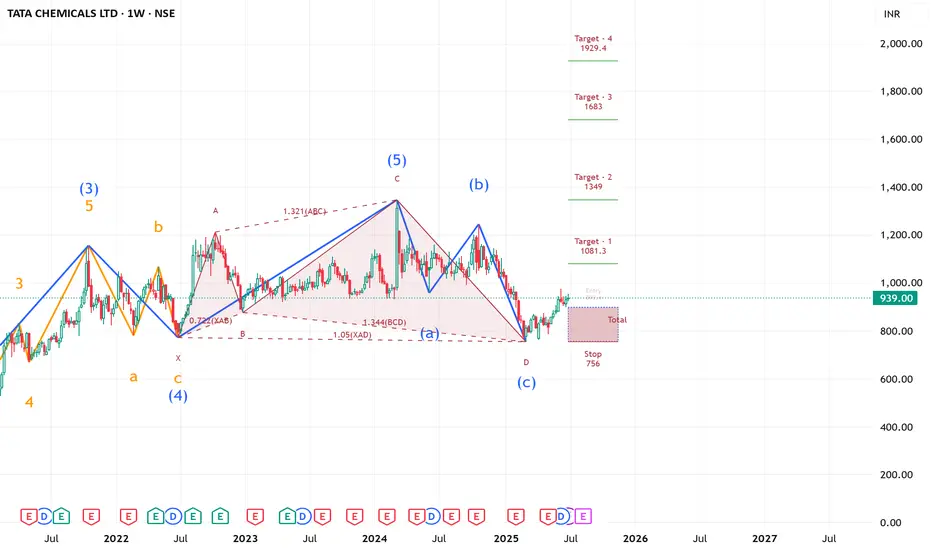
TATA CHEMICALS Ready to FIRE ( LONG TERM IDEA ) !!!TATA CHEMICALS' weekly counts indicate a bullish wave structure.
Both appear to be optimistic, and this stock's invalidation number is 756.
Investing in declines is a smart move for long-term players.
Long-term investors prepare for strong returns over the next two to five years.
TOP PLAYER IN THE INDUSTRY OF CHEMICALS
Every graphic used to comprehend the theory of elliot waves, harmonic waves, gann theory, and time theory
Every chart is for educational purposes.
We have no accountability for profit or loss.
Tatachemicals
TATACHEM--This stock is facing the resistance from top levels at 1150 levels...
price is trading in a channel...
now it is ready to breaks the channel, after strong break price gives us some retracement to enter short side again for targets of below demand zone...
soo keep look for short side up to the below demand zone and support levels.

Tata Chemicals can be slow but is looking solid.Tata Chemicals Ltd. CMP – 1011.90 (Long Term Investment Idea)
Market Capitalization Rs 25,778.8Cr
Red Flags:🟥
FIIs are decreasing stake
MFs are decreasing stake
Green Flags:🟩
No debt
Zero promoter pledge
Improving annual net profit
Improving cash from operations annual
Dividend Yield @CMP = 1.78%
Previous Happy Candles Number – 87/100
New Happy Candles Number – 79/100
Fresh Entry/ averaging / compounding after closing above 1031
Targets: 1063 and 1084.
Long term target: 1108+.
Stop loss: Closing below 935.
The above information is provided for educational purpose, analysis and paper trading only. Please don't treat this as a buy or sell recommendation for the stock. We do not guarantee any success in highly volatile market or otherwise. Stock market investment is subject to market risks which include global and regional risks. We will not be responsible for any Profit or loss that may occur due to any financial decision taken based on any data provided in this message.

Tatachem - Elliott Wave CountTatachem - Elliott Wave Count
The market appears to be in a bearish trend, and we can expect wave C to complete between 780 and 680. After that, we can expect an upward rebound.
Please exercise caution when trading as this information is for educational purposes only.
NSE:TATACHEM NSE:TATACHEM1! BSE:TATACHEM

TATA Chemicals NSE:TATACHEM
The firm’s consolidated net profit hiked by 53% to Rs 711 crore in the March quarter, while revenue from operations leaped by 27% to Rs 4,407 crore. It's alright hyped on monthly timeframe. On weekly it can touch the previous high. But for now it appears to be range bound.
Trading setup of 10% gains incoming.
*Not a financial advice.
My charts speaks louder than words.
I'm a chartist and I paint charts.

TATA Chemical Selling Area--------------------------------------DISCLIMER--------------------------------------------------
* All the information shared in this chart is provided for strictly educational purposes only.
* This chart is sharing information are based on the theory of technical analysis .
* This is not an offer to buy or sell stocks, futures , options, commodity, forex, interests or any other trading security.
* Back test yourself before jump into live market consult your financial adviser and use proper risk management.
Entry for selling area 1045
SL will be 1082 (37-38 Point)
Target will be 927 (108 Point) / 890 (155 Point) / 808 (236 Point)
Risk and Reward will be 1.6
--------------------------------------------------------------------------------------------------------------------------------------------------------------------------
We are not a financial advisor and you should not construe any information discussed herein to constitute investment advice
This only for study purpose.
--------------------------------------------------------------------------------------------------------------------------------------------------------------------------
Thank you
Trading Cafe 24


Short Tata ChemicalsShort Tata Chemicals: Stoploss 1130 on daily Closing Basis. Target 850
Stock is heating Resistance at upper channel Line

TATACHEM : Rectangle pattern TATACHEM trading in Rectangle pattern in 15 min time frame.
If any bullish candle stick pattern formed near support line, we can see reversal of stock
If support break then its good to wait for retest and sell if find any bearish candle.
Like, Share, Comment for regular updates.
Disclaimer
I am not sebi registered analyst
My studies are Educational purpose only
Please consult with your Financial advisor before trading or investing

TATA CHEMICALSLong for 10 days
MACD-Signal line Crossover abow zero line.
RSI positive.
Higher volume generat.

Tata Chemicals breakoutTata Chemicals has given a bullish breakout of a flag pole pattern with heavy volumes. The stock might test its all time high level of 833 so one can easily expect around 5-8 % returns in short term.
Just for educational purpose.

SEND TATA CHEMICALS BACK TO ₹510Volume Profile has been an excellent indicator for the S/R
Price pump in 30 days to the tune of 67% from Feb21-Mar21 within 30 days!
Expecting a similar drawdown soon.
Volume precedes price, and it's coming down fast. NSE:TATACHEM

Tata Chemicals BUYTata Chemical trend line break .
Good point of entry
T1 :- 785
T2 :- 830
T3 :- 850


TATA CHEMICALSTATA CHEMICALS, near trendline, after breakout going to fly.
Once breakout done, enter on buy side.

Tata Chemicals: Go Long for a target of 800 Tata Chemicals is moving in a channel and has good volumes in the last 20 days (8+ Million average as against 3+Million during the last month) 795 looks like the immediate resistance if these volumes continue.

Tata Chemicals - First Target Rs. 485 Tata Chemical is showing good support on Gann Fans, followed by new Elliott wave supercycle, this stock will finally show some movements. Also, a recent breakout adds to the momentum.
My first target: Rs. 485


R-0226 Intraday Cash Buy TATACHEM @302.20-303.7 SL 297 TGT 315 Intraday Cash Buy TATACHEM @302.20-303.7 SL 297 TGT 315
Crosses pivot 296 + Next resistance 320/341 + Above VWAP 304.5 + Moving average and oscillators total 16 signals indicates a buy + Ichomoku cloud break out + TK cross over => GO LONG


TATACHEMTATACHEM moving in channel - Bullish
For Intraday Can be short/long considering the channels

