Bullish Symmetrical Triangle pattern formed in TataSteelBullish Symmetrical Triangle pattern formed in TATASTEEL. In a few days or weeks, the share price will suddenly start rising.
Tatasteel

Greate opportunity in Tata steels.So here is the 1 day chart of Tata Steel ,as you all can see it creates a head and shoulders pattern and give a breakdown, now it is coming back for retest.
So in this case we have two opportunities
1- if it breakout the neckline and crosses it the next target would be 1470 which is its previous shoulder and if it even breakout shoulder the next Target is 1530 which is head.
2- the second possibility is that if it can't cross the neckline and reverse back than this is the sign of selling pressure and for this scenario we have target of 1250.
From my observation there are higher chances of downtrend,but we have to aware of both opportunities
🙏🏿
Thanks and regards
Ankit Mathela
Keep trading 🔥

Tata Steel looking goodNSE:TATASTEEL
Important levels marked on the chart.
This is my personal view and not recommendation.

Tata Steel ready to moveDisclaimer:
All information shared is just for educational purposes.
By no means shall we be accountable for any debits/losses amounting out of it.
We are not SEBI registered Analysts, so please consult your Investment Advisor and take rational decisions.

Nifty, Banknifty, Top Stocks Analysis with imp leves!Analysis of Nifty, Banknifty and top stocks after Tata group companies rocket today's show!

Tata Steel 1hour Ascending Triangle Breakout 13 Oct 2021Tata Steel 1hour chart Ascending Triangle pattern made a Breakout 13 Oct 2021. Watch out for Fakeout / Retest.

Tata Steel 15min chart Ascending Triangle 10 Oct 2021Tata Steel 15min chart forming Ascending Triangle 10 Oct 2021. Watch out for breakout.

TATA steel taken support Tata steel taken support from 4hr time frame trendline
made Morning star pattern at 4hr time frame
RSI taken reached 40 level in weekly time frame
4hr time frame 200/ema taken support
higher volume
H&S pattern brokeout in 15minutes can wait for pullback and take entry

TATA STEEL - Divergence asisted reversal of polarity1. Divergence with RSI on daily TF.
2. Still has not not broken the July candle range.
3. Look at the RSI. It has always taken an up thrust whenever it has come near the demand zone.
4. We have a similar formation in the stock this time.
The trend might reverse from here.
These are my insights. I can be wrong as well.

Tata Steel - Buy OpportunityTata Steel - Buy Opportunity
Entry: 1452
SL: 1444
TG1 : 1498
TG2: 1425
TG3: 1445

TATA Steel Short Term ReversalThe stock has reached lower trendline and may undergo a reversal rally. Trade is supported by brokerage calls and Supports Nearby.
Risk Reward Ratio - 2:1
SL is placed below support zone & the lower trendline. The target is placed based on fundamentals.
Consolodating, Holding the levels.Tatasteel looking very very strong from here. Tomorrow could be trending day. SL 1407

Tata steelTata steel stock is in wave 5th of wave 3rd of the recent impulse till it ends, on daily charts, the most recent rally is ended in wave 3, as per theory,
both rsi and macd are showing bearish divergence in daily time frame, and this can also be seen in poor volumes and participations in metal stocks during the most recent rally, this is typical of wave 5 of some degree, as per scenario wave 4 depth of correction is marked near 1070 to 1100 range. it sounds hard but who knows we can go there if wave 3 comes to an end.
Key Levels are Mentioned on chart
Wave Structure and Volume
Rsi bearish Divergence in daily time frame
Macd bearish divergence in daily time frame
Creating bkt in daily time frame
Waiting for confirmation
Disclaimer
I am not sebi registered analyst
My studies are Educational purpose only
Please consult with your Financial advisor before trading or investing

Tatasteel Triangle BreakoutBuy or sell Tatasteel of it breaks either side with mentioned sloss & target


Tata steel intraday market analysis for 30/8/21 Tata steel is making symatrical triangle pattern if market gives breakout to this pattern then take buy or sell target.
if market open gapup then wait for retest 1382 level after retest you can take buy trade

TATA STEEL INVERTED CUP & HANDLE TATA STEEL INVERTED CUP & HANDLE - AUGUST 26
IN 5 MIN TIME FRAME ITS SO CLEAR
if it Breaks 1380 Go For Selling Based On Your Setup

TATA STEEL after retest TAT A STEEL is ready for breakout Strong support at 1470 and Resistance is 1535
BUY above 1510
&
SELL below 1490
For 20 point
NSE:TATASTEEL

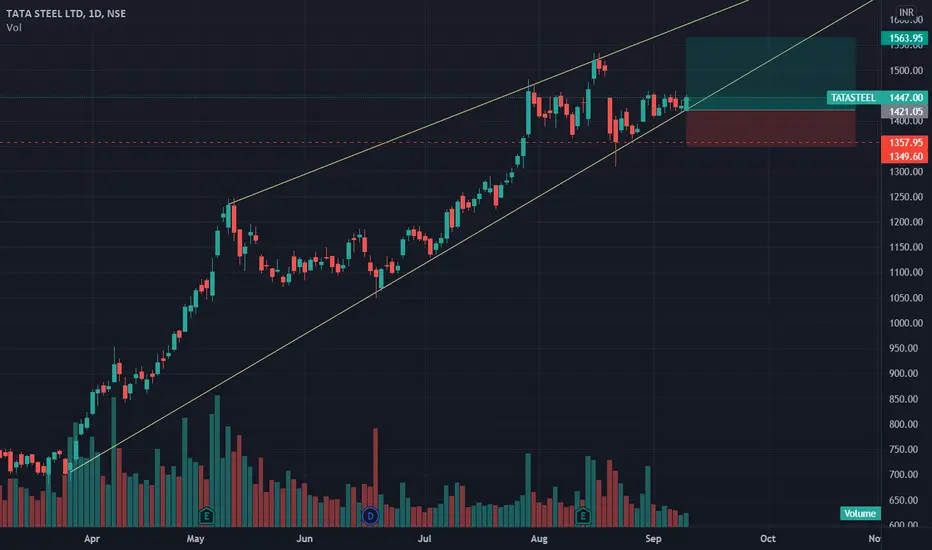
Rally in TATASTEEL can be ridden till 1500+ levelsTATASEEL has been on a good bulllish run for a while now. Been trailing it from the time it has crossed the 1000 levels. Once it broke that psychological level, it never even went close to that again. This shows great bullishness in the stock and therefore we can expect further momentum. Earnings to also be posted soon by the company. Near term target 1500. Stop Loss can be the last intraday swing 1367. CMP 1436. Cheeers and let's hope we trail 1500 this time!!!

Buy Tata Steel target 🎯 1700Buy Tatasteel target 🎯 1700 because if it sustained on its major Resistance It will go till 1700

Breakout resistanceTata Steel
-Resistance breakout can be expected around 1480 (might see), if yes, the sideways trend will be broken.
- bullish engulfing is formed on the previous trading day
Thank you!
please feel free to comment ur suggestion.

TATASTEEL - watch double topTATASTEEL trading at higher levels - with huge volumes
Currently facing resistance at this level - & also watch CNXMETAL -- also facing resistance --
Trading at 50/100/200 days moving avg's
Check NIFTY trend and also the current resistance level - before taking long position.
In short term, possible correction -- trade cautiously.
Please do own research before investing.
