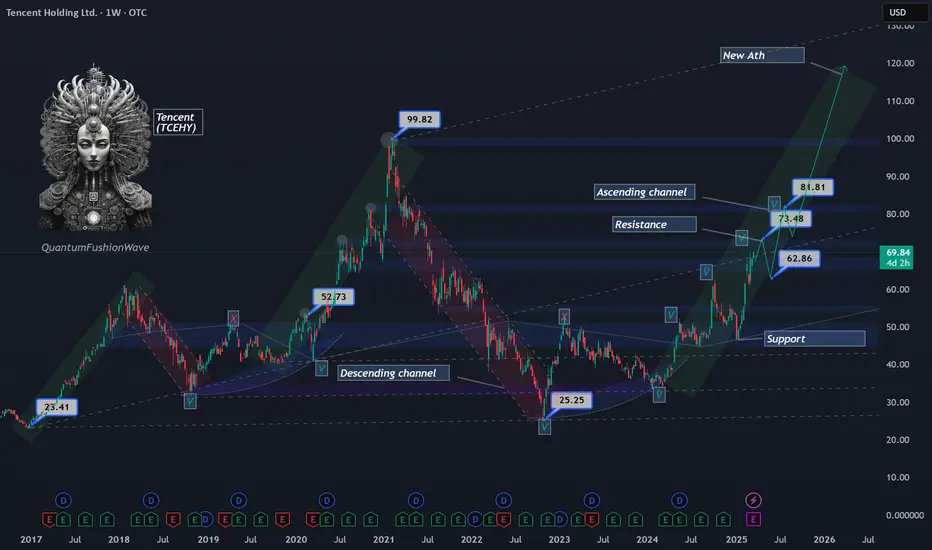
Tencent Holdings (TCEHY) – Technical & Fundamental OutlookTencent Holdings Limited (TCEHY) is currently trading between $62–$64, maintaining structure within a well-defined ascending channel. After testing the $73 resistance level—a key price from 2020—the stock faced rejection, triggering a retracement phase and a shift into a daily consolidation range.
This range now appears to be forming a short-term descending pullback channel, potentially continuing into June–July. Based on historical price action, the next key demand zone sits between $55–$60, a level that served as multi-year support and resistance from 2018 to 2024. A revisit of this zone would likely draw strong buying interest, making it a high-probability long opportunity.
Technical Levels to Watch:
Buy Zone: $55–$59 (long-term structural support)
Mid-Term Resistance: $73 (tested and rejected, but weak)
Breakout Target: $80–$81 (resistance from 2020)
Major Upside Level: $99 (2021 all-time high)
From a macro perspective, Tencent is strongly positioned in China’s growing tech ecosystem, with diversified operations across gaming, artificial intelligence, and quantum technologies. These sectors remain critical to the country's long-term innovation strategy.
If Tencent successfully holds the $55–$60 support zone and regains momentum, a move toward $80–$81 by September becomes plausible. A confirmed breakout above that range would put $99 back on the map, opening the door for new all-time highs into late 2025.
Conclusion:
Current market structure suggests we may be entering a healthy retracement phase within a larger bullish trend. The $55–$59 zone offers a favorable risk-reward area for long-term positions, with strong upside potential as Tencent continues to align with China’s tech-driven growth narrative.
TCEHY

Tencent Holdings (TCEHY) Poised for a Breakout Toward New HighsTencent Holdings Limited (TCEHY) is currently trading within a well-defined ascending channel, with price action averaging $68–$69. The key resistance level at $73—a price last seen in 2020—appears weak and could be easily broken, given the company’s strong positioning in China’s expanding economy.
With Tencent’s involvement in gaming, artificial intelligence, and quantum technologies, its growth prospects remain robust. If the $73 resistance is cleared, the next major target is $81. A decisive move beyond this level would set the stage for a potential retest of its 2021 high of $99, with the possibility of surpassing it as Tencent continues to capitalize on new technological advancements.
Given these factors, Tencent could be on track to reach new all-time highs by the end of 2025, making it a key stock to watch in the evolving global tech landscape.
TENCENT Buy signal at the bottom of the Channel Up.Tencent Holding (TCEHY) has been trading within a Channel Up since the November 15 2023 High and on Monday it made contact with the pattern's bottom (Higher Lows trend-line). As the 1D RSI turned oversold and rebounded, we believe that this is the best buy opportunity in almost 1 year.
Technically we should see the new Bullish Leg emerge now and a break above the 1D MA50 (blue trend-line) would confirm that, as it did on March 11 2024, which was only broken under again after the new Higher High was priced.
We are targeting a little below the 1.618 Fibonacci extension at $73.00.
-------------------------------------------------------------------------------
** Please LIKE 👍, FOLLOW ✅, SHARE 🙌 and COMMENT ✍ if you enjoy this idea! Also share your ideas and charts in the comments section below! This is best way to keep it relevant, support us, keep the content here free and allow the idea to reach as many people as possible. **
-------------------------------------------------------------------------------
💸💸💸💸💸💸
👇 👇 👇 👇 👇 👇

Tencent Holdings (TCEHY) Analysis Company Overview: Tencent Holdings OTC:TCEHY is poised for growth as the regulatory environment in China becomes more favorable, particularly in the gaming sector. The resumption of gaming license approvals has revitalized the market, allowing Tencent to launch new titles that resonate with consumers.
Key Catalysts:
Regulatory Recovery: The easing of regulatory scrutiny around gaming licenses has set the stage for Tencent to reinvigorate its gaming portfolio.
Success of Dungeon & Fighter Mobile: The release of Dungeon & Fighter Mobile has been a standout success, generating $270 million in iOS revenue within the first 30 days. This performance highlights strong consumer demand and effective marketing strategies.
Future Revenue Potential: Analysts forecast that Dungeon & Fighter Mobile could generate between RMB 15-18 billion in 2024, positioning it as Tencent’s most commercially successful game in five years, which bodes well for the company's overall revenue growth.
Investment Outlook: Bullish Outlook: We are bullish on Tencent above $47.00-$48.00, reflecting confidence in its ability to capitalize on the resurgent gaming market. Upside Potential: Our target for TCEHY is $70.00-$72.00, driven by the anticipated success of new game launches and a healthier regulatory landscape.
🚀 TCEHY—Unlocking Growth in Gaming and Beyond. #Gaming #Tencent #MarketRecovery

TENCENT Most optimal level to sell long-termTencent Holding LTD (TCTZF) has been trading within a long-term Channel Down since the January 30 2023 High. Such +1 year consistency is hard to overlook technically, especially since the price got rejected last week not just on the Channel Down top (Lower Highs trend-line), but also on the 1D MA200 (orange trend-line).
It has to be said that despite the rejection and the fact that the 1D MA200 has been essentially the Resistance since the August 10 2023 bearish break-out, it did manage a closing above it for the first time in such a long time-frame but the last Thursday - Friday strong rejection, potentially shows that the market hasn't shaken off the long-term bearish sentiment. On top of that, the 1D RSI got rejected exactly on its Resistance, the 70.00 overbought barrier, which is where it got rejected right before the last Lower High on November 14 2023.
As a result we turn bearish again on this stock, targeting $32.00, which represents a -21.12% decline from the top, the lowest decline it had within this +1 year Channel Down on the March 15 2023 Low. In fact all Bearish Legs have been pretty symmetrical, ranging from -21.12% to -24.85%.
-------------------------------------------------------------------------------
** Please LIKE 👍, FOLLOW ✅, SHARE 🙌 and COMMENT ✍ if you enjoy this idea! Also share your ideas and charts in the comments section below! This is best way to keep it relevant, support us, keep the content here free and allow the idea to reach as many people as possible. **
-------------------------------------------------------------------------------
💸💸💸💸💸💸
👇 👇 👇 👇 👇 👇

TCEHY/ATVI - Video Games#longshortcompetition Long: TCEHY / Short: ATVI
Not only do the technicals show a downtrend with support for Tencent. I for one can see the writing on the wall for activision blizzard . They aren't a "bad" company. But boy oh boy have they been taking L after L after L.
Whether its corporate structure, actual incompetence, etc. As someone who grew up on games from age 7-20, a few activision blizzard ones here and there, I've seen the gaming industry evolve MASSIVELY since I first started playing around 2007. Blizzard simply does not know what they're doing.
Diablo Immortal, Heroes of the Storm, Overwatch, World of Warcraft. All falling off a cliff overtime. Losing their player base and fans. Berkshire Hathaway is not going to change gamers. Don't even get me started on the work culture. The PR of this company AND the product have been dog water. I feel like it gets worse before it gets better for ATVI . I feel like throwing money at this can only work so much. They need to listen to actual gamers, their audience, not shareholders to dominate market share. I feel that this will be their biggest problem in the future, not monetization. A part of me wants to be wrong because I grew up with this company but I simply let the chart tell me what it wants to do.
Tencent has an enormous advantage. HUGE in China. Owns Riot Games, half of Epic Games, 5% of Activision Blizzard . Highest earning video game company in the world. They have a diversified gaming portfolio. Data Giant. Most popular game is League of Legends.
I do not ignore the issues of Tencent becoming unpopular, government issues with data, tax, fines, antitrust, etc. Both companies have black swan potential, Tencent more so. But overall If I had to hold either company for 2-3 years, its Tencent. I'm more bearish ATVI than Bullish TCHEY.
Also tradingview, I love your software <3.

TCEHY Price Target Price target for TCEHY Tencent is $56.
All the Chinese stocks are primed for a strong recovery after China`s top administrative authority said it would work to stabilize the stock market and boost economic growth!
Traders are expecting the Chinese government would support the stock market like the FED did in the US.

My 2 Cents on TencentTencent Holding - Short Term - We look to Sell at 65.50 (stop at 69.00)
Preferred trade is to sell into rallies. Trading within a Bearish Channel formation. 65.00 continues to hold back the bulls. The 200 day moving average should provide resistance at 67.00. Previous resistance located at 65.00. Further downside is expected although we prefer to set shorts at our bespoke resistance levels at 65.00, resulting in improved risk/reward.
Our profit targets will be 55.00 and 52.50
Resistance: 65.00 / 68.00 / 70.00
Support: 55.00 / 50.00 / 45.00
Disclaimer – Saxo Bank Group. Please be reminded – you alone are responsible for your trading – both gains and losses. There is a very high degree of risk involved in trading. The technical analysis, like any and all indicators, strategies, columns, articles and other features accessible on/though this site (including those from Signal Centre) are for informational purposes only and should not be construed as investment advice by you. Such technical analysis are believed to be obtained from sources believed to be reliable, but not warrant their respective completeness or accuracy, or warrant any results from the use of the information. Your use of the technical analysis, as would also your use of any and all mentioned indicators, strategies, columns, articles and all other features, is entirely at your own risk and it is your sole responsibility to evaluate the accuracy, completeness and usefulness (including suitability) of the information. You should assess the risk of any trade with your financial adviser and make your own independent decision(s) regarding any tradable products which may be the subject matter of the technical analysis or any of the said indicators, strategies, columns, articles and all other features.
Please also be reminded that if despite the above, any of the said technical analysis (or any of the said indicators, strategies, columns, articles and other features accessible on/through this site) is found to be advisory or a recommendation; and not merely informational in nature, the same is in any event provided with the intention of being for general circulation and availability only. As such it is not intended to and does not form part of any offer or recommendation directed at you specifically, or have any regard to the investment objectives, financial situation or needs of yourself or any other specific person. Before committing to a trade or investment therefore, please seek advice from a financial or other professional adviser regarding the suitability of the product for you and (where available) read the relevant product offer/description documents, including the risk disclosures. If you do not wish to seek such financial advice, please still exercise your mind and consider carefully whether the product is suitable for you because you alone remain responsible for your trading – both gains and losses.

China: Where is the bottom? Let's look at Tencent Some reasons why we're probably near a bottom with Chinese equities, +/- 10-20%
1) Since 2013, price has consistently respected the trendline - no different than a standard demand curve in economics. Trendlines are demand for price over a period of time and they work best when price revisits them often and shown to bounce after.
2) We also have the 200 week moving average that supported price during the correction of 2018 (President Donald Trump's trade war with China & the slowdown in global economic growth / concern that the Fed was raising interest rates too quickly)
- The 200wma also supported price during the Covid meltdown of 2020.
3) 2018 and 2020 resistance is now structure support + notice the gap that was just recently filled during yesterday's waterfall decline.
4) Tencent has retraced about 76% from the former impulse low to high, which is a standard deep retest in a correction (61.8% - 76% on the deeper end).
5) FXI is the Chinese large cap ETF - notice it hit the 200 Month moving average and bounced. You could see that here:
No position yet, but may be interested in LEAPS. Easier trades out there IMO... but if holding, this is definitely not a place to sell. Expect chop and time to base. V shape recovery is also possible here (but unlikely in my view due to sentiment damage and headline risk).
GL

$TCEHY / TENCENT has bottomedTencent has bottomed.
- Inverse H&S
- High volume
- Support from 200 WMA
- Support from trend line
- Oversold RSI
What else bottoming out needs? Nothing IMO.

$TCEHY / TENCENT has bottomed- Inverse H&S
- High volume
- Support from 200 WMA
- Support from trend line
- Oversold RSI
What else bottoming out needs? Nothing IMO.

$TCEHY / TENCENT has bottomedTencent has bottomed.
- Inverse H&S
- High volume
- Support from 200 WMA
- Support from trend line
- Oversold RSI
What else bottoming out needs? Nothing IMO.

Is this the bottom? Double your money from these levels?It may or may not be the bottom, may be another $10 downwards. But this is the time to buy chinese stocks. If it looses another $10 then buy more. My long term target is $150.

Tencent (TCEHY, 700) | Technical ConfirmationHi,
Another example of technical confirmation. Do your own fundamental research and if the future looks bright enough then you are ready to go from my marked buying box
Regards,
Vaido

Tencent at KEY technical levels!From a price action perspective, Tencent looks primed to make its next leg up. Firstly, price has found support on a bullish trendline formed in late 2018 that has been tested and held multiple times. Secondly, price has bounced off the weekly 200 day MA, as it has done previously in March 2020 and October 2018, with a high level of accuracy. Thirdly, price has made a 0.618 Fibonacci retracement, a key reversal level, from its October 2018 lows. Moreover, the RSI is showing oversold levels but more importantly is showing bullish divergence. Taken together, a trader may have a high level of bullish conviction based on these technicals - it really does look like a textbook move.
Despite this, from a fundamental perspective, Chinese tech stocks are under a massive amount of pressure from the Chinese government over monopoly concerns. Cathie Wood of ARK invest recently liquidated large amounts of holdings in Chinese tech stocks. Other Chinese tech stocks like Alibaba and Baidu have also recently suffered a deep slide in their share price.
Should the regulatory concerns blow over, this set up presents a very attractive reward. However, the fundamental risks must not be ignored and still present a very real threat to the stock price.

TCEHY Tencent Head And Shoulders Chart PatternIn the chart you can see a schoolbook Head And Shoulders Bearish Chart Pattern.
Theory says that you measure the distance from the neckline to the top and then consider the same distance to discover the bottom from the neckline down.
In this case it coincides with the strong 40usd support!
ARK also sold its positions in TCEHY Tencent Holdings Limited.
I`m looking forward to read your opinion about it!

#CHINA IS ALREADY THE WORLDS LARGEST SUPERPOWER!!! #CNBC...#FOXBUSINESS & #BLOOMBERG
IS HIDING IMPORTANT INFORMATION FROM YOU.
WHY???
#usa #GDP VS #ppp
I ALSO LOOKEVER #ALIBABA #BABA
DID THEY FIND jACK ma YET?
AND #TENCENT
WHICH LOOKS EXCEPTIONALLY GOOD.

#TCEHY - May increase by 20% and more in the future#TCEHY - May increase by 20% and more in the future
All trends favor bullish and also Fibo. Additional zones for buying are $ 81 and $ 67. If the price breaks through the $ 67 zone we should stop loss.
There are many hedge funds that have bought this stock.

LONG 700 (Tencent)Expecting bounce from extremely oversold weekly and daily levels. If stop breached, be prepared to catch new daily reversal on lower levels with a tight stop.

If you think market will be saved by 1.9 Trillion stimulus..!Today many newbies are happy because US Senate just passed the 1.9 trillion bill.
But let's see what happened in the last 8 weeks in the market.(MARKET CAP CHART)
The top ten companies with the highest market cap have lost almost 1.45 trillion of their market cap in the last 8 weeks.
Hypothetically, IF PEOPLE INVEST THE WHOLE 1.9 TRILLION IN THE STOCK MARKET IT IS NOT ENOUGH FOR TOCKS TO REACH TO ALL TIMES HIGHS.
Only Google and Berkshire behaved differently in the last 8weeks and they did not lose their market cap!
Please be realistic..!
PLEASE REVIEW MY PREVIOUS ANALYSIS ON MARKET CORRECTION SINCE JANUARY 29, 2021
Moshkelgosha


Bullish Engulfing - TCEHYBullish Engulfing Pattern formed after few constipating candles.
Price were consistently supported by 61.8%, last price closed above 50MA is another plus point to the trade.
However, suggest to protect profit as potential resistance at the gap above (78.6%).
