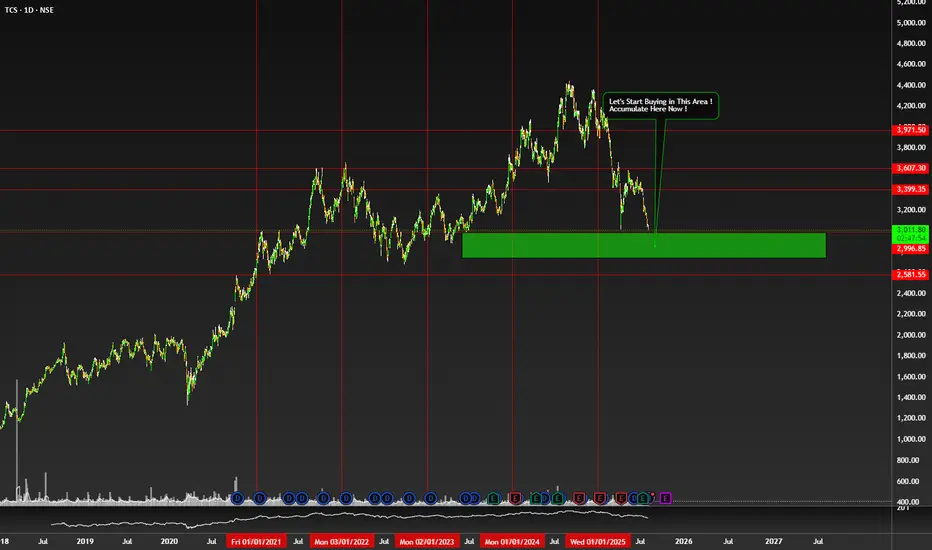
Time To Accumulate $NSE:TCS NSE:TCS
My Trade Opinion
Let's Accumulate here in Green area.
Best time to Buy here.
Don't Buy if Some One Think IT will Dead in india. :D
Future is at Some Time Ahead.
Don't Listen Just Observe it.
Company is Going to Aggressively Progress in Future.
TCS
TCS - D1 - Bearish Pennant 🧾 1. 📊 Q1 FY26 Earnings Summary
i. Revenue: ₹63,437 cr (~US $7.4 bn), up just 1.3% YoY, missing expectations of ~₹64,667 cr
ii. Profit/margin held up; revenue disappointed.
📌 Key Takeaway: Profit and margin resilience, but weak revenue growth flagged caution—all aligning with cautious global client sentiment.
🔮 2. Upcoming Events & Catalysts :
Ex‑Dividend Date: Record date July 16, for interim dividend of ₹11/share.
Macro Cues: U.S. tariff developments, global IT spend trends, and sector peers (HCL, Infosys) Q2 reports. Reflation in IT services could shift sentiment.
TCS Investor Engagements: Gen‑AI STEM program (Jul 9); presence at global fintech & life‑sciences events through Sep (SIBOS, COBA) .
📆 3. Catalysts Ahead :
Global IT Budget Trends (esp. U.S. and Europe) → direction for next‑quarter bookings.
Peer Q2 Results (HCL, Infosys) → could provide broader sector cues.
New Deal Wins from BFSI/USD clients → margin & growth potential.
Macro Developments: Trade policies, Fed signals, and inflation data.
Thank you.
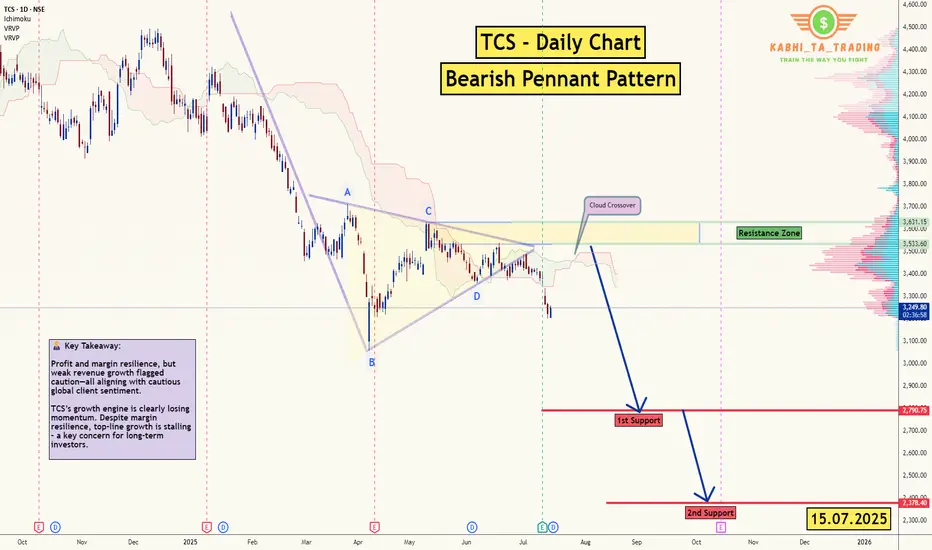
TCS is into Bearish zone, Could drop to 2800TCS is entered into Bearish zone on Monthly Chart and It could drop tp 2800 and below levels.
Note: This is not a buy/sell trade call. Trade at your own will and analysis. Use stop loss too.

Tata Consumer Products Ltd a bearish harmonic Gartley pattern Tata Consumer Products Ltd has formed a **bearish harmonic Gartley pattern, completing at point D near the 1.395 Fibonacci extension—typically a reversal zone. RSI is near overbought, suggesting caution. Based on this technical setup, the stock may face **selling pressure**, making it a sell recommendation with a target of ₹1,040 and a stop loss at ₹1,135. If the price breaks above ₹1,135 with strong volume, trend bias can shift bullish, but currently, it's best viewed with a short-term bearish outlook.
for educational purposes only

11 April Nifty50 trading zone update 22918 above positive trade veiw
22828 below nigetive trade view
22788 strong support
22988 strong resistance

11 April Nifty50 trading zone #Nifty50
99% working trading plan
👉Gap up open 22660 above & 15m hold after positive trade target 22818, 23118
👉Gap up open 22660 below 15 m not break upside after nigetive trade target 22492
👉Gap down open 22492 above 15m hold after positive trade target 22658, 22810 , 23118
👉Gap down open 22492 below 15 m not break upside after nigetive trade target 22372
💫big gapdown open 22372 above hold 1st positive trade view
💫big Gapup opening 22818 below nigetive trade view
📌For education purpose I'm not responsible your trade
More education following me

tcsclassical double bottom formation in tcs
breakout and retest done
if any kind of bullishness shown on lower time frame. make good entry

Tcs Short Daily time frameTCS Short in Daily time frame if the market is continuing sell trend, but expecting certain conditions has to be met which is been mentioned in the chart

TCS Analysis - Multi-Year Deal with Air France-KLMTrend: TCS is in a strong uptrend within an ascending channel since 2021, signaling steady growth potential.
Technical Signals:
EMA Support : Price bounced above key EMAs (20/50/100/200), showing strong support.
Volume Surge : High buying volume after the Air France-KLM deal indicates increased investor confidence.
RSI : Above 50, supporting bullish momentum.
Levels to Watch:
Support : ₹3,995.45 – Reliable base.
Immediate Resistance : ₹4,411.25
Final Target : ₹4,587.95 – Top of the channel.
Trade Setup:
Entry: On pullbacks or above ₹4,217.30.
Stop Loss : Below ₹3,995.45.
Target : ₹4,411.25 - ₹4,587.95.

TCS POSITIONAL LONG TRADE
Here is the valid Source and its Destination which has violated its opposite Supply;
This is the Demand & Supply Equilibrium Curve according to the Fresh Demand and Supply available.
We have further sub-divided the Curve into 5 areas; considering we as traders are supposed to buy low and sell high where is high and how low can it get; these areas give us an understanding about the Price position as per the Curve.
Price has come into the Demand making Lower Lows and then after reacting to the Weekly Demand Price has violated a previous High; which shows a possibility of Buyers upping their game vs the available sellers.
Finally we have a Demand formed in 45 mins which is the first Demand formed after Price has reacted to the Weekly Demand and we have a Buying momentum confirmation hence this is a Buy Trade favourable reward to risk ratio

TCS
NSE:TCS
One Can Enter Now !
Or Wait for Retest of the Trendline (BO) !
Or wait For better R:R ratio !
Note :
1.One Can Go long with a Strict SL below the Trendline or Swing Low.
2. R:R ratio should be 1 :2 minimum
3. Plan as per your RISK appetite and Money Management.
Disclaimer : You are responsible for your Profits and loss, Shared for Educational purpose

TCS gives brake out from Cup Handle Pattern NSE:TCS
TCS GIVES Brake out ON Daily Chart from Cup Handle Pattern.
I Am buying Tcs Stock on my buy level near 4150
and i Will follow sl of 3600
for geting target of 5200
Risk Reward 1:2
Return On Capital 25%
Time Duration 3-6 months

TCS Breaks March High with Volume Support: Potential UptrendTata Consultancy Services (TCS) has surpassed its March high, supported by strong volume, indicating a potential uptrend. Traders should watch for further gains as the stock shows positive momentum.

TCS- Buy-Swing trade- Will this be the end of downward range? NSE:TCS
01.07.2024
Buy Above:Strictly above 400
Target:4191
Stop Loss: 3812
1. Inside bar Breakout
2. Momentum gain in IT Sector
3. Price crossed above previous lower high in the downward range
by rejecting 200 EMA & channel midway.
4. Also price is above 21 & 50 EMA
5. Key level rejection found & fake breakout found in previous lower low
6. Price crosses 0.618 Fibonacci level in downward trend.
7. Good volumes in upside movement & low volumes in bearish candles

TCS Next Target is Channel Bottom. Now in 0.6 FibonacciNow TCS Reached 0.6 Fibonacci Retracement Target, after Breakout the Rising Wedge Pattern. And TCS Next Target is the Channel Bottom.
I want to help people to Make Profit all over the World.

#NIITLTD 113 TGT 130 #Coforge #MIT #FII #DII #stocks #tradingNIITLTD 113
TGT 130
TF < 3M
NSE:NIITLTD
If you like my work KINDLY LIKE SHARE & FOLLOW this page for free Stock Recommendations. With 💚 from Rachit Sethia

TCS: Thy turkey is done? 🕒- The Age of the Indian IT sector seems to be coming back, with NASDAQ:NDX gaining new momentum.
- This week was a good one for TCS
- It finally closed above its crucial resistance zone and the 3500 Mark
- It also broke the symmetric triangle formation, paving the way for future momentum.
-The next week will be crucial as the price spikes will sink in. The sustenance of the price will be crucial.
- We may witness some pullback/consolidation. A retest and continuation will only make the move stronger.
- If the price sustains, We may see a good 4000 level.
Caution: When the bull runs, everything seems lucrative. Being cautious always pays well. Remember, you will be buying the top.
If it helped, Do Leave us a boost 🚀. What is your take on it? Feel free to comment.
Disclaimer: We are not registered advisors. The views expressed here are solely personal opinions. Irrespective of the language used, Nothing mentioned here should be considered as advice or recommendation. Please consult with your financial advisors before making any investment decisions. We like everybody else, have the right to be wrong :)

Good time to long TCSIt is in good support region. Worth trying to enter now. I have given a big stop loss in case it crashes from here due to market crisis.

TCS BrakeoutWe can see that the TCS was in down Trent. It formed with higher high with higher low formation and now it braked to the last higher high. There is a chance to change this trend in to the up Trent. You can keep eye on this stock. Its for the medium or long term investment. Its a fundamentally strong IT stock. You can keep SL also that will help you to get this stock at best rate.

tcstcs results compare with chart
chart at best level
wait for the sustain 4000 level
can go 4500+ level
no recommendation for buy and sell

SANGHVIMOV 731 TGT 899(23%) SL 649 Recommended By Rachit SethiaSANGHVIMOV 731
TGT 899
SL 649
RETURN 23%+
RR > 2
TIMEFRAME <6Months
Buy and HOLD
Trade Idea Recommended By Rachit Sethia
Shared with 💚

TCS: SMA 200 for long positionHello traders,
The stock we are going to watch is $NSE:TCS. This stock is related to IT sector. This stock is mostly moving in an upward direction. Currently, it is taking some additional support of SMA200 in 4h time frame. This stock can shoot upwards at anytime.
If you're a option trader, consider buying the premium which is having the liquidity. Consider exiting near 4100 to protect your profits.
Thanks & regards,
Alpha Trading Station

India: IT Consultancy Industry chartThe trend was broken on 2nd March. I'm bearish on the IT Consultancy Industry going forward.
Note:
This is a custom index formed by equally weighing Large Cap IT consultancy stocks.
Relative Momentum (w.r.t. Nifty) indicator has been applied on the same.
Stocks considered for the index:
TCS
INFY
HCLTECH
WIPRO
LTIM
TECHM
TATAELXSI
LTTS
PERSISTENT
MPHASIS
